
Towards Certification of Autonomous Driving: Systematic Test Case
Generation for a Comprehensive but Economically-Feasible Assessment
of Lane Keeping Assist Algorithms
Thomas Ponn
1
, Dirk Fratzke
2
, Christian Gnandt
2
and Markus Lienkamp
1
1
Institute of Automotive Technology, Technical University of Munich, Boltzmannstraße 15, Garching bei M
¨
unchen, Germany
2
Autonomous Driving & ADAS, T
¨
UV S
¨
UD Auto Service GmbH, Daimlerstraße 11, Garching bei M
¨
unchen, Germany
Keywords:
Automated Driving, Advanced Driver Assistance Systems, Test Case Generation, Safety Assessment,
Homologation.
Abstract:
Automation of the driving task continues to progress rapidly. In addition to improving the algorithms, proof
of their safety is still an unsolved problem. For an automated driving function that does not require permanent
monitoring by the driver, a theoretically infinite number of possible traffic situations must be tested. One
promising method to overcome this problem is the scenario-based approach. This approach shall enable an
economic certification of automated driving functions with sufficient test space coverage. However, even with
this approach, the selection of the scenarios to be tested is still problematic. The first step is to consider a driver
assistance system in order to reduce complexity. For the Lane Keeping Assist System under consideration,
this paper defines a methodology as well as the scenarios for a comprehensive yet economically-feasible
certification. Economical-feasibility of the presented methodology is shown in the results by an approximation
of the resulting simulation costs for executing the defined test cases.
1 INTRODUCTION
Higher levels of automation according to (SAE J3016,
2016) require an increasing amount of testing to re-
lease and certify the systems. The crucial difference is
in the transition from level 2 (Partial Driving Automa-
tion) to level 3 (Conditional Driving Automation).
While up to level 2, the driver permanently monitors
the system and retains responsibility, this task is omit-
ted in level 3. With permanent driver monitoring, the
driver is able to capture any false positives or false
negatives made by the system. From level 3, however,
if the system makes a wrong decision, this can lead to
considerable risks or accidents. For this reason, the
test scope for the certification and release of systems
from automation level 3 must be more comprehensive
and carried out using new methods.
Many companies and projects are currently work-
ing on the development of new safety methods for
automated vehicles (e.g. PEGASUS (Deutsches
Zentrum f
¨
ur Luft- und Raumfahrt e. V., 2018) and
ENABLE-S3 (ENABLE-S3, 2018)). A major prob-
lem here is the selection of test scenarios. For the vali-
dation and release of level 1 and 2 systems (Advanced
Driver Assistance Systems, ADAS), a particular focus
is on functional safety according to ISO 26262 (Inter-
national Organization for Standardization, 2011) and
the effectiveness of the systems. In order to assess
their effectiveness, an examination is carried out of
how many real accidents that occurred can be avoided
or mitigated by the system. This is sufficient because
the permanent monitoring by the driver means that we
can assume that previously-safe traffic situations re-
main safe even with the system, and that, therefore,
no significant additional risks are introduced (Suzuki
et al., 2017). From automation level 3, formerly-safe
situations may potentially become unsafe, and must
be taken into account when the driving function is
tested. Since every conceivable situation can occur
in road traffic, theoretically an infinite number of test
scenarios must be covered or tested to prove safety.
The majority of situations occurring in real traf-
fic are uncritical. In scenario-based testing, the fo-
cus is, therefore, on relevant critical scenarios for the
system to be tested, thus reducing the testing effort.
Nevertheless, the complex problem of selecting rele-
vant scenarios that can be implemented with reason-
able effort remains. In order to develop a concept for
selecting these scenarios, as a first step this paper con-
siders a driver assistance system, the Lane Keeping
Ponn, T., Fratzke, D., Gnandt, C. and Lienkamp, M.
Towards Certification of Autonomous Driving: Systematic Test Case Generation for a Comprehensive but Economically-Feasible Assessment of Lane Keeping Assist Algorithms.
DOI: 10.5220/0007678603330342
In Proceedings of the 5th International Conference on Vehicle Technology and Intelligent Transport Systems (VEHITS 2019), pages 333-342
ISBN: 978-989-758-374-2
Copyright
c
2019 by SCITEPRESS – Science and Technology Publications, Lda. All rights reserved
333

Assist (LKA). The approach presented here will then
be extended in future work to highly automated driv-
ing functions.
2 RELATED WORK
This section lists standardized tests that currently ex-
ist for LKA systems. It will subsequently explain re-
lated work on the comprehensive creation of test sce-
narios for LKA systems. Finally, it gives an overview
of general procedures for defining test cases.
2.1 Standardized Test Scenarios
Currently, various organizations have standardized
tests for testing the functionality of LKA systems.
However, these benchmark tests do not provide proof
of safety, but only proof that the system meets certain
minimum requirements. The most important for the
European area are:
• UNECE, especially (UNECE, 2018): required for
type approval
• ISO, especially (International Organization for
Standardization, 2014): representing current state
of the art
• EuroNCAP, especially (EuroNCAP, 2017): pro-
vide safety information to consumers
The above tests, carried out by the three organi-
zations mentioned, are comparable in complexity and
scope. For the sake of clarity, this section is limited
to an explanation of the UNECE tests. For the type
approval of LKA systems on the European market,
compliance with the current version of UNECE R79
is required by law, which is why it has higher pri-
ority than ISO 22170 and EuroNCAP. UNECE R79
divides systems that actively intervene in the steering
of the vehicle into three categories, according to the
capabilities of the system:
Emergency Steering Function (ESF): a function
that automatically detects a possible collision and
intervenes in the steering in order to avoid the col-
lision.
Corrective Steering Function (CSF): a function
that automatically intervenes in the steering for a
short period of time in order to e.g. correct lane
departure.
Automatically Commanded Steering Function
(ACSF): a function that automatically intervenes
in the steering in order to assist the driver during
lane keeping.
An LKA system, as considered in this paper can be
assigned to the category ACSF. The UNECE divides
this category into the following subcategories:
Category A: a function that operates only at a maxi-
mum speed of 10 km/h.
Category B1: a function that assists the driver in
keeping the lane for a limited period.
Category B2: a function that assists the driver in
keeping the lane for an extended period.
Category C: a function that is able to perform one
single lateral maneuver (e.g. lane change). A
command by the driver is necessary.
Category D: a function that is able to perform one
single lateral maneuver (e.g. lane change). A con-
firmation by the driver is necessary.
Category E: a function that is able to perform lateral
maneuvers (e.g. lane changes). A command or
confirmation by the driver is not necessary.
Within the scope of this work, a LKA system of
category B1 is considered. In the current version of
the UNECE R79, tests already exist for the categories
B1 and C. For all other categories, no test procedures
are currently available.
The requirements and tests defined in UNECE
R79 can be divided into different areas, such as the
Human Machine Interface or the Object and Event
Detection and Response (OEDR)
1
. This paper fo-
cuses on the latter area. This corresponds to the re-
quirements of Annex 6 Paragraph 3.2.1 (Lane keep-
ing functional test) of UNECE R79, which are to be
carried out under specified test conditions. For exam-
ple, the requirements specify that the tests are to be
carried out on dry and level roads with clearly-visible
lane markings.
In the defined test sequences, tests are carried out
in various speed ranges (Table 1). For each speed
range, a maximum (a
y,max
) and a minimum (a
y,min
)
lateral acceleration is specified, which must be able
to be applied at most or at least by the steering in-
tervention of the LKA system. For a single test, a
test track with a curve is required, which is limited
on both sides by clearly-visible lane markings. The
speed is selected so that the lateral acceleration re-
quired to pass through the curve is 80 to 90 % of the
maximum lateral acceleration a
y,max
. This test must
be fulfilled for at least the four speed ranges given in
Table 1.
If the test meets these requirements, the LKA
system may be distributed in all member states. A
transfer of the functionality of the LKA system to
general situations is not foreseen, only in Annex 8
1
According to (SAE J3016, 2016)
VEHITS 2019 - 5th International Conference on Vehicle Technology and Intelligent Transport Systems
334

Table 1: Speed ranges and lateral accelerations of ACSF
Category B1 tests according to UNECE R79.
Speed range in
km
h
a
y,min
in
m
s
2
a
y,max
in
m
s
2
10 − 60 0.0 3.0
> 60 − 100 0.5 3.0
> 100 −130 0.8 3.0
> 130 0.3 3.0
Paragraph 3.2.1.3 it is required that the manufacturer
shall demonstrate to the technical service by appropri-
ate documentation that the system meets the require-
ments for all possible combinations of speed and lat-
eral acceleration. For the lane keeping functional test,
three Key Performance Indicators (KPI) are defined
according to Table 2:
Table 2: Key Performance Indicators (KPI) for the assess-
ment of the lane keeping functional tests according to UN-
ECE R79.
KPI Criteria Description
d
marking
≥ 0 Not allowed to cross line
a
lat
3.0m/s
2
Not allowed to exceed criteria
˙a
lat
5.0m/s
3
Not allowed to exceed criteria
The distance of the outer wheel to the lane mark-
ing is denoted as d
marking
. The lateral velocity and the
lateral jerk of the vehicle is referred to as a
lat
and ˙a
lat
,
respectively.
In general, standardized tests have the disad-
vantage that manufacturers can prepare themselves
specifically for the tests and optimize the performance
of their systems to meet the requirements of the test.
A statement about the system behavior in real road
traffic is only possible to a limited extent.
2.2 Comprehensive Test Scenarios
A first step towards comprehensive test case definition
for lane departure warning and lane departure preven-
tion systems is presented in (Kurt et al., 2015). A
large number of parameters and their discretization
are defined. But most parameter combinations are not
considered further because the scenarios are priori-
tized on the basis of accident databases. Therefore,
from this point, only situations that are critical to hu-
mans are considered. Once again, this leads to the
problem previously described in Section 1 that situa-
tions that may be critical to the system are not consid-
ered. This procedure is, therefore, not applicable for
higher degrees of automation.
HUANG (Huang et al., 2018) proposes a genera-
tion of test scenarios for level 2 vehicles built by the
permutation and combination of relative position and
movement directions of the test vehicle and surround-
ing traffic participants. The LKA system is only one
part of the examined system; therefore, the methodol-
ogy proposed is not directly applicable to LKA sys-
tems. Furthermore, variations at road level (e.g. cur-
vature or lateral slope of the lane) are not taken into
account.
SUZUKI (Suzuki et al., 2017) concluded that the
risks posed by automated systems in traffic decrease
at automation level 2 and will increase again at higher
levels. From Suzuki’s point of view, this means that
systems with a higher degree of automation will have
to be tested both systematically and extensively in the
future.
2.3 General Definition of Test Scenarios
Section 2.1 describes predefined test scenarios. To
be able to define scenarios in general, it makes sense
to use common terminology and a standardized pro-
cedure. At present, these standardizations are still
lacking. The terms and procedures explained in the
following are also used in the PEGASUS project
(Deutsches Zentrum f
¨
ur Luft- und Raumfahrt e. V.,
2018) and are already known outside the consortium
in industry and universities.
ULBRICH ET AL. define the terms “scene”, “situ-
ation” and “scenario” both in German (Ulbrich et al.,
2015b) and in English (Ulbrich et al., 2015a). While
a scene represents the complete snapshot of the sur-
roundings, a scenario describes the chronological se-
quence of scenes that begins with a certain start scene.
(Bagschik et al., 2017) (in German) and (Menzel
et al., 2018) (in English) make a further subdivision.
The authors distinguish between functional, logical
and concrete scenarios:
Functional Scenarios: Semantic description of a
scenario. The level of detail transmitted by speech
and images is low. An example of a functional
scenario is the description of the “Lane keeping
functional test” in Section 2.1.
Logical Scenarios: The scenario previously repre-
sented by speech and images is converted into
a description by parameters and their parameter
ranges. As an example, the representation of the
“Lane keeping functional test” in Section 2.1 can
be considered by the required parameters such as
velocity, lateral acceleration, etc., as well as their
corresponding parameter ranges.
Concrete Scenarios: If a fixed value is defined for
each parameter, this is referred to as a concrete
scenario. A logical scenario with continuous pa-
rameters can theoretically be used to derive an in-
finite number of concrete scenarios. Accordingly,
Towards Certification of Autonomous Driving: Systematic Test Case Generation for a Comprehensive but Economically-Feasible
Assessment of Lane Keeping Assist Algorithms
335

a fixed value can be assigned to each parameter of
the lane keeping functional test. Only then can a
scenario be clearly tested.
Another challenge in the creation of general sce-
narios is the definition of all relevant parameters.
To achieve this, the required parameters are defined
within different levels. This ensures a systematic and
complete identification of all parameters. (Schuldt,
2017) proposes a four-level model that (Bagschik
et al., 2018) extends to five levels. According to
(Bagschik et al., 2018), relevant parameters of a sce-
nario can be divided into the following five levels
2
:
• Road-level (L1)
• Traffic infrastructure (L2)
• Temporary manipulation of L1 and L2 (L3)
• Objects (L4)
• Environment (L5)
The number of parameters and their meaningful dis-
cretization leads to an unmanageable number of con-
crete scenarios. In order to reduce this problem, pro-
cedures can be used to reduce the number of test
cases, such as the Design of Experiments (DoE). The
alternative concept of functional decomposition has
been suggested by (Amersbach and Winner, 2017).
The automated driving function is divided into six
layers based on the Sens-Plan-Act principle. The
basis for the layers used comes from (Graab et al.,
2008), who has already arranged the human task of
driving in a comparable scheme. The purpose of func-
tional decomposition is to divide the entire system
into less complex subsystems and to test these sub-
systems separately. Due to the decreasing number
of influencing parameters on the subsystem level, the
number of necessary tests can be reduced.
2.4 Aim of the Paper
No comprehensive testing procedure currently exists
for LKA systems. This paper aims to close this gap. A
methodology, as well as the necessary parameters and
scenarios for a comprehensive safety assessment of an
LKA algorithm, are presented. To proof economical-
feasibility, the results show an approximation of the
resulting simulation costs. Even if the system under
consideration is a driver assistance system that must
be permanently monitored by the driver, a safe LKA
algorithm is an important component on the way to
safe automated driving functions.
2
The term “level” is used instead of the original term
“layer” to avoid confusion with the layers used by (Amers-
bach and Winner, 2017). Last-mentioned proposes the con-
cept of functional decomposition which is explained at the
end of this section.
3 METHODOLOGY
This paper examines an LKA system that assists the
driver in holding the lane for a limited period of time.
The vehicle is kept within the lane boundaries (e.g.
lane markings), but the system does not react to static
and dynamic objects within the lane. Because the
driver is responsible for the driving task at all times,
he must react to objects such as lost freight. Thus,
the levels 4 and 5 of the five-level model according to
(Bagschik et al., 2018) from Section 2.3 do not have
to be considered. In accordance with the UNECE R79
classification from Section 2.1, a system of this type
is included in category B1.
As has already been explained in Section 2.1, the
tests to be performed for the homologation of the sys-
tem are fixed. The parameters are only varied on the
basis of speed and lateral acceleration. An exact dis-
cretization of the parameters is not given. The aim
of this paper is to generalize the requirements for all
relevant parameters so that safe system behavior can
be transferred to general situations. This results in a
number of test cases that is several orders of magni-
tude higher, making the use of simulation indispens-
able. The precondition for this is an overall model that
is valid over the entire parameter space. The method-
ology for the required model validation is not part of
this publication. The interested reader is referred to
(Riedmaier et al., 2018).
3.1 Functional Decomposition
The principle of functional decomposition described
in Section 2.3 is used to reduce the number of relevant
test cases. For this purpose, only the LKA algorithm
and the vehicle are considered, which corresponds to
all parts of the plan and act layers in Figure 1. The
entire area of perception, including the sensor, is not
considered. For these reasons, level 5 from the five-
level model by (Bagschik et al., 2018) (Section 2.3)
can be omitted.
An important aspect of functional decomposition
is the definition of the interfaces between the layers
under consideration and those not under considera-
tion (Figure 1). For an LKA system, the perception
module must detect the limits of the lane. These may
be represented by lane markings, curbs or similar. If
a camera-based LKA system is assumed, an image-
processing algorithm detects where the lane bound-
aries are located after the images have been taken.
These can then be approximated by cubic splines, for
example. This mathematical description may repre-
sent the output of the sense plane and the input for the
plan plane respectively. The LKA algorithm can use
VEHITS 2019 - 5th International Conference on Vehicle Technology and Intelligent Transport Systems
336

Sense
Plan
Act
Vehicle Motion
Information
Course of Detected Lane Boundaries
Layer 0: Information Access
Layer 1: Information Reception
Layer 2: Information Processing
Layer 3: Situational Understanding
Layer 4: Behavioral Decision
Layer 5: Action
Figure 1: Reduction of complexity through functional de-
composition based on the concept by (Amersbach and Win-
ner, 2017). The sense level (gray), which represents the
camera sensor and image-processing, is omitted.
these boundaries to control the vehicle. The origin of
the lane boundaries is not relevant for the algorithm
itself. Within this paper, we assume an ideal and ex-
act representation of lane boundaries as an input for
the LKA algorithm.
3.2 Parameter Definition
The selection of relevant parameters is a decisive step
in the evaluation of automated driving functions and
strongly depends on the specific configuration of the
system to be investigated. Due to the application
of functional decomposition and the associated omis-
sion of sensor technology, level 2 does not have to
be considered according to Bagschik’s classification
(Bagschik et al., 2018). Levels 3 and 4 can also be
omitted due to the characteristics of the system, be-
cause it does not react to obstacles such as pylons or
moving objects.
In order for the parameters in Table 3 to be de-
fined, the levels of (Bagschik et al., 2018) are ex-
tended by a level 0, which represents the test ob-
ject. The parameters of this level can have a big in-
fluence on the performance of the system, for exam-
ple the sensitivity and intensity of the system, which
can be adjusted by the driver. Level 1 (road-level)
is mainly based on the German Motorway Construc-
tion Guideline (Forschungsgesellschaft f
¨
ur Straßen-
und Verkehrswesen, 2008). This guideline sets limit
values for many parameters of German motorways.
This paper examines the design class EKA 1, which
corresponds to long-distance and supra-regional mo-
torways. Also on the basis of the functional decom-
position, almost all of level 5 (environment) can be
Table 3: Definition of parameters and their range for vali-
dation of the LKA algorithm.
Description
Unit
Discretization
steps
Test object (level 0)
Longitudinal velocity
m
s
30, 70, 90, 130
Initial lateral pos. m left, middle, right
Initial heading
◦
-10, 0, 10
Mass kg empty, max
System sensitivity - low, middle, high
System intensity - low, middle, high
Road-level (level 1)
Surface - tarmac, concrete
Friction coefficient - 0.4, 0.9
Long. slope % -4.5, 0, 4.5
Lateral slope % -6, 0, 6
Width of lane m 2.50, 3.25, 3.75
Clothoid parameter m 240, 2,000, ∞
Curve radius m 720, 2,000, ∞
Hallow/crest radius m -5,700, 10,000, ∞
Ramp gradient
a
% 0.1a
b
, 0.9
Length of left spline
c
% 0, 50, 100
Length of right spline
c
% 0, 50, 100
Environment (level 5)
Wind velocity
m
s
0, 20
Wind azimuth angle
◦
90, 270
a
Ramp gradient describes of the change of lateral
gradient of the lane
b
a → Distance of the edge of the road from the
axis of rotation
c
Represents the existence or disappearance of lane
boundaries. Measured in percentage of the total
scenario length
omitted, because these parameters only influence per-
ception. Only wind (especially from the side) has
an influence on the performance of the system under
consideration.
Taking into account the assumption from Sec-
tion 3.1 that the exact courses of the lane boundary
are made available to the LKA algorithm, and using
the parameters from Table 3, the functionality of the
LKA algorithm can be tested over the entire operat-
ing range. In order to test the robustness of the algo-
rithm, additional parameters must be defined (Table
4). On the one hand, the assumption of ideal input
data must be discarded and more realistic input data
must be used. For this purpose, the data can be sub-
jected to noise of different intensity. In addition, the
missing effect of different environmental conditions
(e.g. fog) is replaced by a shortened range of the sen-
sors. A shortened range means that the length of the
lane boundary, which is made available to the algo-
Towards Certification of Autonomous Driving: Systematic Test Case Generation for a Comprehensive but Economically-Feasible
Assessment of Lane Keeping Assist Algorithms
337

Table 4: Definition of parameters used for robustness test-
ing of the LKA algorithm.
Description
Unit
Discretization
steps
Due to functional decomposition
Add noise to
lane boundary splines dBW low, mid, high
Limited rage of
camera sensor m 20, 40, 60
Due to external influences
Road waviness - low, mid, high
Sinusoidal steering torque
Amplitude Nm low, high
Frequency Hz low, high
Steering torque impulse
Amplitude Nm low, high
Duration s short, long
rithm in the form of splines, is shortened to the corre-
sponding length.
In addition, external influences must also be taken
into consideration to check robustness. Road imper-
fections can influence the performance of the system
and are taken into account by the waviness of the road.
In addition, the driver can unintentionally apply steer-
ing torque. Because the system provides a steering
torque, it is important to test how this deals with the
driver’s input of disturbance torque.
3.3 From Functional to Concrete
Scenarios
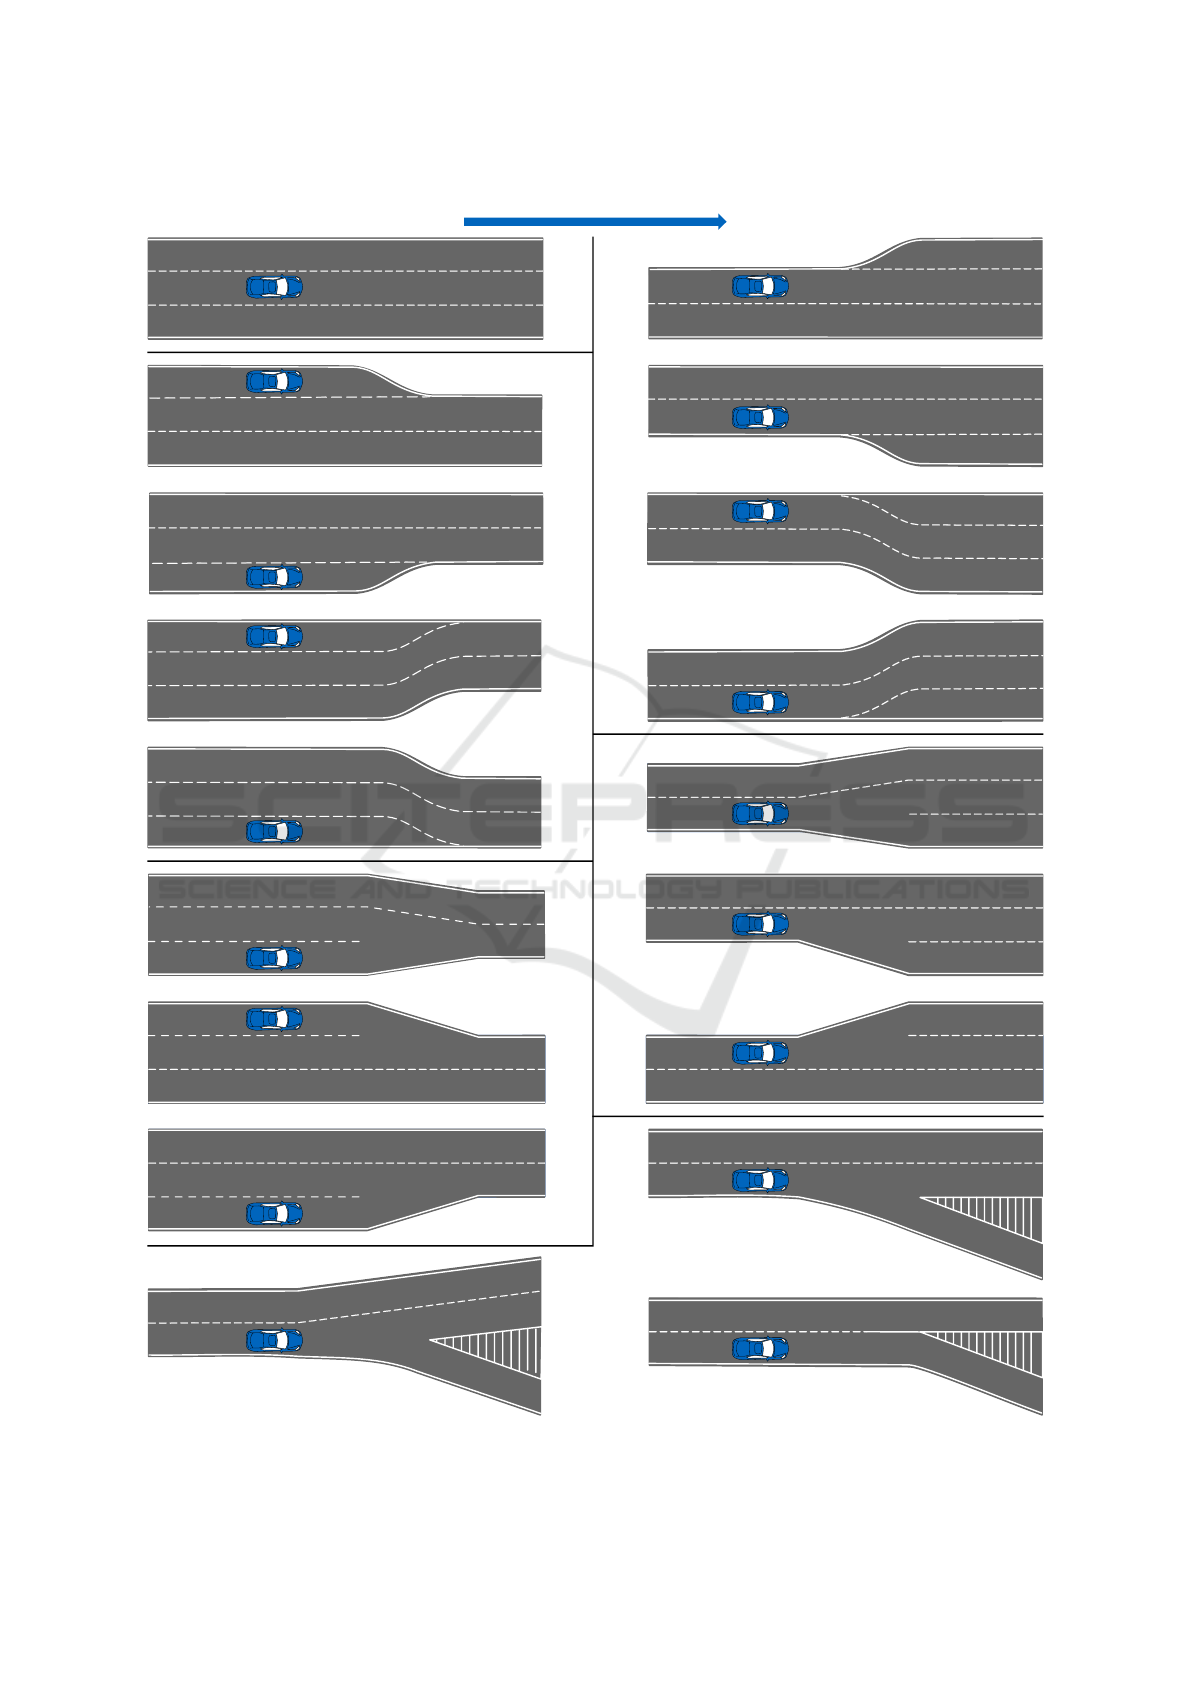
The next step is to define functional scenarios. These
represent basic maneuvers of which the LKA system
must be capable. A short description of the scenar-
ios can be found in Table 5. Furthermore, a graphical
representation can be seen in Figure 2. The proba-
bility of scenarios 7 and 9 from Table 5 and Figure
2 occurring is low, but these can occur in the area of
construction sites. They are, therefore, included here
for the sake of completeness. The basis for these sce-
narios is mainly expert knowledge.
The 19 functional scenarios from Figure 2, in
combination with the parameters from Table 3 and
Table 4, represent the logical scenarios. In order for
the LKA algorithm to be evaluated, concrete scenar-
ios are required so that the test cases can be exe-
cuted. These are achieved by the definition of spe-
cific parameter values. In order to achieve sufficient
parameter space coverage, so-called N-wise testing is
used. Therefore, the combination is divided into two
groups. This means that all discretization steps of all
parameters are combined with each other. On the one
Table 5: Description of functional scenarios (Figure 2).
Standard
1 Constant lanes
Start of lane
2 New lane left with road broadening left
4 New lane right with road broadening right
6 New lane left with road broadening right
8 New lane right with road broadening left
End of lane
3 Left lane ends with road narrowing right
5 Right lane ends with road narrowing left
7 Left lane ends with road narrowing left
9 Right lane ends with road narrowing right
Lane splitting
10 Lane widening both directions
12 Lane widening right
14 Lane widening left
Lane merging
11 Lane narrowing both directions
13 Lane narrowing left
15 Lane narrowing right
Road fork
16 Inclined new lane
17 Lane splitting fork
18 Existing lane bends to the right
hand, the parameters from Table 3 are combined to
enable validation of the LKA algorithm. On the other
hand, the parameters from Table 4 are combined to
verify the robustness of the LKA algorithm.
4 RESULTS
This section examines the total number of concrete
scenarios resulting from the N-wise testing described
in Section 3.3. Furthermore, it approximates the time
and cost involved for executing the concrete Scenar-
ios.
4.1 Number of Concrete Scenarios
To validate the LKA algorithm, the 19 parameters
from Table 3 must be taken into account and com-
bined with each other. The total number of parameter
combinations n
comb
results from the multiplication of
the number of discretization steps of the individual
parameters d
i,val
according to Equation 1 to:
n
comb
=
19
∏
i=1
d
i,val
= 1.36 · 10
8
. (1)
VEHITS 2019 - 5th International Conference on Vehicle Technology and Intelligent Transport Systems
338
Driving Direction
1
2
3
4
5
6
7
8
9 10
11
12
13
14
15
16
17
18
Figure 2: Overview of the defined functional scenarios. A short description can be found in Table 5.
Towards Certification of Autonomous Driving: Systematic Test Case Generation for a Comprehensive but Economically-Feasible
Assessment of Lane Keeping Assist Algorithms
339

In order to calculate the total number of concrete
scenarios n
scen,val
for the validation of the LKA al-
gorithm, the number of functional scenarios n
scen,func
from Figure 2 must be multiplied by the number of
parameter combinations n
comb
(Equation 2).
n
scen,val
= n
scen,func
· n
comb
= 2.45 ·10
9
(2)
4.2 Estimation of Simulation Costs
The costs associated with the scenarios to be carried
out are even more relevant here than the number of
actual scenarios. As explained in Section 3, the use
of simulation with validated simulation models is in-
evitable. Even if the costs are much lower compared
to testing site tests, the costs for simulation are not
negligible. Thus, the costs are to be estimated in the
following.
The execution of a simulation can generally be di-
vided into the three steps preprocessing, processing
and postprocessing. Preprocessing includes the one-
time creation of functional scenarios (Figure 2) with
automated parameter variation (Table 3). Processing
takes into account the execution of all concrete sce-
narios n
scen,val
. Finally, the KPIs from Table 2 are
automatically evaluated in postprocessing, and a deci-
sion is made about pass or fail. This last step is minor
in terms of effort. Due to the one-time nature or min-
imal effort involved in these steps, the costs for pre-
processing and postprocessing are omitted from the
subsequent steps. Additionally, the costs for validat-
ing the simulation models are omitted (Section 3).
The computing costs for the processing depend
mainly on the level of detail of the simulation mod-
els used. These include models of the vehicle, driver,
driving function, environment and sensors. The lim-
iting factors with regard to computing power are usu-
ally particularly complex but very valid physical sen-
sor models that use the ray-tracing method, for ex-
ample. When functional decomposition is used (Sec-
tion 3.1), the sensors are not considered and instead
ideal splines are used as input for the LKA algorithm.
Thus, simple models with low computational effort
can be used for the simulation. In order to approx-
imate the simulation costs, the required simulation
time must first be quantified. In addition to the total
number of concrete scenarios n
scen,val
, several factors
defined in Table 6 are critical in this regard.
Factor t
scen,real
is the average duration of a scenario
measured in real time. This value was determined on
the basis of experience. The n
real-time factor
is the fac-
tor with which the simulation is executed faster than
real time. This factor, as well as the time needed
to initialize the simulation t
sim init
and save the sim-
ulation results t
save
, has been estimated using a com-
Table 6: Influencing factors for determining the simulation
costs.
Factor Value
n
scen,val
2.45 · 10
9
t
scen,real
15.0s
n
real-time factor
40.0
t
sim init
1.0s
t
save
0.1s
mercial simulation tool in combination with a stan-
dard computer (Intel i7-6820HQ 2.70 GHz, 4 Cores,
16 GB RAM). This results in a total simulation time
t
sim
of 1.0 · 10
6
h according to Equation 3.
t
sim
=
t
scen,real
n
real-time factor
+ t
sim init
+ t
save
n
scen,val
(3)
Due to the long simulation duration, a massive
parallelization of the simulation is necessary. In order
to execute the specified number of scenarios within
one week, 5,975 simulations must be executed in par-
allel. For example, commercial cloud-based solutions
– which provide virtual machines – such as Microsoft
Azure can be used. A suitable virtual machine as well
as the resulting costs can be found in Table 7.
Table 7: Description of an available and suitable virtual ma-
chine at Microsoft Azure and the resulting costs for execut-
ing 2.45 · 10
9
scenarios.
Costs
Cores RAM Priority Single Total
2 4 GB Low 0.014
e
h
e 14,053
The execution of the scenarios on the super-
computer of the Leibniz-Rechenzentrums (Leibniz
Supercomputing Centre)
3
, known as the SuperMUC-
NG, is regarded as an alternative means of estimating
costs. Detailed specifications of the supercomputer
can be found in (Leibniz Supercomputing Centre,
2018). According to (Leibniz Supercomputing Cen-
tre, 2017), the total costs amount to almost e 44,000
per day calculated over six years. If one assumes
that a simulation can be carried out on each of the
cores, of which there are just over 300,000 in total,
it will take 3.24 h to execute all scenarios, which is
equivalent to a cost of e 5,914. The pure simulation
costs are lower than with the cloud-based solution,
but this option does allow more flexible use, and,
furthermore, no costs are accrued if it is not used. In
summary, both methods result in an acceptable cost
expenditure for certification of e 14,053 and e 5,914,
respectively.
3
https://www.lrz.de/services/compute/
VEHITS 2019 - 5th International Conference on Vehicle Technology and Intelligent Transport Systems
340

If the validation of the LKA algorithm has yielded
a positive result, the robustness of the algorithm can
be tested. For example, the n
scen,border
scenarios from
the validation of the LKA algorithm that came clos-
est to the pass/fail limit can be used. It does not
make sense to use all scenarios, because they will
implicitly be part of the overall system test as well.
Only the general robustness of the algorithm is to be
tested here. The selected scenarios are combined with
the seven parameters d
i,robust
from Table 4 and the
test cases are executed. When choosing n
scen,border
=
1.0 · 10
3
, this results in a number of 4.32 ·10
5
scenar-
ios (Equation 4) denoted as n
scen,robust
.
n
scen,robust
= n
scen,border
·
7
∏
i=1
d
i,robust
(4)
This number of scenarios leads to negligible costs
of e 2.48 for the cloud solution and e 1.04 when the
super computer SuperMUC-NG is used and allows
the performance of the algorithm in the overall sys-
tem to be assessed. Again, the KPIs from Table 2 can
be used as evaluation metrics.
Table 8 summarizes the total costs for both
the cloud solution and use of the super computer
SuperMUC-NG.
Table 8: Summary of costs for executing 2.45 · 10
9
scenar-
ios for LKA algorithm validation and 4.32 · 10
5
scenarios
for LKA algorithm robustness test.
Cloud solution SuperMUC-NG
Validation e 14,053 e 5,914
Robustness ≈ e 2 ≈ e 1
Total e 14,055 e 5,915
5 DISCUSSION
When parameters are defined (Section 3.2), contin-
uous parameters such as the speed of the test vehi-
cle must be taken into account. For the execution
of concrete scenarios, these parameters must be dis-
cretized. An exact representation of a continuous pa-
rameter by discrete values is not possible, which is
why complete coverage of the test space cannot be
provided, even with this procedure. However, com-
plete coverage is also not necessary from a technical
standpoint, because too fine a discretization leads to
quasi-redundant test scenarios. Furthermore, the gen-
erated scenarios must be checked for consistency in
order to exclude possible unrealistic parameter com-
binations.
In complex systems, such as the (partially) auto-
mated execution of the driving task, a successful test
of individual components according to the functional
decomposition is no substitute for tests at the overall
system level. The reason for this is the increasing in-
teraction between the subsystems. For example, if the
sensor module and LKA algorithm have been tested
successfully, errors may occur in the overall system
due to incorrect transmission of information.
It can be assumed that any change in the algorithm
will require re-testing of the entire scenarios. There-
fore, the costs of executing the simulation (process-
ing) are of great importance. According to Moore’s
Law, a further improvement in the performance of the
computers used for simulation can be expected in the
future, which will lead to a significant reduction in
costs. This will be required in order to cope with the
increasing number of necessary parameters and, thus,
also scenarios for higher degrees of automation.
6 CONCLUSION AND FUTURE
WORK
This paper proposes a new method for an effective and
comprehensive safety assessment of a Lane Keeping
Assist algorithm. Proofing completeness in captur-
ing all relevant scenarios is impossible, but with the
presented approach, it is well founded to achieve a re-
markable level of safety and an economic-feasibility
at the same time. Compared to the limited number
of standardized tests currently used for homologation,
this approach enables the determination of real world
driving behavior of the system. In addition, this novel
approach can be one component for an evaluation of
automated driving functions.
In the next step, the test cases defined must be
implemented in the simulation and evaluated using a
concrete Lane Keeping Assist algorithm.
REFERENCES
Amersbach, C. and Winner, H. (2017). Functional decom-
position: An approach to reduce the approval effort
for highly automated driving. In 8. Tagung Fahreras-
sistenz, M
¨
unchen.
Bagschik, G., Menzel, T., and Maurer, M. (2018). Ontol-
ogy based scene creation for the development of au-
tomated vehicles. In 2018 IEEE Intelligent Vehicles
Symposium (IV), pages 1813–1820.
Bagschik, G., Menzel, T., Reschka, A., and Maurer, M.
(2017). Szenarien f
¨
ur entwicklung, absicherung und
test von automatisierten fahrzeugen. In Uni-DAS e.V.,
Towards Certification of Autonomous Driving: Systematic Test Case Generation for a Comprehensive but Economically-Feasible
Assessment of Lane Keeping Assist Algorithms
341

editor, 11. Workshop Fahrerassistenzsysteme, Darm-
stadt. Uni-DAS e.V.
Deutsches Zentrum f
¨
ur Luft- und Raumfahrt e. V. (2018).
Pegasus-projekt. https://www.pegasusprojekt.de/en/
home. 28.11.2018.
ENABLE-S3 (November 2018). European initiative to en-
able validation for highly automated safe and secure
systems. https://www.enable-s3.eu/. 28.11.2018.
EuroNCAP (November 2017). Test protocol - lane sup-
port systems. https://cdn.euroncap.com/media/32287/
euro-ncap-lss-test-protocol-v201.pdf. 28.11.2018.
Forschungsgesellschaft f
¨
ur Straßen- und Verkehrswesen
(2008). Richtlinien f
¨
ur die anlage von autobahnen.
Graab, B., Donner, E., Chiellino, U., and Hoppe,
M. (2008). Analyse von verkehrsunf
¨
allen hin-
sichtlich unterschiedlicher fahrerpopulationen und da-
raus ableitbarer ergebnisse f
¨
ur die entwicklung adap-
tiver fahrerassistenzsysteme. In 3. Tagung Aktive
Sicherheit durch Fahrerassistenz.
Huang, L., Xia, Q., Xie, F., Xiu, H., and Shu, H. (2018).
Study on the test scenarios of level 2 automated ve-
hicles. In 2018 IEEE Intelligent Vehicles Symposium
(IV), pages 49–54.
International Organization for Standardization (2011).
Road vehicles — functional safety: First edition 2011-
11-15.
International Organization for Standardization (2014). In-
telligent transport systems — lane keeping assistance
systems (lkas) — performance requirements and test
procedures: First edition 2014-05-15.
Kurt, A.,
¨
Ozbilgin, G., Redmill, K. A., Sherony, R., and
¨
Ozg
¨
uner,
¨
U. (2015). Test scenarios, equipment and
testing process for ldw ldp performance evaluation. In
SAE, editor, Technical Paper 2015-01-1404.
Leibniz Supercomputing Centre (14. Dezmber 2017).
”supermuc-ng” -– next generation supercom-
puter at leibniz supercomputing centre. https:
//www.lrz.de/services/compute/supermuc/supermuc-
ng/press/LRZ
SuperMUC NG english.pdf.
28.11.2018.
Leibniz Supercomputing Centre (November 2018). Charac-
teristics of supermuc-ng. https://www.lrz.de/services/
compute/supermuc/supermuc-ng/. 28.11.2018.
Menzel, T., Bagschik, G., and Maurer, M. (2018). Scenar-
ios for development, test and validation of automated
vehicles. CoRR, abs/1801.08598.
Riedmaier, S., Nesensohn, J., Gutenkunst, C., Duser, T.,
Schick, B., and Abdellatif, H. (2018). Validation of
x-in-the-loop approaches for virtual homologation of
automated driving functions. In 11th Graz Symposium
Virtual Vehicle (GSVF).
SAE J3016 (2016). Taxonomy and definitions for terms re-
lated to on-road motor vehicle automated driving sys-
tems.
Schuldt, F. (24.04.2017). Ein Beitrag f
¨
ur den method-
ischen Test von automatisierten Fahrfunktionen mit
Hilfe von virtuellen Umgebungen. Dissertation, Tech-
nische Universit
¨
at Braunschweig, Braunschweig.
Suzuki, K., Asao, T., Hayashi, J.-i., and Miichi, Y. (2017).
Safety evaluation of advanced driver assistance sys-
tems as human-machine systems. International Jour-
nal of Automotive Engineering, 8(4):163–170.
Ulbrich, S., Menzel, T., Reschka, A., Schuldt, F., and Mau-
rer, M. (2015a). Defining and substantiating the terms
scene, situation, and scenario for automated driving.
In 2015 IEEE 18th International Conference on Intel-
ligent Transportation Systems, pages 982–988.
Ulbrich, S., Menzel, T., Reschka, A., Schuldt, F., and Mau-
rer, M. (2015b). Definition der begriffe szene, situ-
ation und szenario f
¨
ur das automatisierte fahren. In
Workshop Fahrerassistenzsysteme, Walting, Germany.
UNECE (18. Oktober 2018). Regulation no. 79 re-
vision 4: Uniform provisions concerning the ap-
proval of vehicles with regard to steering equip-
ment. https://www.unece.org/fileadmin/DAM/trans/
main/wp29/wp29regs/2018/R079r4e.pdf. 28.11.2018.
VEHITS 2019 - 5th International Conference on Vehicle Technology and Intelligent Transport Systems
342
