
Nudging by Predicting: A Case Study
Niels Heller and Franc¸ois Bry
Institute for Informatics, Ludwig-Maximilian University of Munich, Germany
Keywords:
Personalisation, Educational System, Predictive Learning Analytics, Case Study.
Abstract:
Nudging students to a better learning is a common practice among teachers of small classes which is im-
possible in large classes. Indeed, no teacher has enough time for giving individual feedback to several tens
or hundred students, let alone be sufficiently aware of the progress and difficulties of each of them. This
article reports on a case study using computed individual predictions for sustaining the motivation of large
class’ audiences thus nudging them to a better learning. More precisely, this article reports on a case study
in which students are given individual predictions of their withdrawal, or “skipping”, and examination perfor-
mances with the aim of increasing their participation to classes and to homework. A real-life evaluation of the
approach in a computer sicence course points to both its effectiveness and its positive reception by students.
1 INTRODUCTION
In classes with up to about 25 students, teachers
can be at any time well aware of every student’s
skills, weaknesses, and difficulties. In such small
classes, most teachers constantly nudge their students
by drawing their attention to learning-relevant issues
or by gently encouraging them. In large classes, that
is, classes with several tens to several hundreds of
students, which are widespread in higher European
STEM education, teachers cannot be aware of the
skills, weaknesses, and difficulties of every student.
As a consequence, large class teachers can neither
provide individual feedback nor individually nudge
students to a better learning. This article reports
on using learning analytics for automatizing individ-
ual feedback and individual nudging in large classes,
by using computed individual predictions of the stu-
dents’ future achievements.
The nudging reported about in this article primar-
ily aims at encouraging students not to skip home-
work assignments. It relies on two kinds of personal
predictions: A “skipping prediction” which estimates
the likeliness of skipping the next assignment and a
“examination fitness prediction” which estimates the
likely performance at the course’s final examination.
The predictors are trained on data (on homework and
final examination performances) gathered in former
venues of the same course (assuming similar students’
behaviours). During the course, students are shown
their individual predictions that are constantly up-
dated after their accumulated performances so far.
For the purpose of the case study reported about in
this article, the aforementioned individual predictions
were integrated as individual feedback to students in
an online learning platform which was also used to
organize homework submission and correction in a
bachelor course on theoretical computer science.
The research presented in this article is focused at
the following two research questions:
1. Can the learning behavior of students be posi-
tively impacted with such a nudging?
2. What are the students’ attitudes towards such a
nudging?
To answer these questions, student homework per-
formances in a course venue with prediction-based
nudging were compared to homework performances
of students in previous course venues, where no such
nudging took place. The results point to positive
changes in the students’ behaviour: Students sub-
jected to the described nudging skipped slightly less
assignments and students who skipped one assign-
ment submitted the next assignment slightly more of-
ten than students who were not nudged.
Furthermore, survey results show that students
found the predictions they were nudged with nei-
ther discouraging nor particularly encouraging but
nonetheless interesting. The observation of a general
interest among students for the proposed nudging is
backed with an analysis of the students’ behaviour
during the course: The students consulted their own
236
Heller, N. and Bry, F.
Nudging by Predicting: A Case Study.
DOI: 10.5220/0007680102360243
In Proceedings of the 11th International Conference on Computer Supported Education (CSEDU 2019), pages 236-243
ISBN: 978-989-758-367-4
Copyright
c
2019 by SCITEPRESS – Science and Technology Publications, Lda. All rights reserved

individual predictions throughout the semester with a
raise in consultation towards the end of the semester.
This article extends former research that intro-
duced predictors of examination performance and
skipping, and reported on their quality (Heller and
Bry, 2018). The novel contributions of this article is a
report on an experimental evaluation of the influence
of reports generated by these predictors on student be-
haviour.
This article is organized as follows. Section 1 is
this introduction. Section 2 surveys the related liter-
ature. Section 3 describes the methods of the exper-
iment. Section 4 reports on the results of the evalua-
tion. Section 5 discusses the results and limitations of
the evaluation. Section 6 concludes this article with
perspectives for future work.
2 RELATED WORK
This article refers to learning analytics, homework
error classification, dropout and examination perfor-
mance prediction, and automated feedback to learn-
ers. Former research on these issues is reviewed in
the following.
Cooper defines homework as “tasks assigned to
students by school teachers that are meant to be car-
ried out during non school hours” (Cooper, 1989,
p. 86). While the impact of homework on learn-
ing outcomes is still a debated issue (Cooper, 1989;
Trautwein and K
¨
oller, 2003), homework is mostly
considered beneficial because it can mediate self-
efficacy (Zimmerman and Kitsantas, 2005). In the ed-
ucational setting evaluated in this article, homework is
always reviewed by teachers and results in individual
feedback to learners which is known to be among the
most effective enablers of learning (Hattie and Tim-
perley, 2007; Hattie, 2015).
The predictors used in the evaluation reported
about in this article rely on sequences of categorized
homework submissions. The categorization scheme
used for these predictors which is presented in Section
3 is inspired from Radatz’ investigations of procedu-
ral errors (Radatz, 1979) and Newman’s error analy-
sis (Clements, 1980). Radatz’ procedural error cate-
gory “errors due to insufficient quality of conceptual
understanding” is closely related to the category “In-
sufficient Knowledge” used in building the predictors
used in the evaluation reported about in this article.
Newman’s error analysis (Clements, 1980) is based
on a hierarchy of steps (which may result in errors) in
problem solving tasks. Both Radatz’ and Newman’s
categorization schemes have been designed for math-
ematics education. They are therefore appropriate in-
fluences for the work reported about in this article, the
application area of which is computer science.
Learning Analytics have been defined as “the
measurement, collection, analysis and reporting of
data about learners and their contexts, for purposes
of understanding and optimizing learning and the
environments in which it occurs” (Siemens, 2010).
One application of Learning Analtics is predicting
dropout, which is often mentioned in the literature on
distance education and MOOCs (Massive Open On-
line Courses) (Cambruzzi et al., 2015; Onah et al.,
2014; Ye and Biswas, 2014; Kizilcec et al., 2013)
where dropout is usually defined as discontinued par-
ticipation (Lykourentzou et al., 2009) or in terms of
periods of inactivity (Halawa et al., 2014; Tan and
Shao, 2015). The predictor discussed in this article
predicts “skipping” defined as “missing a learning ac-
tivity”, more precisely, missing a homework assign-
ment, which is related to dropout. Various types of
data have been used for predicting dropout: Among
others measures of engagement or satisfaction (De-
jaeger et al., 2012; Giesbers et al., 2013), demo-
graphic data, and performances (such as quiz perfor-
mances) (Lykourentzou et al., 2009). A large va-
riety of statistical methods have been used for pre-
dicting dropout: Among others Support Vector Ma-
chines (Lykourentzou et al., 2009), Neural Networks
(Lykourentzou et al., 2009; Guo, 2010; Cambruzzi
et al., 2015), Decision Trees and Bayesian Classifiers
(Dekker et al., 2009).
One predictor related to those used for the eval-
uation reported about in this article is presented
by Kizilcec et al.: For predicting the dropout of
a MOOC’s audience, the participants’ assessments
were automatically labelled as “Auditing”, “Behind”,
“On Track”, or “Out”. “Behind” for example refers
to learning actions performed behind schedule. The
predictor was based on an analysis of these labels’
trajectories (Kizilcec et al., 2013).
A large variety of data have been used for predict-
ing examination performances, among others emo-
tional affects (Pardos et al., 2013), grades in previ-
ously attended courses and demographic data (Gu-
ruler et al., 2010; Cripps, 1996), and engagement
measures (Abdous et al., 2012; Cripps, 1996). The
methods used for predicting examination perfor-
mances reach from Neural Networks (Oladokun et al.,
2008), to Decision Trees, (Guruler et al., 2010) to Re-
gression Analysis (Abdous et al., 2012). By compar-
ing various data sources, Tempelaar et al. found that
computer-assisted assessments such as quiz perfor-
mances are the most effective in predicting examina-
tion performances. (Tempelaar et al., 2015) Merceron
and Yacef found that the use of supplementary learn-
Nudging by Predicting: A Case Study
237

ing materials impacts on final grades (Merceron and
Yacef, 2008). Recently, Jovanovi
´
c et al. used cluster
analysis to identify patterns of platform use related
to self-regulation and examination performance (Jo-
vanovi
´
c et al., 2017).
Some learning management systems provide feed-
back through “learning analytics dashboards”. Such
dashboards are typically only provided to teach-
ers and display descriptive statistics (Verbert et al.,
2013). Students can benefit from such dashboards
too: Showing learners their own learner model has
been shown to improve self-assessments (Kerly et al.,
2008) and motivation (Corrin and de Barba, 2014).
Park et al. found that such dashboards have no sig-
nificant impact on examination performances but that
students reported that the dashboard positively im-
pacted on their learning behavior (Park and Jo, 2015).
Cambruzzi et al. let teachers contact (typically via
email) students matching a “dropout profile” which
resulted in significant decreases of the dropout rate
(Cambruzzi et al., 2015). This result is comparable
to that reported about in (Onah et al., 2014): Students
learning with an experimental MOOC who had more
teacher contacts exhibited a higher retention than stu-
dents with fewer teacher contacts. Another interesting
observation is reported in (Arnold and Pistilli, 2012):
A significantly higher retention and a higher percent-
age in good grades was achieved through emails in-
forming students of their current performance predic-
tion. These email reports were often perceived as per-
sonal communication from the instructor which again
stresses the importance of personal contact.
3 EVALUATION METHOD
Course, Participants, and Course Organization.
The course in which the experiment was conducted,
an introduction to theoretical computer science, is
part of the computer science bachelor curriculum.
The course is offered every year. It lasted 14 weeks
from April to July 2018 and was attended by 433
students of whom 113 were female and 315 male.
The teaching staff consisted of one professor who
held weekly presence lectures, and one research as-
sociate and five student tutors who held weekly tutor-
ing lessons where homework assignments were dis-
cussed. The final examination took place immediately
after the course had ended. 11 voluntary homework
assignments were given at each of the weeks 2 to 12.
Each homework consisted of 3 to 4 exercises which
had to be delivered one week after their assignment.
During the course, written feedback was provided for
all submitted homework assignments by the research
assistant and the student tutors. Submissions of a suf-
ficient quality (especially including no plagiarisms)
were rewarded with a bonus for the final examination
amounting to up to 10% of the examination mark.
Predictions and their Presentation. An online
learning platform was used through which students
could access the course learning material and home-
work assignments, deliver their homework, receive
feedback on their homework, form learning groups,
and ask questions on the lectures and on the home-
work assignments which were answered by the teach-
ing staff and/or by fellow students.
This platform also provides a course schedule and
each student with personal analytics (accessed from
an “analytics” tab next to an “homework assignment
tab” on a “course navigation bar”). A student’s per-
sonal analytics consisted of three numerical indica-
tors: “Project Assessment”, a summary of the home-
work performances in this course so far; “Skipping
Prediction” a prediction presented in Figure 1, and
“Examination Fitness Prediction” presented in Figure
2. Personal predictions were updated every week.
Data Collection and Datasets. The basis for the
predictions were sequences of categorized home-
work submissions after the following categorization
scheme introduced in (Heller and Bry, 2018):
• SKIP, for skipped, when a homework assignment
is not delivered.
• IK, for insufficient knowledge, reflected by an in-
correct use of symbols, statements like “I don’t
know how to solve this”, or an answer not fitting
the question, requiring the student to re-learn parts
of the course.
• OE, for other errors, that is, errors not due to in-
sufficient knowledge.
• NE, for no errors, otherwise.
Four datasets were evaluated for this article. Each
dataset consisted of a sequence of homework submis-
sions categorized after the aforementioned scheme for
each student. The datasets were gathered from venues
of the same course on theoretical computer science in
the years 2015, 2016, 2017 and 2018.
The datasets gathered in 2015, 2016, and 2017
are referred to as reference datasets. They were
gathered from course venues run as described above
(with presence lectures and presence tutorials, and the
same system of bonus points), yet without prediction-
based nudging for the students. Homework deliv-
ery and correction took place for these course venues
on an online learning platform that did not support
CSEDU 2019 - 11th International Conference on Computer Supported Education
238
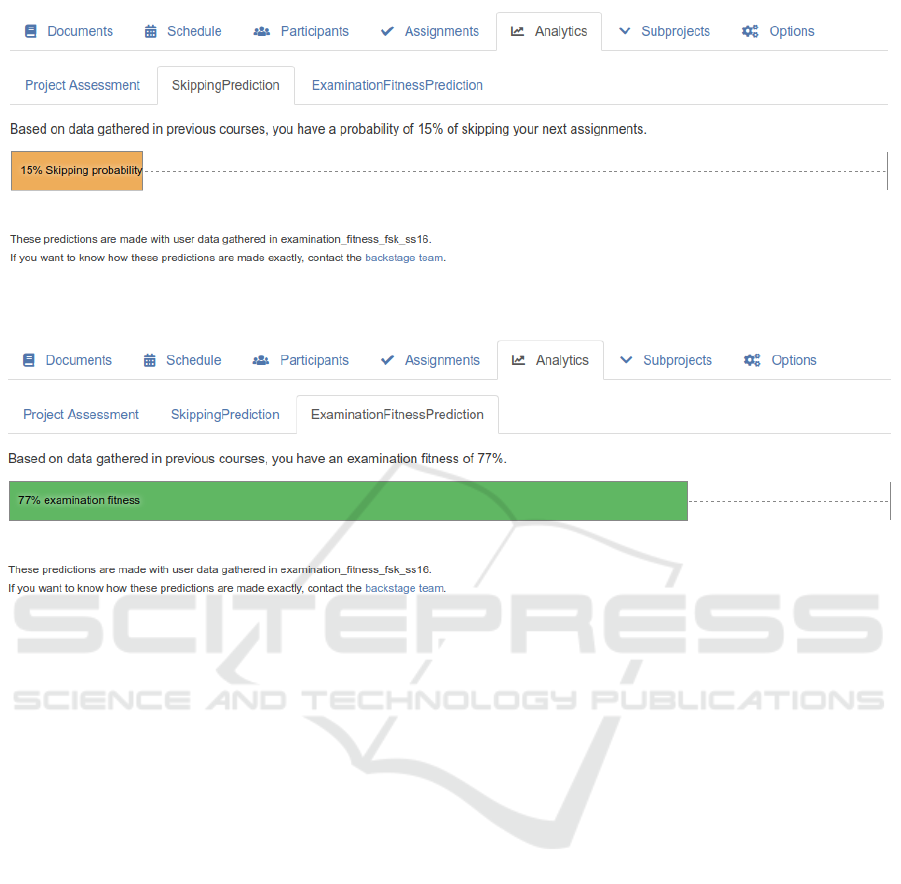
Figure 1: Student view of a personal skipping prediction.
Figure 2: Student view of a personal examination fitness prediction.
discussion of material. The categorization of home-
work submissions for these reference datasets was
performed by the research team after the end of the
course.
The dataset obtained in 2018 is referred to as
nudged-students dataset. For this course venue, the
above-mentioned learning platform provided every
student with individual predictions on skipping be-
haviour and examination performances introduced in
(Heller and Bry, 2018). The homework submissions
were categorized by the research assistant and the stu-
dent tutors during the course using the online learning
platform which had been tuned to the task: Using it,
the teachers could categorize the homework submis-
sions in a process similar to the grading of an exami-
nation. The categorization aimed not only at provid-
ing the data needed for building the predictors but also
to provide the students with feedback: When catego-
rizing a submission as “IK” (for insufficient knowl-
edge), for instance, a document was attached to the
submissions which listed course material to re-learn.
A submission neither categorized as “IK” or “NE”
(for no errors) was categorized by default as “OE” (for
other errors).
During the course, usage data (such as login
times) were recorded.
For the evaluation reported about in this article,
only the data from students that delivered at least one
assignment was considered. The reference datasets
describe the behaviour of 272 students in 2015, 344
students in 2016 and 383 students in 2017. The
nudged-students dataset describes the behaviour of
338 students. After the course’s end, a survey was
conducted to assess the students’ attitude towards re-
ceiving personalized skipping and examination per-
formance predictions.
Predictors. Skipping and examination performance
predictions as described in (Heller and Bry, 2018)
were used to nudge students to further attend classes
and to further deliver homework, that is, not to skip. If
the nudging had a positive influence on the students’
skipping behaviour then the predictors would perform
worse on the nudged-students dataset than on the ref-
erence datasets. Indeed, the purpose of nudging stu-
dents with predictions of their skipping and exami-
nation performances is to incite them to disprove the
predictions.
The predictors were trained with the reference
datasets and applied to the nudged-students dataset.
Specificity and sensitivity were retained as estimates
of the predictors’ performances. The predictors’ per-
Nudging by Predicting: A Case Study
239
formance on the reference datasets was assessed with
a 10-fold cross validation (Heller and Bry, 2018).
Resuming participation after a student had
skipped assignments was of special interest. This be-
haviour was analysed for each student by considering
pairs of homework submissions according to the fol-
lowing scheme:
• S-S: number of times a skipped assignment fol-
lowed a skipped assignment
• S-D: number of times an assignment was deliv-
ered when the previous assignment was skipped
• D-S: number of times an assignment was skipped
when the previous assignment was delivered
• D-D number of times an delivered assignment fol-
lowed an delivered assignment
The averages of these four values were computed for
all datasets.
4 EVALUATION RESULTS
This sections reports on the results of the evaluation.
Indications for behavioural changes are first examined
by comparing the behavioural data from the nudged-
students dataset to the reference datasets. The stu-
dents’ attitudes towards the nudging are then exam-
ined using survey data.
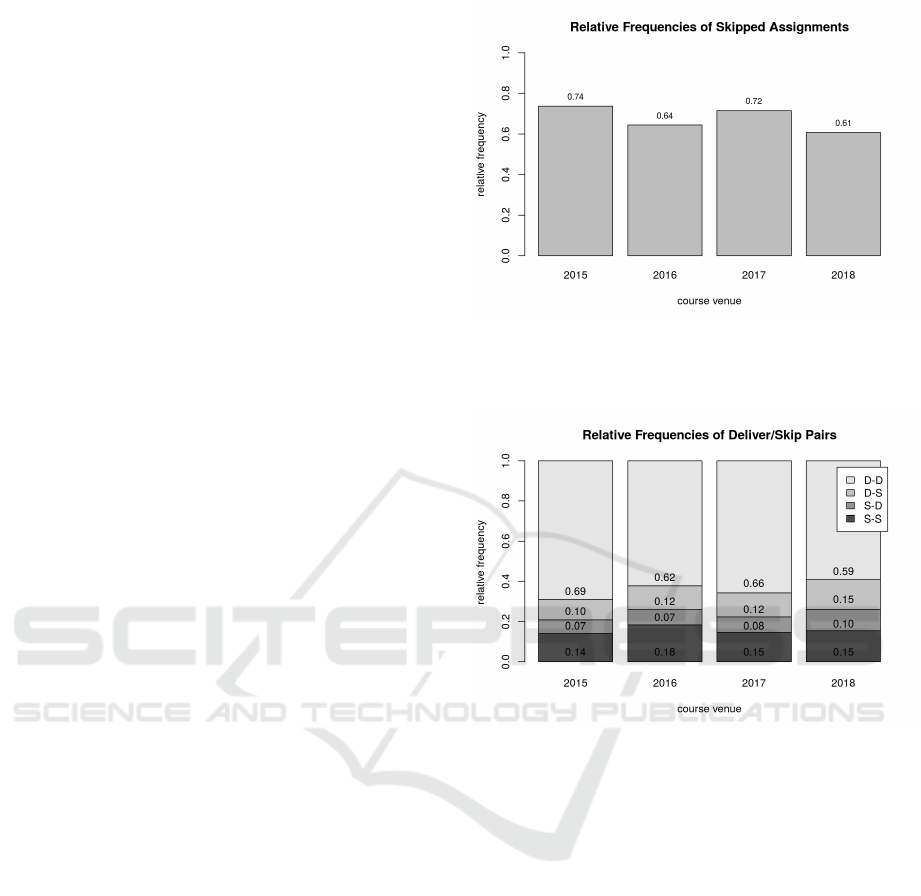
Indications of Changes of Behaviour. Figure 3
shows the relative frequencies of all skipped home-
works for the three reference datasets (2015, 2016 and
2017) and the nudged-students dataset (2018). The
frequency of skipped assignments is the lowest in the
nudged-students dataset.
Fisher’s Exact Test was applied to test the signif-
icance of the differences in skip rates in the nudged-
students dataset on the one hand, an in the reference
datasets on the other hand. Significant differences
(p < 0.01) were found when comparing the nudged-
students dataset with the reference datasets of 2015
and 2017, but not when comparing it with the refer-
ence dataset of 2016. While only two of the three
reference datasets showed significant differences to
the nudged-students dataset, this suggests that the
nudging investigated in this article contributes to re-
duce the skipping behaviour of students. Indeed, the
nudged-students dataset exhibits the lowest skipping
rates of all four examined datasets.
Figure 4 shows the relative frequencies of pairs
of behaviours S-S, S-D, D-S and D-D. The pairs re-
flecting behaviour changes, that is D-S and S-D, are
slightly more frequent in the nudged-students dataset
Figure 3: Relative frequencies of skipped homeworks in the
reference datasets (2015, 2016 and 2017) and in the nudged-
students dataset (2018).
Figure 4: Relative frequencies of Pairs deliver/skip behav-
ior for reference datasets (2015, 2016 and 2017) and the
nudged-students dataset (2018).
than in the reference datasets. This rise in behaviour
changes seems to come at the expense of a stable de-
livering behaviour, that is, D-D but not at the expense
of a stable skipping behaviour, that is, S-S which is
comparable in all datasets.
One indication that the students’ nudging achieves
its goal is that the skipping predictor performs worse
on the nudged-students dataset than on the reference
datasets. While there may be other factors reduc-
ing the predictors’ quality (which are discussed in
the next section), the nudging works well if students
change their behaviours, thus making the predictions
false. The skipping predictor exhibits a slightly worse
sensitivity on the nudged-students dataset than on the
reference datasets. The specificity is comparable in
both cases, as seen in Table 1.
System Usage. Throughout the course, the students
looked at their personal predictions as Figure 5 shows.
CSEDU 2019 - 11th International Conference on Computer Supported Education
240
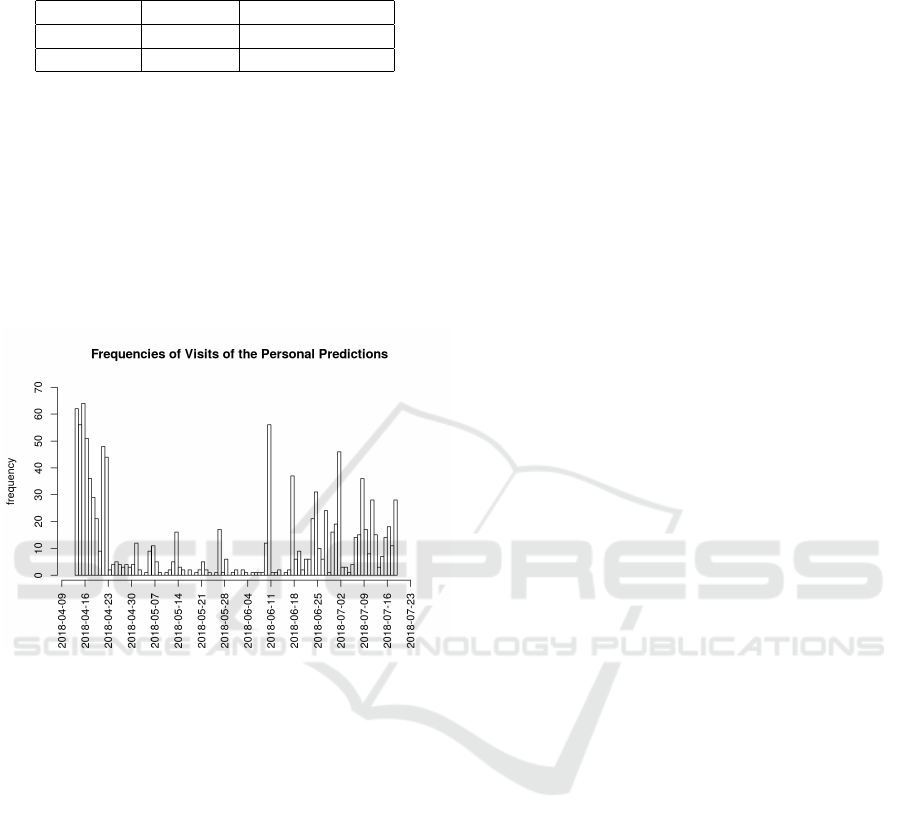
Table 1: Comparison of the skipping predictor for the refer-
ence datasets and the nudged-students dataset.
reference nudged-students
sensitivity 72.9% 67.2%
specificity 84.7% 85.2%
There is a notable peak at the start of the course, pos-
sibly caused by the novelty of the system, and a slow
rise towards the end of the course, possibly caused
by the students being concerned of their expected ex-
amination performances. In average, the students re-
trieved their personal predictions about once a week
(median interval in days: 6.9, first quartile 2.7, third
quartile 12.4) which corresponds to the frequency
with which the predictions did change.
Figure 5: Number of visits of the personal analytics page
per day.
Student Attitude. 65 students participated in the fi-
nal survey. The students were asked to answer the fol-
lowing 5 questions for each of skipping prediction and
examination performance prediction on a 6 point Lik-
ert scale ranging from “not at all” (1) to “absolutely”
(6):
The displayed predictions ...
• ... motivated me to learn more.
• ... was interesting for me.
• ... discouraged me.
• ... was helpful.
• ... motivated me to hand in the next assignments.
Table 2 summarizes the results of the survey. The
students did not find any of the predictions discour-
aging, nor did they report to have been motivated to
a higher participation to do homework. The exam-
ination fitness prediction was perceived as more in-
teresting than the skipping prediction, which is con-
sistent with findings by Schumacher and Ifenthaler
who found that self-assessments are among the most
liked features of learning analytics systems by stu-
dents(Schumacher and Ifenthaler, 2018).
5 DISCUSSION
The results indicate certain behaviour changes. In the
case study, students skipped less assignments than in
the previous course venues during which no nudg-
ing took place. Also, the students varied more fre-
quently between skipping and delivering homework
than in the previous course venues without nudging:
There were more students that resumed work after
having skipped one assignment and less students that
stuck to work after having submitted an assignment.
This might indicate that the students felt empowered
to “take their learning in their own hands”; “should
I do my homework” seemed to be a question to be
answered on a weekly basis instead of once and for
all. This suggests a form of learners’ empowerment or
better learners’ self-regulation which should be seen
as a positive result.
The students expressed a relatively neutral atti-
tude towards the predictions they were shown, call-
ing them neither motivating nor discouraging, of lim-
ited helpfulness and more interesting than helpful.
Yet the results show a positive impact on the learn-
ing behaviour and the students also consulted their
personal predictions regularly what indicates interest,
with a clear peak in consultation towards the end of
the course. This might be explained by the approach-
ing final examination.
The results reported about in this article suffer
from some limitations. First, the survey was com-
pleted by only 64 students which might not be rep-
resentative of the 344 students of the nudged-students
dataset. The limited coverage of survey might espe-
cially affect the results on motivation and discourage-
ment: If some students felt discouraged by their pre-
dictions (or other aspects of the online learning plat-
form or of the course itself), they might also have been
discouraged to participate in the survey. Also, the sur-
vey did not include questions on the possible reasons
of skipping assignments, which could have brought
further insight on the students’ motivations.
Second, the experiment was conducted in an “ev-
eryday” educational setting by comparing data that
was gathered in different course venues, yielding dif-
ferent conditions under which the datasets were gath-
ered: Some of the teaching staff (especially the stu-
dent tutors) changed over the years which might have
resulted in different kinds of homework reviews, and
while the topics and the amount of exercises remained
Nudging by Predicting: A Case Study
241
Table 2: Student’ responses for the examination fitness and skipping predictor.
examination fitness skipping
1st Quartile Median 3rd Quartile 1st Quartile Median 3rd Quartile
motivation 1 1.5 2 1 1.5 2
interest 3 4 5 2.5 3 3.5
discourage 1 1.5 2 1 2 2.5
helpful 2 3 4 2.5 3 4
more 1 1.5 2 1.5 2 2.5
fairly similar, the exercises were reworked, improved,
and in some cases even changed from course venue
to course venue. Furthermore this study design does
not allow to compare examination results between
nudged and not nudged students, which would allow
to draw further conclusions on the effectiveness of the
intervention, because examinations differ from year
to year and are not standardized.
Note that while the study design presented in
this article which consists of evaluating and compar-
ing different course venues has its flaws, alternatives
are often simply incompatible with real-life teaching:
Students randomly assigned to control and treatment
groups, which would be necessary for an A/B test
for instance, could not be expected to stay isolated
from each other for the duration of a whole course,
which would be necessary to reasonably conduct such
a study.
6 CONCLUSION AND
PERSPECTIVES FOR FUTURE
WORK
The evaluation reported about in this article has
shown that the perceived usefulness, and the im-
pact on the learners’ behaviour of confronting them
with personal predictions on their homework skipping
and on their examination performances could be im-
proved. Four improvements of the approach appear
possible and desirable:
1. While every student could see her current predic-
tions, changes in these predictions were not dis-
played. Two successive predictions often varied
in only a few percentage points, possibly too few
to be easily noticed.
2. The current predictions were provided on de-
mand: The students had to actively visit their ana-
lytics page. The system regularly sends reports on
recent user actions (such as new assignments or
posted questions), but the learning analytics were
not included in these reports. Regular reports on
newly published or newly updated learning ana-
lytics could be send.
3. The learning analytics delivered to one student
could include aggregated learning analytics refer-
ring to the student’s peers like prediction aver-
ages. Though, such informations could be either
encouraging or discouraging, depending on the
students (Onji, 2009).
This article has reported on an experiment relying
on individual predictions of homework skipping and
examination performances for nudging students to a
better learning. The evaluation results point to the ef-
fectiveness of the approach: Nudged students skipped
assignments slightly less than non-nudged students.
Further work on the origin of homework skipping
and how to combat it in large lectures is therefore
needed. The evaluation revealed the students’ interest
in the nudging with individual predictions of home-
work skipping and examination performances, and in-
dications of an increased learner empowerment were
found. Limitations of the approach have been dis-
cussed.
ACKNOWLEDGEMENTS
The authors are thankful to the student tutors Elisa-
beth Lempa, Yize Sun, David Tellenbach and Jakob
Knauer for their contribution to labelling, and to the
students Andreas Born and Steven Dostert for their
contribution to the software.
REFERENCES
Abdous, M., Wu, H., and Yen, C.-J. (2012). Using data min-
ing for predicting relationships between online ques-
tion theme and final grade. Journal of Educational
Technology & Society, 15(3):77.
Arnold, K. E. and Pistilli, M. D. (2012). Course signals at
purdue: Using learning analytics to increase student
success. In Proceedings of the 2nd international con-
ference on learning analytics and knowledge, pages
267–270. ACM.
Cambruzzi, W. L., Rigo, S. J., and Barbosa, J. L. (2015).
Dropout prediction and reduction in distance educa-
CSEDU 2019 - 11th International Conference on Computer Supported Education
242

tion courses with the learning analytics multitrail ap-
proach. J. UCS, 21(1):23–47.
Clements, M. K. (1980). Analyzing children’s errors on
written mathematical tasks. Educational studies in
mathematics, 11(1):1–21.
Cooper, H. (1989). Synthesis of research on homework.
Educational leadership, 47(3):85–91.
Corrin, L. and de Barba, P. (2014). Exploring students’
interpretation of feedback delivered through learning
analytics dashboards. In Proceedings of the ascilite
2014 conference, pages 629–633.
Cripps, A. (1996). Using artificial neural nets to predict
academic performance. In Proceedings of the 1996
ACM Symposium on Applied Computing, pages 33–
37. ACM.
Dejaeger, K., Goethals, F., Giangreco, A., Mola, L., and
Baesens, B. (2012). Gaining insight into student
satisfaction using comprehensible data mining tech-
niques. European Journal of Operational Research,
218(2):548–562.
Dekker, G., Pechenizkiy, M., and Vleeshouwers, J. (2009).
Predicting students drop out: A case study. In Educa-
tional Data Mining 2009.
Giesbers, B., Rienties, B., Tempelaar, D., and Gijselaers,
W. (2013). Investigating the relations between motiva-
tion, tool use, participation, and performance in an e-
learning course using web-videoconferencing. Com-
puters in Human Behavior, 29(1):285–292.
Guo, W. W. (2010). Incorporating statistical and neural net-
work approaches for student course satisfaction anal-
ysis and prediction. Expert Systems with Applications,
37(4):3358–3365.
Guruler, H., Istanbullu, A., and Karahasan, M. (2010).
A new student performance analysing system using
knowledge discovery in higher educational databases.
Computers & Education, 55(1):247–254.
Halawa, S., Greene, D., and Mitchell, J. (2014). Dropout
prediction in MOOCs using learner activity features.
eLearning Papers, 37.
Hattie, J. (2015). The applicability of visible learning to
higher education. Scholarship of Teaching and Learn-
ing in Psychology, 1(1):79.
Hattie, J. and Timperley, H. (2007). The power of feedback.
Review of educational research, 77(1):81–112.
Heller, N. and Bry, F. (20-22 June 2018). Predicting learn-
ers’ behaviours to get it wrong. In Methodologies and
Intelligent Systems for Technology Enhanced Learn-
ing, 8th International Conference, Advances in Intelli-
gent Systems and Computing, pages 12–19. Springer.
Jovanovi
´
c, J., Ga
ˇ
sevi
´
c, D., Dawson, S., Pardo, A., and Mir-
riahi, N. (2017). Learning analytics to unveil learn-
ing strategies in a flipped classroom. The Internet and
Higher Education, 33(4):74–85.
Kerly, A., Ellis, R., and Bull, S. (2008). Calmsystem: a con-
versational agent for learner modelling. In Applica-
tions and Innovations in Intelligent Systems XV, pages
89–102. Springer.
Kizilcec, R. F., Piech, C., and Schneider, E. (2013). Decon-
structing disengagement: analyzing learner subpopu-
lations in massive open online courses. In Proceed-
ings of the third international conference on learning
analytics and knowledge, pages 170–179. ACM.
Lykourentzou, I., Giannoukos, I., Nikolopoulos, V., Mpar-
dis, G., and Loumos, V. (2009). Dropout prediction
in e-learning courses through the combination of ma-
chine learning techniques. Computers and Education,
53(3):950–965.
Merceron, A. and Yacef, K. (2008). Interestingness mea-
sures for association rules in educational data. In Ed-
ucational Data Mining 2008.
Oladokun, V., Adebanjo, A., and Charles-Owaba, O.
(2008). Predicting students’ academic performance
using artificial neural network: A case study of an en-
gineering course. The Pacific Journal of Science and
Technology, 9(1):72–79.
Onah, D. F., Sinclair, J., and Boyatt, R. (2014). Dropout
rates of massive open online courses: behavioural pat-
terns. EDULEARN14 proceedings, pages 5825–5834.
Onji, K. (2009). Procrastination, prompts, and prefer-
ences. Journal of Behavioral Economics and Finance,
2:111–113.
Pardos, Z. A., Baker, R. S., San Pedro, M. O., Gowda,
S. M., and Gowda, S. M. (2013). Affective states
and state tests: Investigating how affect throughout the
school year predicts end of year learning outcomes. In
Proceedings of the Third International Conference on
Learning Analytics and Knowledge, pages 117–124.
ACM.
Park, Y. and Jo, I.-H. (2015). Development of the learn-
ing analytics dashboard to support students’ learning
performance. J. UCS, 21(1):110–133.
Radatz, H. (1979). Error analysis in mathematics educa-
tion. Journal for Research in Mathematics Education,
pages 163–172.
Schumacher, C. and Ifenthaler, D. (2018). Features students
really expect from learning analytics. Computers in
human behavior, 78:397–407.
Siemens, G., editor (2010). 1st international conference on
learning analytics and knowledge 2011.
Tan, M. and Shao, P. (2015). Prediction of student dropout
in e-learning program through the use of machine
learning method. iJet, 10(1):11–17.
Tempelaar, D. T., Rienties, B., and Giesbers, B. (2015).
In search for the most informative data for feedback
generation: Learning analytics in a data-rich context.
Computers in Human Behavior, 47:157–167.
Trautwein, U. and K
¨
oller, O. (2003). The relationship be-
tween homework and achievement—still much of a
mystery. Educational psychology review, 15(2):115–
145.
Verbert, K., Duval, E., Klerkx, J., Govaerts, S., and Santos,
J. L. (2013). Learning analytics dashboard applica-
tions. American Behavioral Scientist, 57(10):1500–
1509.
Ye, C. and Biswas, G. (2014). Early prediction of student
dropout and performance in moocs using higher gran-
ularity temporal information. Journal of Learning An-
alytics, 1(3):169–172.
Zimmerman, B. J. and Kitsantas, A. (2005). Homework
practices and academic achievement: The mediat-
ing role of self-efficacy and perceived responsibil-
ity beliefs. Contemporary Educational Psychology,
30(4):397–417.
Nudging by Predicting: A Case Study
243
