
Energy Consumption Characterization based on a Self-analysis Tool:
A Case Study in Yarn Manufacturing
Samuele Branchetti, Carlo Petrovich, Gessica Ciaccio, Piero De Sabbata,
Angelo Frascella and Giuseppe Nigliaccio
ENEA – National Agency for New Technologies, Energy and Sustainable Economic Development,
Via Martiri di Monte Sole 4, Bologna, Italy
Keywords: Benchmarking, Energy Consumption, Energy Efficiency, Sustainable Economy, Textile Industry, Yarn
Manufacture.
Abstract: Even if energy efficiency represents a crucial issue for the sustainability of the manufacturing industry, the
companies need to be encouraged in investing their resources for this goal. One of the means to facilitate
this effort is the comparison of the energy performances with similar factories. Nevertheless, since the
enterprises are very heterogeneous, these performance values have, even within a specified manufacturing
sector, a high variability and therefore risk not to be representative. The dispersion of these data has to be
decisively decreased. This goal is pursued here by means of an energy consumption characterization model
based on: 1. a self-analysis software tool collecting energy consumption data in a simple and homogeneous
way; 2. the clustering of the factories; 3. the separation of the auxiliary energy uses from the production
process energy consumption. The method is here applied to textile industry with a focus on the electrical
consumption in yarn factories. The outcomes show a correlation with some production variables, such as the
raw materials, and allow to reduce the relative errors of the energy performances of different factories from
about 80% to about 25-40%. In this way, energy reference indicators can be built in an acceptable and
representative way.
1 INTRODUCTION
Energy efficiency has become a crucial issue for
the manufacturing industry because of the need of
reducing greenhouse and pollutant emissions, of
optimizing fuel resources and of increasing
economic market competitiveness.
In this paper the textile industry, and in
particular the yarn manufacturing, is chosen as a
case study for an energy consumption
characterization, and the approach which will be
outlined here can be applied also to other
manufacturing sectors.
In 2015 textile industry in Europe counted
61,000 companies and produced a turnover of
around 79,000 million € with an energy cost of
about 1,900 million €. The energy cost contribution
was higher than the average energy contribution
cost of manufacturing sector (EUROSTAT, 2015).
For yarn manufacturing the incidence of the
energy costs can vary a lot, depending on many
variables, such as the kind of raw materials, the
involved processes and labor costs. According to
different countries and for 20 tex carded open-end
rotor cotton yarn, the share in energy cost
represents the 5-18% of the total mill costs
(Kaplan, 2010; Alkaya, 2014) and 10-25% for ring
and rotor spinning (ITMF, 2014).
In 2016, China, European Union, India and the
U.S. were the four largest textile importers and
exporters in the world. The EU textile sector
represented 23% of the world textile exports
(WTO, 2017). In China and in the U.S., the
contribution of the textile industry sector to the
national final energy use in manufacturing is
respectively of the 4% and of the 2% (Hasanbeigi,
2012a). Even if the textile industry is not a very
high energy-intensive industry, it involves a large
number of plants, consuming together a significant
amount of energy.
The purpose of improving energy efficiency in
textile industry is a common declared
governmental strategy for many regions, such as
40
Branchetti, S., Petrovich, C., Ciaccio, G., De Sabbata, P., Frascella, A. and Nigliaccio, G.
Energy Consumption Characterization based on a Self-analysis Tool: A Case Study in Yarn Manufacturing.
DOI: 10.5220/0007680300400050
In Proceedings of the 8th International Conference on Smart Cities and Green ICT Systems (SMARTGREENS 2019), pages 40-50
ISBN: 978-989-758-373-5
Copyright
c
2019 by SCITEPRESS – Science and Technology Publications, Lda. All rights reserved

Europe (Scheffer, 2015), Turkey (Alkaya, 2014)
and Taiwan (Hong, 2010). The Best available
techniques REFerence document (BREFs),
prepared by the European IPPC Bureau, describes
how to implement the best available techniques to
use natural resources in an efficient way and to
minimize pollution emissions (IPPC, 2003).
Notwithstanding these government goals and
the fact that the payback time is often less than few
years, the companies, especially SMEs, are not
usually prone to invest time and relevant resources
to face a comprehensive energy consumption
assessment and to implement the adequate
measures.
A dissemination campaign of the several energy
saving opportunities can help to overcome the
limited information and to make aware of the
possible benefits of these measures. Another way
to promote and facilitate investments in energy
efficiency measures is to provide some reference
performance indicators for the energy
consumptions of the production processes. This
would represent a fast way, even if of preliminary
nature, for the factory to understand whether its
energy consumptions are efficient or not.
Comparisons and benchmarks for the energy
consumption of a plant can be based on the past
performance of the same plant or on other plants’
performance (or average performance) of the same
plant group or more general plant groups. Another
possibility is the comparison with the performance
of “best practice” plants of the same group or
performance of “best technologies” in the industry
(Hasanbeigi, 2012b). Unfortunately, even factories
of the same group are heterogeneous and differ
greatly from each other because of different
processes involved, different machine setting and
kinds of products and different machines and
components (Hasanbeigi, 2012a). Even within the
same textile sub-sectors, such as yarn
manufacturing, fabric manufacturing and finishing,
a similar fragmentation occurs.
Moreover, the main available references (e.g.
data from EUROSTAT (2015)) are few and too
general to be meaningful for all the different kind
of companies of the textile sector. In literature
benchmarking, no homogeneous description of the
plant characteristics and of the implemented
processes exists (because of confidentiality issues,
besides being a time-consuming activity).
Therefore the problem of energy performance
comparison, of energy and economical
characterization is still unsolved because of the
great variability of the production processes.
On the other hand, more accurate estimations of
the energy consumption of a textile mill can be
provided using more precise equations but referring
only to very specific production phases, machines
and setting parameters, such as yarn counts and
twists. This approach is followed for example by
Koç (2007), but it needs a huge amount of time and
detailed data, such as the yarn properties, the power
and number of the machines, the load factors, the
efficiencies and the number and type of processes.
This paper proposes an energy consumption
characterization model which allows, by means of
self-analyses, to obtain approximate reference
values for the comparison. The data for the
construction of the model were collected through a
set of software tools, named SET Tool, developed
within three European projects (ARTISAN, SESEC
and SET), which were focused on the Textile and
Clothing sector (Branchetti, 2016). Furthermore, an
European informative campaign, named Energy
Made to Measure (EM2M) (EM2M, 2016), led by
the European industry association (EURATEX),
has allowed, by means of these software tools, to
retrieve many information data from the factories
and thus to build a quite large database.
The collected data have been clustered
according to the kind of production and the used
raw materials. Then, the data have been elaborated
using regression analysis methodologies and
indicators, such as the Specific Energy
Consumption (SEC), which represents the total
energy consumption of the whole mill for unit of
product (kWh/kg). Here we refer to the “electrical
SEC” and “thermal SEC” when representing
electrical and thermal energy consumption
respectively. The present paper focuses on part of
the textile production chain, in particular on the
whole yarn manufacturing processes.
The main goals of this paper are:
to make available to the public literature some
energy consumption indicators of the textile
industry, as collected by the SET tools,
respecting industrial data confidentiality;
to decrease the range of variability of the SEC
for yarn production mills, without taking into
account production details; in this way a
textile factory can more easily compare its
energy consumption with reference values;
to validate a general approach to compare
energy performances in manufacturing
industry avoiding detailed, time-consuming
and demanding measurement campaigns.
Energy Consumption Characterization based on a Self-analysis Tool: A Case Study in Yarn Manufacturing
41

In section 2, energy consumption in yarn
manufacturing is discussed, together with a
literature review of this issue and of the SEC
values. In section 3, the SET Tool and its database
are presented along with the used indicators. After
examining the relationship between energy and
production, the main results are presented in
section 4 and discussed in section 5.
2 ENERGY CONSUMPTION IN
YARN MANUFACTURING
The textile industry is a complex manufacturing
industry because it represents a fragmented and
heterogeneous sector, dominated by Small and
Medium Enterprises (SMEs) (Hasanbeigi, 2012a).
The textile production process is composed of
many and different production phases and sub-
phases, hierarchically identifiable. Starting from
the NACE rev. 2 classification, three main kinds of
production can be highlighted:
yarn production;
fabric production;
finishing (of yarn and fabric).
Even if yarn production is made up of various
processes, which can be in sequence or alternative,
it is possible to define some main production
phases, as depicted in Figure 1: opening and
preparation of the raw materials (such as cotton and
wool), carding, combing, drawing, spinning,
winding, rowing, steaming, etc. The dyeing and
other finishing processes are not included here in
the “yarn production” category. A factory can
implement many of these phases or only just one.
Moreover, it is possible that these phases occur at
different facilities of the same company.
In yarn production most of the energy
consumption is due to spinning processes. In case
of middle count, carded, ring yarn, the spinning
and winding processes represent about 55-80% of
the energy consumption per kg of single yarn (Koç,
2007). The spinning systems can be classified
according to different technologies into ring
spinning, compact spinning, rotor spinning, air-jet
spinning and other spinning machines, which are
characterized by different energy consumption
behaviour. On the other hand, the scientific
literature on the energy consumption is not
systematic, often outdated and not well
documented (Van der Velden, 2014).
Comprehensive studies for a specific textile
mill, facing energy consumptions, water
consumptions, waste and pollutant generations are
reported in Ozturk (2015). Potential energy
reduction applying the Best Available
Technologies list (BAT) are evaluated there as
about 10-30%, with a total potential reduction up to
70% with a payback period up to 4 years (by means
of energy monitoring and control, insulations, heat
recovery, substitution of electric motors) (IPPC,
2003).
In Hasanbeigi (2012b), the energy consumption
of 13 textile plants in Iran have been analyzed and
audited, regarding 5 different sub-sectors
(spinning, weaving, wet-processing, worsted fabric
manufacturing and carpet manufacturing).
Therefore there are only 2 or 3 plants in this study
in each manufacturing sub-sector, for each of
which the energy intensity has been analyzed and
then a range of energy consumption has been
estimated. Hence, benchmark values for other mills
in the same sub-sector are attempted, even if the
indicators are deduced from a very limited number
of factories. Moreover, the highest share of energy
consumption in the textile industry worldwide turns
out to be due to spinning, weaving, and wet-
processing.
In Lin (2016) Chinese regional differences in
the total energy efficiency of the textile industries
are analyzed for the period 2000-2012. There, the
technology gap is taken as the most important
parameter to explain the disparity in energy
efficiency in eastern, central and western regions.
Considering the distance from the frontier
technology, a huge energy saving potential is
highlighted for the Chinese textile sector.
Other studies focused their investigations on the
whole life cycle of the textile industry using the
LCA (Life Cycle Assessment) approach
(Steinberger, 2009; Zamani, 2014; Van der Velden,
2014). In these studies the complete chain is taken
into account, from the cultivation up to the
production, textile use, dress washing and even
ironing. The approach is comprehensive, but, on
the other hand, only a rough estimation of the
production energy consumption is used and a
discussion of its high spread is missing.
SMARTGREENS 2019 - 8th International Conference on Smart Cities and Green ICT Systems
42

Figure 1: Typical yarn processes.
Table 1: Electrical and thermal energy consumption for yarn production mills according to the analyzed literature.
Description
Electrical
energy
consumption
[kWh/kg]
Thermal
energy
consumption
[MJ/kg]
Reference
Spinning (1972) 5.4 (Kim, 1983)
Spinning (1980) 4.9 (Kim, 1983)
Range for spinning mills 2.7 – 4 1.1 - 4.7 (Tarakçıoğlu, 1984)
Range for textile mills 0.5 - 7.5 11 - 65
(Kumar, 1999)
(UNIDO, 2010)
Range of spinning plants 0.55 - 7.3 0.14 - 0.73 (Visvanathan, 2000)
Ring yarn (combed)
20 tex
3.5 - 3.6 (ITMF, 2003)
1.8 - 5.1 (Dahllöf, 2004)
Cotton spinning (1997) 5.1 (Dahllöf, 2004)
- 11.6 (Ellebæk Larsen, 2007)
Spinning mill
(mix ring and open-end, cotton)
3.2 - 3.8 (Kaplan and Koç, 2010)
Open-end spinning mill (calculated,
20 tex)
3.0 (Kaplan , 2010)
Specific spinning plant 3.2 - 3.5 (Palamutcu, 2010)
Spinning plant 3.2 - 3.5 (EMS)
Ring spinning mills 6.6, 4.7 12.4, 7.1 (Hasanbeigi, 2012b)
Open-end Spinning mills
3.6 8.1
(Hasanbeigi, 2012b)
SimaPro 7.2 5.1 (Van der Velden, 2014)
SimaPro 7.2 3.4 (Van der Velden, 2014)
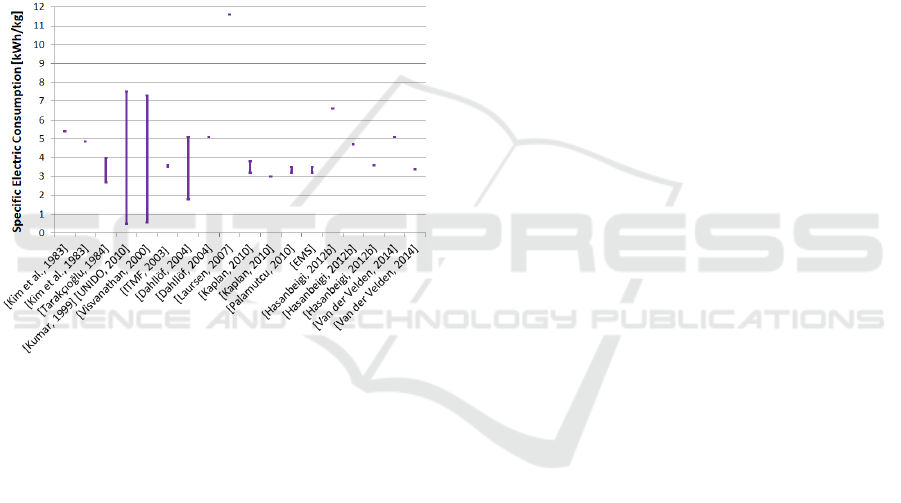
Table 1 reviews and summarizes the data found
in the abovementioned references and in other
literature. The data are presented in chronological
order and reported in Figure 2. The bars show the
ranges of values declared by the respective
references. Figure 2 confirms the wide distribution
of the data, but also a general consistency among
them. The ranges of the data is 0.5-11.6 kWh/kg and
the average turns out to be 4.5 kWh/kg. Reference
Van der Velden (2014) claims that the wide range of
the literature data is mainly due to the mixture of
data coming from very different textile product
characteristics, the most relevant of which is the
yarn count.
Anyhow, as abovementioned, the range of the
data is too high to be useful for benchmarking
purposes. As shown in Figure 2, SEC in yarn
manufacturing can vary by a factor of 20. Values of
SEC, as a matter of fact, depend on many factors
and choices, such as the raw materials characteristics
(Hasanbeigi, 2012b), type and number of processes
taken into account, type of spinning system, yarn
count (Van der Velden, 2014; Koç, 2007), yarn twist
(Hasanbeigi, 2012b), energy efficiency of the
machines and machine time utilization (the
workload), geographical location (Hasanbeigi,
2012b), production capacity (Palamutcu, 2010).
Moreover, the technology evolution has to be taken
into account as well, because it drives a decrease of
the SEC with time. This issue has been investigated
for Germany and Colombia from 1998 to 2005 in
Pardo Martínez (2010).
Even the detailed energy consumption analysis
for a specific mill is not easy. Direct measurements
in 5 plants in Palamutcu (2010) show discrepancies
between estimated and actual energy data of the
Energy Consumption Characterization based on a Self-analysis Tool: A Case Study in Yarn Manufacturing
43
order of 10-30% due to the variety of different
processes, the efficient use of the equipment,
processes steps, the discontinuity of machine use by
cause of maintenance periods.
From this description, it is clear that an unique
reference number representing the energy
consumption of the whole textile industry is poorly
representative for a specific mill, because the textile
factories have very different features. On the other
hand, this paper does not take into account all these
variables, because this would have required a deep
analysis of the machines and costs from the textile
plants. Rather, the approach proposed here is to
consider only few more significant variables, such as
the type of production process and the main raw
materials.
Figure 2: Range of specific electrical energy consumptions
(kWh/kg) for yarn mills from the analyzed literature
reported in Table 1.
3 METHODS
The proposed methodology is based on the so-called
SET Tool, that is a self-analysis standalone tool
which provides feedback on energy efficiency
measures and energy indices to the textile mills
interested in investigating this issue. Enterprises are
encouraged by the tool to provide information on:
the yearly and monthly production amount, the
electrical and thermal consumptions of the mill, the
number and the type of processes involved, the
turnover, the number of employees, the main used
raw materials, the product market segment and the
market segment application (clothing, home textile,
technical textile, etc.).
The SET Tool was designed together with a
web-based application, named SET Web, which is
able to retrieve and filter data, to check their
faithfulness and to calculate customized energy
benchmarks. Enterprises can access SET Web and
its services, obtaining performances comparison
with energy benchmarks, by anonymously sending
their data through the SET Tool. As a matter of fact,
all these data are provided by the textile factories
themselves and are automatically recorded and
organized to build up a centralized and growing SET
database. With respect to other benchmarking
methodologies (Andersson, 2018), the energy
benchmarks obtained by the SET Tool are built
dynamically through company self-profiling.
Therefore, the companies themselves contribute to
improve the quality of the benchmark.
3.1 The Factory Database
At the end of 2017, the factory database was
composed of 204 datasets, which were provided by
136 companies in relation to 140 factories. Pruning
the data referring to the same production but to
different years and those being inconsistent or not
complete, 123 datasets have been selected, regarding
4 main areas: yarn production, fabric production,
finishing processes and factories involving a
combination of these productions (yarn and finishing
of yarn, fabric and finishing of fabric or the overall
production processes). Table 2 shows characteristics
and consumption indices of the mills, which have
uploaded the data. The data mainly refer to the years
2014-2015.
From the SET datasets it is possible to provide a
quite general view of the energy consumption in
yarn production, fabric production and finishing in
Europe: the numbers of the textile factories which
have been collected with the SET Tool are about 25-
40 for every sector. Even if some outliers and
incomplete datasets have been excluded, the range
and the spread of the total energy consumption
values are still very high (0.09 – 16.5 kgoe/kg)
because different kinds of textile factories have been
collected.
3.2 Electrical and Thermal Energy
In textile industry, both electrical energy and
thermal energy are used. The former one is used
mainly for operating machines (e.g. spinning,
weaving and knitting) and facilities such as air
compressors, air conditioning and lathing, while the
latter one mainly for heating and production
SMARTGREENS 2019 - 8th International Conference on Smart Cities and Green ICT Systems
44

processes such as fixation of yarns, steam for
autoclaves and hot water for dyeing.
According to the different types of processes and
products, thermal energy or electrical energy can
prevail.
In UNIDO (2010) the electrical consumption
rate in the total consumed energy for individual
textile production stages are reported to be 93% for
spinning, 85% for weaving, 43% for wet processing
and 65% for clothing manufacturing. The rest of the
energy is provided as thermal energy by other
energy fuels (natural gas, coal, etc.). According to
three spinning plants analyzed in (Hasanbeigi,
2012b), 60-70% of the used energy is electricity (for
machinery, humidification systems, compressed air
systems and lighting). The spinning step accounts
for 56% of total energy use in the yarn
manufacturing process (Hong, 2010).
Table 2: Characteristics of the SET datasets with min. and max. values. Primary energy (*) is expressed by kilogram of oil
equivalent [kgoe] using a conversion factor of 0.000215 toe/kWhe (Table 4 of Commission decision 2007/589/CE and
Annex II of directive 2006/32/CE).
Yarn Fabric Finishing
Yarn+Finishing
Fabric+Finishing
Yarn+Fabric+Finishing
Factories 26 49 29 36
n. of mills
consistent and
complete
21 44 27 31
Date for reference
year
2013 - 2015 2013 - 2015 2012 - 2015 2013 - 2015
European
countries involved
BE, CZ, HU, IT, PT, RO
BE, BG, CZ, DE, HU,
PT, RO
CZ, DE, FR, HU, IT, PT
BE, DE, HR, HU, IT, CZ,
LT, PT, RO
Number of
employees
5 - 535 3 - 410 6 - 200 15 - 1000
Turnover
[Millions of €]
0.15 - 90 0.10 - 35 0.19 - 24 0.71 - 116
Product market
segment
From low target market
to luxury market
From low target market
to luxury market
From medium target
market to luxury market
From medium target
market to luxury market
Market segment
application
Clothing, Home textile,
Technical textile,
Protective textile
Clothing, Home textile,
Technical textile,
Underwear
Clothing, Home textile,
Technical textile,
Underwear, Protective
textile, Other
Clothing, Home textile,
Technical textile,
Underwear, Protective
textile
Main raw
materials used
Cotton, Wool, Acrylic,
Polyamide,
Polypropylene, Linen,
Other natural fibres
Cotton, Wool, Acrylic,
Polyester, Polyamide,
Polypropylene, Linen,
Other natural fibres
mainly Cotton, but also
Polypropylene, Polyester,
Polyamide, Silk, Wool and
Other synthetic fibres
Cotton, Wool, Polyester,
Polyamide, Acrylic,
Linen, Acetate, Other
natural fibres, Other
Electrical energy
consumption
[kWhe/kg]
0.44 – 14.55 0.49 – 25.14 0.49 – 32.98 1.11 – 17.87
Thermal energy
consumption
[kWhth/kg]
0.01 – 20.30 0.00 – 44.40 2.43 – 109.69 2.39 – 54.24
Total energy
consumption
[kgoe/kg]*
0.088 – 3.89 0.11 – 9.22 0.560 – 16.52 0.61 – 7.35
% Electrical
energy
from 52% up to 100%,
with average of 85%
from 15% up to 100%,
with average of 73%
from 13% up to 76%, with
average of 28%
from 21% up to 80%,
with average of 47%
% Thermal energy
from 0% up to 48%,
with average of 15%
from 0% up to 85%, with
average of 27%
from 24% up to 87%, with
average of 72%
from 20% up to 79%,
with average of 53%
Annual product
amount
[tonnes/year]
30 - 32781 5 - 1767 60 - 4800 55 - 15165
Energy Consumption Characterization based on a Self-analysis Tool: A Case Study in Yarn Manufacturing
45
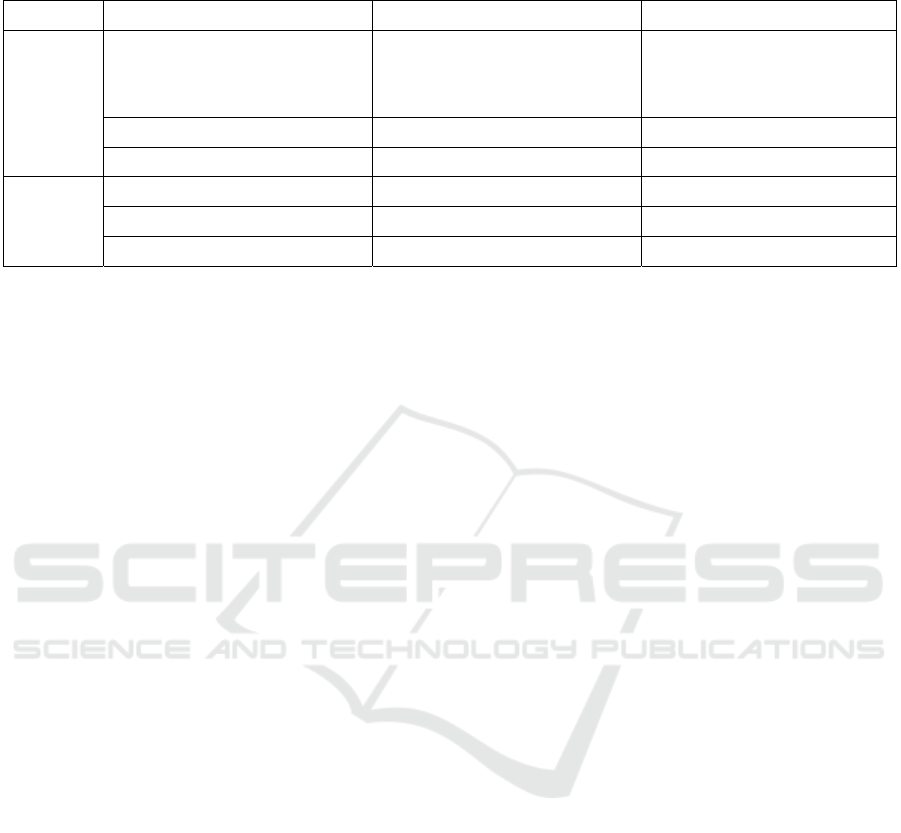
Table 3: Electrical consumption rate with respect to the sum of electrical and thermal consumption for each type of
production in textile mills.
Type of production Literature SET database
Distinct
textile
areas
Spinning (yarn production) 93% (UNIDO, 2010)
60-70% (Hasanbeigi, 2012b)
56% (Hong, 2010)
85% (average of 21 mills)
Weaving (fabric production) 85% (UNIDO, 2010) 73% (average of 44 mills)
Wet processing (finishing) 43% (UNIDO, 2010) 28% (average of 27 mills)
Composite
textile
areas
Yarn production and finishing - 56% (average of 4 mills)
Fabric production and finishing - 42% (average of 22 mills)
Yarn, fabric and finishing - 61% (average of 5 mills)
In wet textile processing thermal energy prevails,
because of high temperature processes (Hong, 2010)
and this is confirmed by the SET database analysis.
Table 3 shows some data found in literature
compared to data of the present paper (obtained by
the SET database). From the SET datasets (Table 2),
the electrical energy consumption prevails on
thermal energy consumption for both yarn and fabric
production with an average of 85% and 73%
respectively.
On the other hand, the thermal energy
consumption prevails in finishing factories
(electrical energy consumption has an average value
of 28%). The energy consumption in factories of
composite textile areas depends on the different mix
of production processes and thus the splitting of
energy consumptions between electrical and thermal
appears more balanced with respect to distinct textile
areas, showing an average of electrical energy
consumption ranging from 42% to 61% (Table 3).
3.3 Relationship between Energy and
Production
The SEC is the main indicator to express the energy
efficiency of a factory and it represents the energy
consumption of the whole factory per unit of product
(kWh/kg).
In order to obtain further information about the
energy management of the companies, the
Incremental Energy Consumption (IEC) is here
introduced, representing the energy consumption to
produce an additional unit of product (kWh/kg).
This indicator is obtained by investigating the
relationship between the monthly production and the
monthly energy consumption, since the energy
consumption is expected to be related to the
production (Palamutcu, 2010; Branchetti, 2016).
With a regression analysis method, the energy
consumption is estimated as:
y = m·x + q (1)
Where, y denotes the whole energy consumption
[kWh], m is the energy consumption to produce each
additional unit of product [kWh/kg], x is the
production amount [kg], q is the consumption when
the production is zero [kWh].
The model parameters (the slope m and the
interception q of the best fit line) were estimated for
all the available factories of SET database
correlating the monthly production (independent
variable) with the electrical and thermal energy
consumptions (dependent variables). In this way, m
represents the IEC and it can be calculated both for
the electrical and thermal energy.
The strength of the relationship between
production and energy consumptions (respectively,
electrical and thermal) for the SET database
factories has been checked by means of the
correlation coefficient R
2
.
When R
2
is close to 1, then the model fits the
data with good agreement and the energy
consumption appears strongly correlated to the
production. In these cases, it is possible to evaluate
the “base energy consumption”, which is the portion
(percentage) of the total energy not related to the
production (Branchetti, 2016). The “base energy
consumption” represents the energy auxiliary uses
(such as lighting, air conditioning, heating and
ventilation) and contributes to the increase of the
SEC, whereas it does not affect the IEC indicator of
the company.
On the other hand, in factories with a low R
2
,
and then with a low correlation between energy
consumption and production, it is not possible to
evaluate the “base energy consumption” and, in
SMARTGREENS 2019 - 8th International Conference on Smart Cities and Green ICT Systems
46
these cases, the factories may have not an adequate
management of the energy consumption or the
production might be composed of a wide mix of
different products and raw materials.
4 RESULTS
In the regression analysis for the SET datasets, the
values of the model parameters have been accepted
only when R
2
>0.5. Focusing on the 21 textile
factories for yarn production (Table 2), the linear
regression analysis shows that the electrical R
2
is
greater than 0.5 for 13 factories, whereas the thermal
R
2
is greater than 0.5 only for 1 factory.
The subsequent analysis is then focused on
electrical energy only, because of the prevalence of
electricity uses with respect to thermal energy in
yarn manufacturing and of the better correlation of
electricity with production.
The electrical SEC of the 13 factories ranges
from 1.4 to 14.5 kWh
e
/kg with an average of 5.6
kWh
e
/kg, a standard deviation (std) of 4.6 kWh
e
/kg
and a relative error (std/average) of 83% (Table 4).
On the other hand, the electrical IEC of these
factories ranges from 1.1 to 7.9 kWh
e
/kg and has an
average of 3.5 kWh
e
/kg with a standard deviation
(std) of 2.2 kWh
e
/kg and a relative error of 64%.
Table 4: Electrical SEC and IEC for factories with R
2
>0.5.
Average
[kWh
e
/kg]
std
Relative
error
Electrical SEC 5.6 ± 4.6 83%
Electrical IEC 3.5 ± 2.2 64%
Clustering the electrical SEC based on the kind
of raw materials (Table 5 and Figure 3), the factories
producing wool yarn show an electrical SEC ranging
between 6 to 14 kWh
e
/kg, which is higher than the
electrical SEC for factories producing yarn starting
from raw materials composed mainly of cotton or
“other materials” (i.e. linen, polyamide, acrylic and
polypropylene). The latter, as a matter of fact, ranges
between 2 and 4 kWh
e
/kg.
Table 5: Electrical SEC and related std clustered by the
kind of raw materials for factories with R
2
>0.5.
Electrical SEC
Average
[kWh
e
/kg]
std
Relative
error
WOOL 10.4 ± 4.0 39%
COTTON 2.4 ± 0.6 26%
OTHER 2.7 ± 1.0 37%
Figure 3: Electrical SEC clustered by the kind of raw
material for factories with R
2
>0.5.
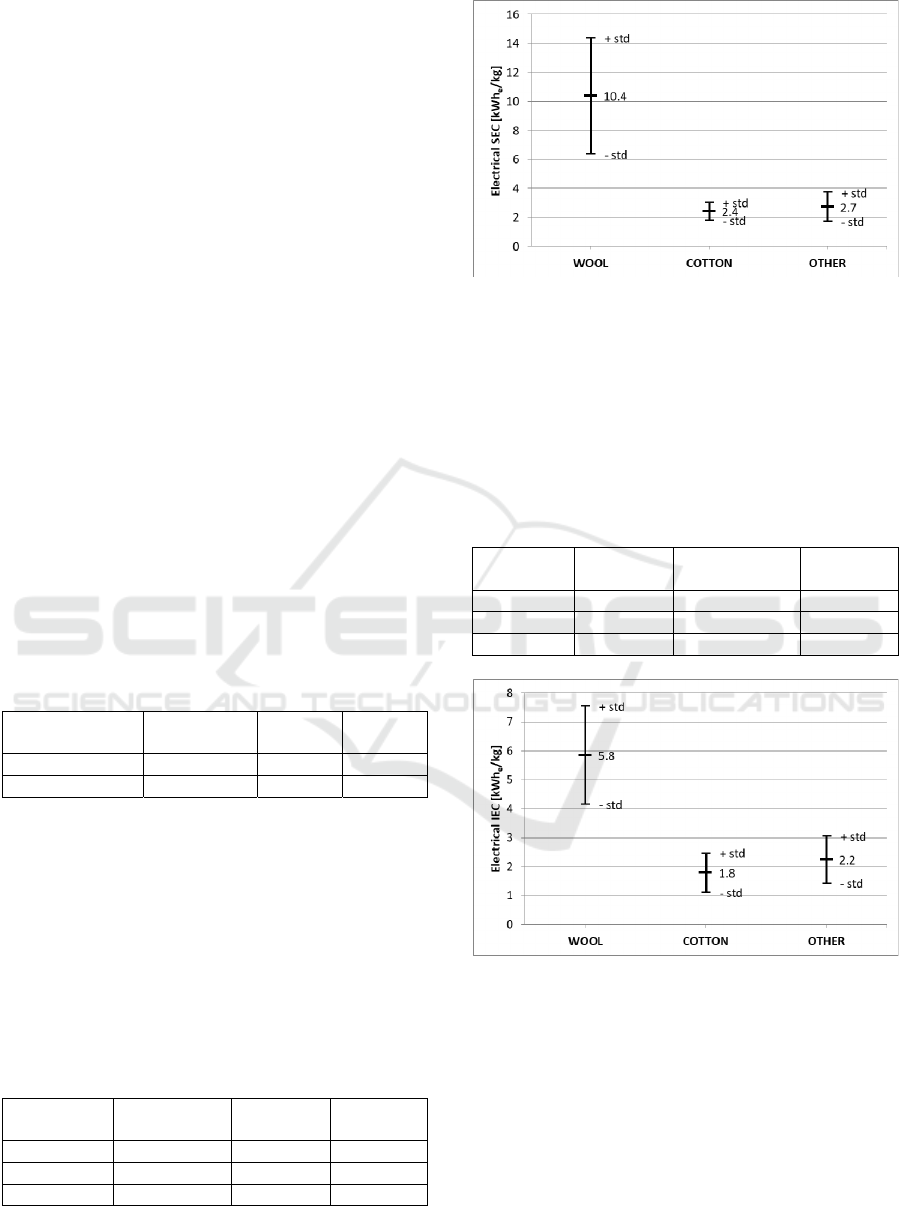
Similarly results are obtained for electrical IEC
(Table 6 and Figure 4). The factories producing
wool yarn show an electrical IEC ranging between 4
to 8 kWh
e
/kg, higher than the other clusters, which
ranges between 1 and 3 kWh
e
/kg.
Table 6: Electrical IEC and related std clustered by the
kind of raw materials for factories with R
2
>0.5.
Electrical
IEC
Average
[kWh
e
/kg]
std
Relative
error
WOOL 5.8 ± 1.7 29%
COTTON 1.8 ± 0.7 38%
OTHER 2.2 ± 0.8 37%
Figure 4: Electrical IEC clustered by the kind of raw
materials for factories with R
2
>0.5.
5 DISCUSSION OF THE RESULTS
The dataset extracted from the SET database for
yarn manufacturing confirms the prevalence of
electrical energy consumption with respect to the
thermal consumption and shows an electrical SEC
ranging from 1.4 to 14.5 kWh/kg with an average of
5.6 kWh/kg and a high relative error of about 83%.
Energy Consumption Characterization based on a Self-analysis Tool: A Case Study in Yarn Manufacturing
47

This range of values and its spread are compatible
with those found in literature (Figure 2) and are due
to many factors and choices already described in
section 2.2.
The regression analysis method applied to the
monthly data of each yarn manufacturing dataset
allows to calculate the electrical consumption per
each additional produced unit and the base electrical
energy consumption (auxiliary energy uses). The
latter ranges from 6.2% to 50.3%, with an average of
28%, and it is compatible with the energy
consumption values found in literature (Kaplan,
2010). Concerning the electrical energy
consumption per each additional unit of product
(electrical IEC), the outcome shows that it ranges
from 1.1 to 7.9 kWh/kg with an average value of 3.5
kWh/kg and with a lower relative error (64%) with
respect to the electrical SEC. The reason is that the
auxiliary energy uses in SEC added a further
variability in the electrical consumptions.
Clustering the data by raw materials, we have
found that the production of yarn based on wool is
more energy consuming than the production of yarn
starting from cotton or other fibers. This result has
been verified for both electrical SEC and electrical
IEC indicator. On the contrary, the clustering based
on market segment application of products (e.g.
clothing, home textile, etc.) or product market
segment (luxury, top, medium and low), does not
show satisfactory results.
The thermal electrical consumption is less
significant in yarn manufacturing, because in
average it contributes to about the 15% of the total
energy consumption of the factory (see table 2).
Moreover, it is not strictly related to yarn production
(only one yarn manufacturing mill of the SET
database shows a correlation coefficient R
2
>0.5).
6 CONCLUSIONS
In order to provide a fast and easy method to the
factories to preliminary evaluate their own energy
consumptions, a reference indicator would be useful
for a comparison. This would deliver a fair trade-off
between too general or too specific approaches and
between too naïve or too demanding methodologies.
Unfortunately the factories have very different
features: the textile production chains, even in their
sub-sectors segments, combine very heterogeneous
and fragmented processes and type of products.
Consequently, the energy indicators appear highly
variable and poorly representative.
The difficulties were tackled using a factory self-
analysis approach which has allowed to retrieve and
analyze wide and detailed sets of data. The SET
database, obtained by the SET tools, has been
presented in this paper and the yarn manufacturing
data have been investigated with the final goal of
obtaining valuable references for energy
consumptions.
The SET database counts 204 sets of data
regarding 140 factories and 4 main textile areas:
yarn production, fabric production, finishing
processes and a combination of them.
The results for yarn manufacturing are
complementary and consistent with respect to the
available literature and public data. They confirm a
high variability of SEC values within the textile
sector, but also a correlation with some production
variables, such as processes and raw materials. The
outcomes enrich the available data for the textile
industry and in particular for yarn manufacturing.
Clustering the datasets on the base of raw
materials allows to decrease the relative error from
83% to 25-40%
The separation of the auxiliary energy uses from
the production process energy consumption allows
the comparison of different energy contributions
among similar factories. The factories producing
wool yarn show electrical energy consumption per
each additional unit of product ranging from 4 to 8
kWhe/kg, while it ranges from 1 to 3 kWhe/kg for
factories producing yarn composed mainly of cotton
fibres or “other materials” (i.e. linen, polyamide,
acrylic and polypropylene).
The self-analysis approach allows to create a
self-growing dataset with indicators which are
supposed to become more and more representative
along with increasing factory involvement. From
this perspective, the SET database is meant to be a
starting point to build up comprehensive and
consistent models to depict energy consumptions for
textile industry. Moreover, the approach followed in
this paper can be implemented also in other
manufacturing sectors, even if clustering choices and
their usefulness depend on the particular chosen
sector and have to be verified case-by-case.
ACKNOWLEDGEMENTS
Financial support has been provided by the EU for
the development of the SET tools within the
ARTISAN, SESEC and SET projects.
SET was a project funded in 2014-2016 by the
“Intelligent Energy – Europe” programme (grant no.
SMARTGREENS 2019 - 8th International Conference on Smart Cities and Green ICT Systems
48

IEE/13/557/SI2.675575) with the goal of improving
the energy efficiency of at least 150 European
Textile SMEs with tangible and quantifiable
benefits.
SESEC was a co-funded project in 2012-14
within the European Programme Intelligent Energy
Europe by EASME (grant no.
IEE/11/827/SI2.615931).
ARTISAN was a R&D project co-financed in
2011-14 by the European Commission 7th
Framework Programme (FP7-ICT-2011-7 Grant
agreement 287993).
The results of this paper cannot be intended as
official reference values to be used for applications
of national subsidies for energy efficiency measures.
REFERENCES
Alkaya, E., Demirer, G.N., 2014. Sustainable textile
production: a case study from a woven fabric
manufacturing mill in Turkey. In Journal of Cleaner
Production. 65, 595-603.
Andersson, E., Arfwidsson, O., Thollander, P., 2018.
Benchmarking energy performance of industrial small
and medium-sized enterprises using an energy
efficiency index: Results based on an energy audit
policy program. In Journal of Cleaner Production.
182, 883-895.
Branchetti, S., Ciaccio, G., De Sabbata, P., Frascella, A.,
Nigliaccio, G., Zambelli, M., 2016. Energy Saving and
Efficiency Tool - A Sectorial Decision Support Model
for Energy Consumption Reduction in Manufacturing
SMEs. In SMARTGREENS: Proceedings of the 5th
International Conference on Smart Cities and Green
ICT Systems. 2016 Apr 23-25, Rome, Italy.
SCITEPRESS, pp. 330-339.
Dahllöf, L., 2004. LCA methodology issues for textile
products [Licentiate thesis]. Chalmers University of
Technology, Göteborg.
Ellebæk Larsen, S., Hansen, J., Knudsen, H.H., Wenzel,
H., Larsen, H.F., Møller Kristensen, F., 2007.
EDIPTEX — Environmental assessment of textiles.
Danish Ministry of the Environment, Environmental
Protection Agency. Working Report No. 24, Denmark.
EM2M, 2016. www.em2m.enea.it (accessed 9 May 2018).
EMS - Energy Management Standard in Textile Project -
EC European Intelligent Energy report, Section 4 -
Energy Consumption.
European Commission (EU), 2003. Integrated Pollution
Prevention and Control (IPPC) - Reference Document
on Best Available Techniques for the Textiles Industry,
Seville.
EUROSTAT, 2015. http://ec.europa.eu/eurostat/data/data
base (accessed 20 February 2018).
Hasanbeigi, A., Price, L., 2012a. A review of energy use
and energy efficiency technologies for the textile
industry. In Renewable and Sustainable Energy
Reviews. 16, 3648–3665.
Hasanbeigi, A., Hasanabadi, A., Abdorrazaghi, M., 2012b.
Comparison analysis of energy intensity for five major
sub-sectors of the Textile Industry in Iran. In Journal
of Cleaner Production. 23, 186-194.
Hong, G.B., Su, T.L., Lee, J.D., Hsu, T.C., Chen, H.W.,
2010. Energy conservation potential in Taiwanese
textile industry. In Energy Policy. 38, 7048-7053.
ITMF (International Textile Manufacturers Federation),
2003. International Production Cost Comparison -
Spinning/Weaving/Knitting. Zürich.
ITMF (International Textile Manufacturers Federation),
2014. International Production Cost Comparison –
Spinning/Texturing/Weaving/Knitting. Zürich.
Kaplan, E., Koç, E., 2010. An Investigation of Energy
Consumption in Yarn Production with Special
Reference to Open-End Rotor Spinning. In FIBRES &
TEXTILES in Eastern Europe. 18(79), 7-13.
Kim, S.Y., Grady, P.L., Hersh, S.P., 1983. Energy
consumption and conservation in the fibre-producing
and textile industries. In Textile Progress. 13(3), 1-14.
Koç, E., Kaplan, E., 2007. An Investigation on Energy
Consumption in Yarn Production with Special
Reference to Ring Spinning. In FIBRES & TEXTILES
in Eastern Europe. 15(63), 18-24.
Kumar, S., Visvanathan, C., Priambodo, A., 1999. Energy
and environmental indicators in the Thai textile
industry. Asian Inst. Technol. Thailand.
Lin, B., Zhao, H., 2016. Technology gap and regional
energy efficiency in China's textile industry: A non-
parametric meta-frontier approach. In Journal of
Cleaner Production. 137, 21-28.
Ozturk, E., Karaboyacı, M., Yetis, U., Yigit, N.O., Kitis,
M., 2015. Evaluation of Integrated Pollution
Prevention Control in a textile fiber production and
dyeing mill. In Journal of Cleaner Production. 88,
116-124.
Palamutcu, S., 2010. Electric energy consumption in the
cotton textile processing stages. In Energy. 35, 2945-
2952.
Pardo Martínez, C.I., 2010. Energy use and energy
efficiency development in the German and Colombian
textile industries. In Energy for Sustainable
Development. 14, 94-103.
Scheffer, M.R., 2015. In-depth Assessment of the Situation
of the T&C Sector in the EU and Prospects - task 7 -
Synthesis report for the European textile and clothing
sector. Final report ENTR/2010/16, 2012; Ref.
Ares(2015)2204860. Saxion Universities, The
Netherlands.
Steinberger, J.K., Friot, D., Jolliet, O., Erkman, S., 2009.
A spatially explicit life cycle inventory of the global
textile chain. In Int J Life Cycle Assess. 14, 443-455.
Tarakçıoğlu, I., 1984. Energy Consumption and
Conservation of Textile Finishing Mills. Uludag
University Press, Bursa. Turkish.
UNIDO (United Nations Industrial Development
Organization), 2010. Global Industrial Energy
Energy Consumption Characterization based on a Self-analysis Tool: A Case Study in Yarn Manufacturing
49

Efficiency Benchmarking - An Energy Policy Tool
Working Paper. Vienna.
Van der Velden, N.M., Patel, M.K., Vogtländer, J.G.,
2014. LCA benchmarking study on textiles made of
cotton, polyester, nylon, acryl, or elastane. In Int J Life
Cycle Assess. 19, 331-356.
Visvanathan, C., Kumar, S., Priambodo, A., Vigneswaran
S., 2000. Energy and Environmental Indicators in the
Thai Textile Industry. In Sustainable Energy and
Environmental Technologies. Proceedings of the Third
Asia-Pacific Conference. Hong Kong, 2000 Dec 3-6,
China, pp. 524-528. Hu X, Yue PL editors.
WTO (World Trade Organization), 2017. World Trade
Statistical Review, Geneva (Switzerland).
Zamani, B., Svanström, M., Peters, G., Rydberg, T., 2014.
A Carbon Footprint of Textile Recycling - A Case
Study in Sweden. In Journal of Industrial Ecology.
19(4), 676-687.
SMARTGREENS 2019 - 8th International Conference on Smart Cities and Green ICT Systems
50
