
Day-Ahead Optimization Algorithm for Demand Side Management in
Microgrids
Tiba Feizi
1
, Lennart von der Heiden
1
, Raisa Popova
1
, Mauricio Rojas
2
and Jean-Marie Gerbaulet
1
1
Deutsche Bahn Energie GmbH, Europaplatz 2, 10557, Berlin, Germany
2
Schneider Electric GmbH, EUREF-Campus 12-13, 10829 , Berlin, Germany
carlos-mauricio.rojas-la-rotta@se.com, jean-marie.gerbaulet@studierende.uni-flensburg.de
Keywords: Demand Side Management, Electric Vehicles, Microgrid, Smart Grid.
Abstract: Germany has the political vision of reducing carbon emissions and becoming environmentally sound.
According to this vision, the number of electric vehicles (EVs), charging stations and renewable power
generators being installed in low voltage grids would increase. The uncontrolled charging of a large number
of EVs can generate additional load peaks and lead to the violation of utilization limits in distribution grids.
However, the charging of EVs can be controlled, providing the opportunity to relieve the grid and reduce the
peak load. This control strategy is called Demand Side Management (DSM). This paper presents a day-ahead
optimization algorithm for DSM in a microgrid. The developed algorithm focuses on minimizing the load
peaks of a microgrid. Two scenarios, with and without stationary battery storage, have been developed and
tested with various historical load profiles of the Micro Smart Grid (MSG) on the European Energy Forum
(EUREF) campus in Berlin. The optimization results have shown that using the algorithm offers the possibility
to reduce microgrid load peaks.
1 INTRODUCTION
The German federal government promotes the selling
of new electric vehicles with the help of an
environmental bonus. This funding supports the rapid
spread of electric vehicles in the market (Bafa, 2017).
By 2025, 40 to 45 percent of the electricity consumed
in Germany has to derive from renewable energy
sources (BMWi, 2017).
The coupling of energy production from
renewable sources with EVs helps to reduce CO
2
emissions, and making the transition to a larger share
of renewable energy (Link, 2011). The increase of the
simultaneity of EV charging processes in the future
could lead to load peaks and utilization limit
violations (Nobis, 2015).
Controlled EV charging is used to avoid
additional load peaks and improve renewable energy
integration into the power grid (Agricola, 2011). The
function of charging management is to ensure that
charging takes place at times with excessive
generation from renewable sources, to improve the
integration of fluctuating renewable energies (Link,
2011).
Both load management and energy saving are
important elements of DSM. The approach DSM is
defined as load control, with the goal of smoothing
the load (Haasz, 2017).
By means of DSM, for example, by shifting load
peaks during off-peak periods, negative grid
perturbations could be significantly reduced (Friedle,
2018). There are different forms of DSM, as shown
in Table 1. The first form of DSM, shifting peak
consumption, has been used in the optimization
algorithm which is presented in this paper. In this
case, it is realized by load management of EVs. The
second form, reduction of peak consumption, is used
to minimize load peaks without shifting of the loads,
and the third form would be critical in the grid due to
increasing consumption. The fourth form has no
effect on load smoothing (Agricola, 2011).
EVs, especially when used in car sharing, can be
used for DSM because of their flexible load profile
(Seddig, 2015). A number of studies have discussed
the DSM of EVs in order to reduce the peak power.
Reference (Shao, 2011) presents a load shaping tool
to avoid the overloading of the transformer by using
a sensor at the transformer for load monitoring. Paper
(Pournaras, 2017) presents an optimization of EVs
Feizi, T., von der Heiden, L., Popova, R., Rojas, M. and Gerbaulet, J.
Day-Ahead Optimization Algorithm for Demand Side Management in Microgrids.
DOI: 10.5220/0007686600510057
In Proceedings of the 8th International Conference on Smart Cities and Green ICT Systems (SMARTGREENS 2019), pages 51-57
ISBN: 978-989-758-373-5
Copyright
c
2019 by SCITEPRESS – Science and Technology Publications, Lda. All rights reserved
51
charging by using a software application controlling
the battery charging in each EV to reduce the power
peaks and energy costs. Jaiswahl (Jaiswahl, 2017)
proposes an optimization algorithm to reduce both
demand and energy cost by integrating the system in
a smart metering. To implement the proposed
algorithms, bi-directional communication
infrastructure is required. The focus of this paper is
on a day-ahead optimization algorithm using forecast
data, which does not necessarily require bi-directional
communication.
EVs can also be used to reduce CO
2
emissions,
they must be charged with electric energy from
renewable sources. Otherwise, the CO
2
emissions
related to charging can be equal to or greater than
those of vehicles with combustion engines
(Bräuninger, 2017).
Table 1: Different forms of DSM (Agricola, 2011).
Shift of consumption
to off-peak hours
Reduction of consumption
at peak load times
Increase in consumption
during off-peak hours
Short-term change
of the load curve
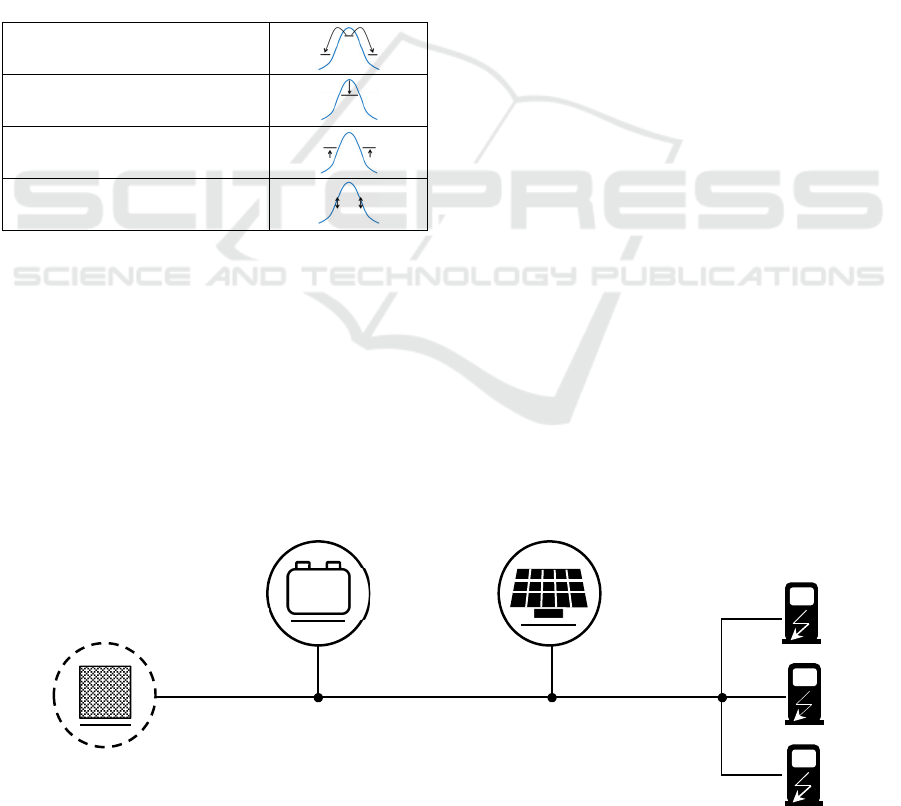
The integration of EVs into microgrids using
renewable energy systems is the prime objective of
the research project Mobility2Grid (Karohs, 2018).
This integration is practically tested in the laboratory
on the EUREF Campus.
The requirements for practical implementation of
DSM include forecasting and optimization of load
profiles of the EVs. The presented optimization
algorithm is based on the structure of a microgrid on
the EUREF Campus in Berlin, called MSG, as shown
in Figure 1.
Three PV systems with a total power of 82.5 kWp,
and a stationary Li-ion battery storage with a capacity
of 78 kWh, are connected to the MSG on the EUREF
campus. The maximum transformer power in this
MSG is 630 kVA. The transformer connects the low
voltage MSG to the medium voltage grid. The car
sharing station on the EUREF Campus has 33
charging stations, each with a maximum charging
power of 22 kW AC and a DC quick charger with a
power of 50 kW. In addition, there are also three
inductive charging stations, two of which with a
maximum power of 3.7 kW and one with a maximum
power of 7.4 kW.
2 PROPOSED MODELS
The proposed DSM method, specifically of a load
peak shaving on the EUREF MSG, is based on a day-
ahead data optimization. Figure 2 shows the modules
of the program used to implement the method of an
optimized DSM. The optimization tool is also used to
create day-ahead load profiles of EVs.
The aims of the controlled charging are
minimization of grid load and reduction of the extent
of grid expansion, which is taken into account by the
day-ahead optimization algorithm. The minimization
of the grid load of the MSG has been realized with a
linear optimization algorithm.
The constraints of the optimization algorithm are
defined by characteristics and limits of the charging
process of EVs and the battery storage. This includes
for example State of Charge (SoC) of batteries.
The used input data are the PV generation
forecasts and the load profiles of EVs. The output
data are the predicted load profiles of the following
day for stationary battery storage, and EVs.
Figure 1: Structure of the MSG on the EUREF Campus.
g
rid
charging stations
- +
s
tationary battery photovoltaic system
SMARTGREENS 2019 - 8th International Conference on Smart Cities and Green ICT Systems
52

Figure 2: Modules of the program for implementing the suggested DSM method.
2.1 Mathematical Models
The objective function minimizes the power from the
grid
, on the condition that the EVs achieve the
required SoC (
), cf. Formula 1. The linear
optimization is conducted based on equations 1 and
2. Set
defines the number of electric vehicles and
set
defines 15-minute time steps in the 24-
hour period (Δt = 0.25 h). The penalty parameter
ρ
is
multiplied by the difference between the desired and
actual States of Charge of EV (
,
,
,
).
Formula 2 is necessary to achieve the goal of peak
load reduction despite the sum based objective
function. For example, a charging power of 22 kW is
demanded in the first hour and charging power of
0 kW in the second hour. The application of Formula
2 would result in an averaging over both hours, with
the result of a charging power of 11 kW in the first
and second hour. Table 2 summarizes the
mathematical symbols of the paper.
Table 2: An overview of the mathematical symbols.
Symbol Definition
Power from the grid at the kth time step
Maximum power of the transformer
PV feed-in power at the kth time step
,
Charging power of the stationary
b
attery storage at the
k
th time step
,
Discharging power of the stationary
b
attery storage at the
k
th time step
,
Maximum charging power of the ith
charging event
,
Maximum charging power of the jth EV
SoC of the stationary battery storage at
the
k
th time step
Maximum SoC of the stationary battery
storage
Minimum SoC of the stationary battery
storage
Input
Conditions Optimized
D
S
M
Output
Forecasted
Load Profile of EVs
Forecasted
PV Feed-In
Limits EVs,
,
Charging
,
Stations
Limits
Stationary
Battery
System
Physical
Limit
Uploaded Load Profile
of EV
Load Profile of
Stationary Battery
Optimized Load
min
∑
Stationary
Battery
and EV
Variables in_out
Charging Events i
EVs j
Time Step k
Day-Ahead Optimization Algorithm for Demand Side Management in Microgrids
53

Table 2: An overview of the mathematical symbols (cont.).
,
SoC of the jth EV at the kth time step
Battery capacity of the jth EV
Capacity of the stationary battery
storage
Charging efficiency of the jth EV
Charging efficiency of the stationary
b
atter
y
stora
g
e
Discharging efficiency of the stationary
b
attery storage
min(
+∙(
,
−
,
))
∀ ∈
, ∀
∈
(1)
≤
/(
24
∆
)
(2)
The power balance requires that electrical power fed
into the grid (
∑
) equals consumed electrical
power (
∑
) (Frohe, 2011). The MSGs power
balance for the EUREF campus is represented by
Formula 3. Set
defines the number of load events.
0=
,,
+
,
−
,
−
+
,
−
,
∀ ∈
, ∀ ∈
, ∀
∈
(3)
The maximum power of the MSG
is expressed
by Formula 4. This parameter is determined from the
maximum capacity of the transformer.
0≤
,
−
,
≤
∀ ∈
(4)
The stationary battery storage of the MSG is
represented by the power
,
and
,
, the
efficiencies
and
, the capacity
and
the SoC. The SoC of the stationary battery storage
is calculated at time k with Formula 5.
=
+
∙
,
∙∆∙
−
∙
,
∙∆∙
∀ ∈
(5)
The SoC of the stationary battery
must not
drop below or increase above fixed limits, expressed
in Formula 6.
≤
≤
∀ ∈
(6)
The variable _ is defined to avoid the stationary
battery storage being charged and discharged at the
same time. This variable is used in Formulas 7 and 8
to limit the feed-in power and output power of the
battery. These formulas are also used for the EVs at
the MSG charging stations.
,
≤
,
∙_
_
∈
0,1
, ∀ ∈
(7)
,
≤
,
∙(1−_)
_
∈
0,1
, ∀ ∈
(8)
The actual charging time is a result of the
optimization of
,,
for each time step k and each EV
j for the individual load events i. If the EV is not
connected to the charging station,
,,
is limited to
0. If the EV is connected to the charging station and
the time is within the charging time,
,,
is limited
by the maximum possible charging power, as seen in
Formula 9.
,,j
Ch
=min
,max
Ch
,
,max
Ch
∀ ∈
(9)
To calculate the SoC of the EV
,
, Formula 10 is
used. It is analogous to Formula 5 for calculating the
SoC of the stationary battery storage.
,
=
,
+
,
∙
∙
∆
∙
1
∀ ∈
, ∀
∈
(10)
The value of the SoC of the EV
,
is limited by
Formula 11.
SoC
≤
,
≤SoC
∀ ∈
, ∀
∈
(11)
The mathematical problem was transformed into
an algorithm using Python programming language.
SMARTGREENS 2019 - 8th International Conference on Smart Cities and Green ICT Systems
54
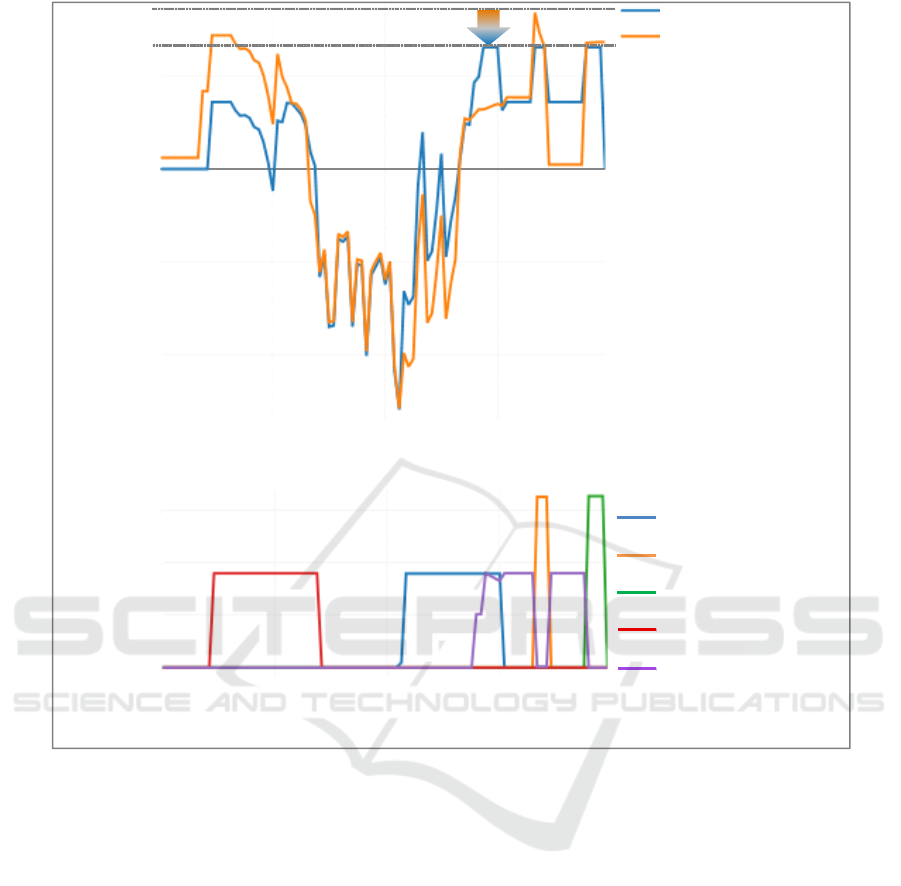
Figure 3: Scenario 1 – Power from the grid measured at the transformer with / without optimization (top) and charging cycles
of the EVs (bottom).
The optimization models were implemented with
the python software package Pyomo (Python
Optimization Modeling Objects). The
implementation is based on algebraic modelling
languages (AMLs), which support the analysis of the
previously constructed mathematical model (Hart,
2012). The open source mixed integer programming
solver "CBC" (COIN-OR Branch and Cut) was used
as the solver of the optimization algorithm.
2.2 Validation Scenario
The proposed algorithm is validated with two
scenarios. In scenario 1, the charging cycle and
charging power of the EVs are optimized on the basis
of the MSG conditions. At the departure time, all EVs
should be as fully charged as they would be without
optimization. For scenario 2, the conditions of the
first scenario are considered, and the stationary
battery storage is added as a flexible load.
3 OPTIMIZATION RESULTS
The optimization algorithm was validated with
historical data from the EUREF campus MSG. The
results of the optimization algorithm are shown, for
the 23rd of July 2017 in Figure 3.The upper section
of the figure, shows the transformer load with and
without optimization in scenario 1 (
Opt.,
no Opt.). The lower section shows the charge cycles
of the EVs. In the upper section, it can be observed
that the maximum power of the day in question can
be reduced from 8.8 kW to 6.5 kW. Further reduction
of power is not possible, under the constraint that the
EVs must obtain the same SoC they would have
00:00 06:00 12:00 18:00
Jul 23, 2017
00:00 06:00 12:00 18:00
Jul 23, 2017
5
0
-5
-10
6
4
2
0
Transformer Power [kW]
Opt.
no Opt.
EV Power [kW]
Day-Ahead Optimization Algorithm for Demand Side Management in Microgrids
55
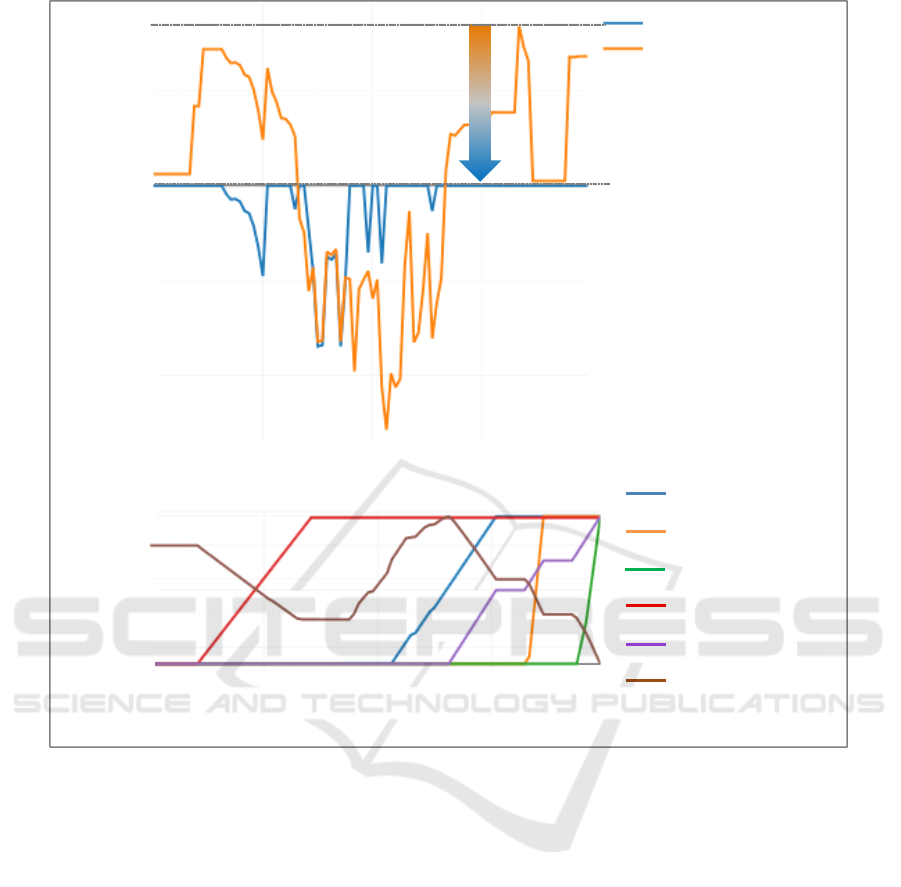
Figure 4: Scenario 2 - Power from the grid measured at the transformer with / without optimization (top) and SoC of the
battery of the EVs and Stationary battery Storage (bottom).
without optimization. The EVs (orange and green
curve) must be charged during parking time, with the
maximum available power.
In scenario 2, with the flexibility of the stationary
battery, the maximum grid load can be reduced to
0 kW (blue curve), see the upper part of Figure 4. In
the same figure, the lower section shows the SoC of
the EVs batteries and the stationary battery storage.
The electric vehicles are charged completely within
the given time, despite the load shift. It can be
observed that the stationary battery storage
(brown curve) is discharged during the morning and
in the evening, and is charged at noon by the PV feed-
in. The energy for the EVs comes either directly from
the PV system (the blue curve) or from the stationary
battery (the purple curve), as can be seen in the lower
part of Figure 4.
4 CONCLUSIONS
In this paper, an optimization algorithm for DSM has
been presented and its functionality was validated
with the historic load profile of the MSG on the
EUREF Campus. Two scenarios were outlined. The
optimization results have shown that the use of the
DSM operating strategy in the MSG allows to
postpone the load to off-peak hours and to reduce load
peaks. On the EUREF Campus, maximum load was
reduced up to 30% in the first scenario by using the
EVs as a flexible load. In the second scenario, the load
was reduced up to 100% by adding the flexible
stationary battery storage. Consequently, the
presented method can help minimize the need for
reinforcements of the grid.
00:00 06:00 12:00 18:00
00:00 06:00 12:00 18:00
Jul 23, 2017
5
0
-5
-10
Jul 23, 2017
1
0.5
0
Transformer Power [kW]
SoC
Opt.
no Opt.
SMARTGREENS 2019 - 8th International Conference on Smart Cities and Green ICT Systems
56

This day-ahead optimization algorithm requires
either forecast data or data provided by charging
protocol ISO 15118 as input parameters. The protocol
allows accessing the SoC and capacity of the EV
battery. There is currently no EV on the market,
which supports this standard protocol. When
forecasting is used, the forecast errors are quite high
(around 2.5 hours) (Renner, 2018). To reduce the
forecast errors, more application data is needed. The
Mobility2Grid project is working on that subject
(Voß, 2018). The optimization algorithm can also be
used for electric vehicle or bus fleets with known
data, such as the timetables of EVs and load profiles.
In that case, the problem of forecast errors or
inaccessible data of the vehicles does not apply.
ACKNOWLEDGEMENTS
The work in this paper is part of the Mobility2Grid
research project, which is funded by the German
Ministry for Research and Education and supported
by the Deutsche Bahn Energie GmbH.
REFERENCES
Agricola, A., 2011. Demand Side Management in
Deutschland Potenziale und Märkte. Deutsche Energie
Agentur.
Bafa, 2017. Bundesamt für Wirtschaft und
Ausfuhrkontrolle, Förderung von elektrisch
betriebenen Fahrzeugen.
BMWi, 2017. Bundesministerium für Wirtschaft und
Energie, Die nächste Phase der Energiewende,
Erneuerbare Energie-Gesetzt- EEG 2017.
Bräuninger, M., Schnaars, Ph., Teuber, M., 2017.
Implications of Electromobility for the Electricity
Market and CO2 Levels, Volume 97, Issue 10, pp 752–
754.
Friedle, G., Walcher, F., Sträglich, J., Fritz, T.,
Manteufeufell, D., 2018. Blackout E-Mobilität setzt
Netzbetreiber unter Druck. Available at
https://www.oliverwyman.de.
Frohe, H., Löcherer, K., Müller, H., Harriehausen, T.,
Schwarzarzenau, D., 2011. Moeller Grundlagen der
Elektrotechnik, 22. Auflage, Page 59.
Haasz, T., 2017. Entwicklung von Methoden zur Abbildung
von Demand Side Management in einem optimierenden
Energiesystemmodell, University of Stuttgart.
Hart, W., Watson, J., Woodruff, D., 2012. Pyomo -
Optimization Modelling in Python. Bd. 67. Springer
Science Business Media.
Jaiswahl, S. Ballal, M., 2017. Optimal Load Management
of Plug-in Electric Vehicles with Demand Side
Management in Vehicle to Grid Application, IEEE
Transportation Electrification Conference, India.
Karohs, K., Göhlich, D., Lauth, E., 2018. Research Campus
Mobility2Grid, In 2nd E-Mobility Power System
Integration Symposium.
Link, J., 2011. Elektromobilität und erneuerbare Energie:
lokal optimierter Einsatz von netzgekoppelten
Fahrzeugen, Technical University of Dortmund.
Nobis, Ph., Fischhaber, S., 2015. Belastung der Stromnetze
durch Elektromobilität, Forschungsstelle für
Energiewirtschaft e.V.
Pournaras, E., Jung, S., Zhang, H., Fang X., Sanders L.,
2017. Socio-technical Smart Grid Optimization via
Decentralized Charge Control of Electric Vehicles,
Journal of Latex Class Files, Vol. 14, No. 8.
Renner, M., et al., 2018. Electric Vehicle Intraday
Forecasting with Artificial Intelligence, In
Mobility2Grid Lab2Reality Conference.
Seddig, K., Salah, F., Schnug, S., Frank, M., 2015
Dezentrales Lastmanagement von E-Flotten unter
Berücksichtigung der Erzeugungs- und
Netzverfügbarkeit, In ETG- Fachbericht 145, Von
Smart Grid zu Smart Markets, Kassel.
Shao, S., Pipattanasomporn M., Rahman S., 2011. Demand
Response as a Load Shaping Tool in an Intelligent Grid
with Electric Vehicles, IEEE Transactions on Smart
Grid, Vol. 2 No. 4.
Voß, M., Wilhelm, M., Albayrak, S., 2018. Application
Independent Flexibility Assessment and Forecasting for
Controlled EV Charging, In 7th International
Conference on Smart Cities and Green ICT System
(SMARTGREENS).
Day-Ahead Optimization Algorithm for Demand Side Management in Microgrids
57
