
Assessing Software Quality of Agile Student Projects by Data-mining
Software Repositories
Falko Koetter
1
, Monika Kochanowski
1
, Maximilien Kintz
1
, Benedikt Kersjes
2
, Ivan Bogicevic
2
and Stefan Wagner
2
1
Fraunhofer Institute of Industrial Engineering, Nobelstr. 12, Stuttgart, Germany
2
Institute of Software Technology, University of Stuttgart, Universit
¨
atsstr. 38, Stuttgart, Germany
Keywords: Software Quality, Data-mining, Software Development, Project-based Learning, Metrics, Student Project.
Abstract:
Group student software projects are important in computer science education. Students are encouraged to
self-organize and learn technical skills, preparing them for real life software development. However, the
projects contribute to multiple learning objectives, making coaching students a time consuming task. Thus,
it is important to have a suitable best practice development process. For providing better insights for the
students, the resulting software has to be of value and meet quality requirements, including maintainability, as
in real life software development. Using source code quality metrics and by data mining repository data like
commit history, we analyze six student projects, measuring their quality and identifying contributing factors
to success or failure of a student project. Based on the findings, we formulate recommendations to improve
future projects for students and researchers alike.
1 INTRODUCTION
Developing software in teams is an integral skill in
software engineering. Software development projects
can educate students not only in technical aspects,
but also in software development and teamwork tech-
niques. They are an important part of education at
many universities.
At the University of Stuttgart, software engineer-
ing students have to complete a student project, de-
veloping a piece of software over a year. Team sizes
ranges between six to fifteen students. Researchers,
either faculty staff or external personnel, represent the
real academic customer. Fraunhofer IAO, an applied
research institute in industrial engineering, is one of
these customers, offering student projects. The stu-
dents develop prototypes for research projects.
While students are interested in learning, getting
insight into new and exciting technologies, and get-
ting good grades, researchers hope to receive high-
quality software for their research projects. Addition-
ally for preparing students for real life software de-
velopment, quality and metrics are at least as impor-
tant as the novelty. Though overall student projects
have been successful, the quality of code and pro-
cesses varies strongly, as does the size and experience
of student teams and the software to be developed.
While learning to work in teams and self-organize is
an educational goal of student projects, nevertheless
the students can improve themselves with guidelines
on how to succeed.
To reduce this variance and to make future
projects more successful for students and researchers
alike, we perform an assessment of six past projects.
In this work, we describe a methodology for assess-
ing the quality of student projects using source code
repositories, assessing both source code as well as
commit history. We compare the findings to an assess-
ment of project outcome by supervising researchers,
deriving lessons learned and recommendations. Us-
ing the developed methodology, we show how fu-
ture student projects can improve by performing code
analysis at different project milestones and giving
students feedback. Additionally, we show how the
methodology fits other kinds of software projects.
The remainder of this work is structured as fol-
lows: In Section 2 the related work is presented. The
methodology follows in Section 3, focusing on main-
tainability and describing the benchmark, repository
analysis, and questionnaires. Section 4 gives insights
in the results, while Section 5 gives recommendations
for student software projects based on the results. Fi-
nally, a conclusion and outlook are given in Section 6.
244
Koetter, F., Kochanowski, M., Kintz, M., Kersjes, B., Bogicevic, I. and Wagner, S.
Assessing Software Quality of Agile Student Projects by Data-mining Software Repositories.
DOI: 10.5220/0007688602440251
In Proceedings of the 11th International Conference on Computer Supported Education (CSEDU 2019), pages 244-251
ISBN: 978-989-758-367-4
Copyright
c
2019 by SCITEPRESS – Science and Technology Publications, Lda. All rights reserved

2 RELATED WORK
Related work is considered in two areas: (1) software
quality models and (2) previous analyses in student
projects. Based on these findings, we formulate the
research goal.
2.1 Quality Models
Quality models help model the quality requirements,
assess the quality of a software system and finding
suitable metrics (Deissenboeck et al., 2009). While
some quality models are mostly descriptive, others
offer quantitative methods to measure and compare
quality.
ISO 9126 contains a descriptive quality model for
software systems, describing quality in the charac-
teristics functionality, reliability, usability, efficiency,
maintainability and portability (ISO 9126, 2001). It
has been replaced in 2011 by ISO 25010 (ISO 25010,
2011), adding the characteristics security and compat-
ibility.
The Factor Criteria Metric (FCM) (Company
et al., 1977) defines quality as a set of factors, for
which in turn criteria are defined, which can be mea-
sured with metrics. For example, the factor reliability
has a criteria recoverability for which a metric is mean
time to repair (MTTR). FCM contains a large catalog
of factors, criteria and metrics.
The Squale Model extends FCM with practices,
situated between criteria and metrics, losing an ab-
straction gap by answering why a criteria is not ful-
filled (Mordal-Manet et al., 2009). For example, a
high MTTR indicates bad recoverability, but offers no
reason. In Squale, adding the lines of codes for a re-
pair by source file as a practice offers actionable in-
sight. In addition, Squale offers methods to aggregate
metrics to a score.
Similarly to Squale, Quamoco aims to integrate
quantitative rating (Wagner et al., 2012). A meta
model of factors, divided in quality aspects (compa-
rable to ISO 25010) and product factors, which are
measurable attributes of system components, can be
refined in a hierarchical quality model. For example,
models for Java and C# are derived from a generic
object oriented model.
Goal question metric (GQM) is a method to cre-
ate quality models for software systems (Caldiera and
Rombach, 1994). It postulates that to measure qual-
ity, project goals need to be defined first. From these
goals, questions are derived, which in turn can be an-
swered by metrics, forming a hierarchical structure.
Software metrics allow systematically quantifying
abstract quality criteria of software systems. Accord-
ing to (Hoffmann, 2013), the suitability and useful-
ness of metrics depends on six factors: objectivity,
robustness, comparability, economic efficiency, cor-
relation with quality criteria, and usability.
Metrics are separated in different categories. Di-
mensional metrics such as number of methods (NOM)
measure the size and modularity (Bruntink and
Van Deursen, 2004). Coupling metrics such as cou-
pling between objects (CBO) measure the interlink-
ing between different code artifacts (Chidamber and
Kemerer, 1994). Complexity metrics such as the cy-
clomatic complexity (measuring the number of pos-
sible paths through a code block) measure the com-
plexity of code (McCabe, 1976). Inheritance metrics
such as depth of inheritance tree (DIT) measure the
complexity of object orientation (Chidamber and Ke-
merer, 1994). Documentation metrics such as com-
ment density (CD) measure the availability of source
code documentation (Etzkorn et al., 2001).
2.2 Analysis of Student Projects
A previous quantitative analysis of student projects at
the University of Stuttgart (Hampp, 2006) aimed to
improve effort estimation by giving students average
values of previous projects. A key finding is that code
production has a similar speed in student and industry
projects. However, it remains unclear if there is also
a parity in quality.
The Tampere University of Technology conducted
a multi-year study, collecting data from student
projects such as issues, experiences with tools and
time spent per project phase (Ahtee, 2003). This data
helps student in the following years to avoid pitfalls
and assess their performance. The author considers
the availability of this data a crucial factor for the suc-
cess of the course.
Eindhoven University of technology conducts stu-
dent projects as well (Poncin et al., 2011). Here,
source code repositories, issue trackers and mailing
lists are used to analyze the software creation process
in order to learn about issues such as reuse of pro-
totypes and work distribution between students. The
analysis showed that guideline violations by students
could be found earlier using the available data.
Compared to the previous analyses, this work
aims to combine code analysis and software repos-
itory analysis in order to assess software qual-
ity focused on maintainability of software created
in student projects. Combining the findings with
questionnaire-based insights from the projects, we de-
rive recommendations to improve the coaching of stu-
dents by researchers with the goal to improve soft-
ware quality as well as real-life development skills.
Assessing Software Quality of Agile Student Projects by Data-mining Software Repositories
245

3 METHODOLOGY
3.1 Student Projects Setting
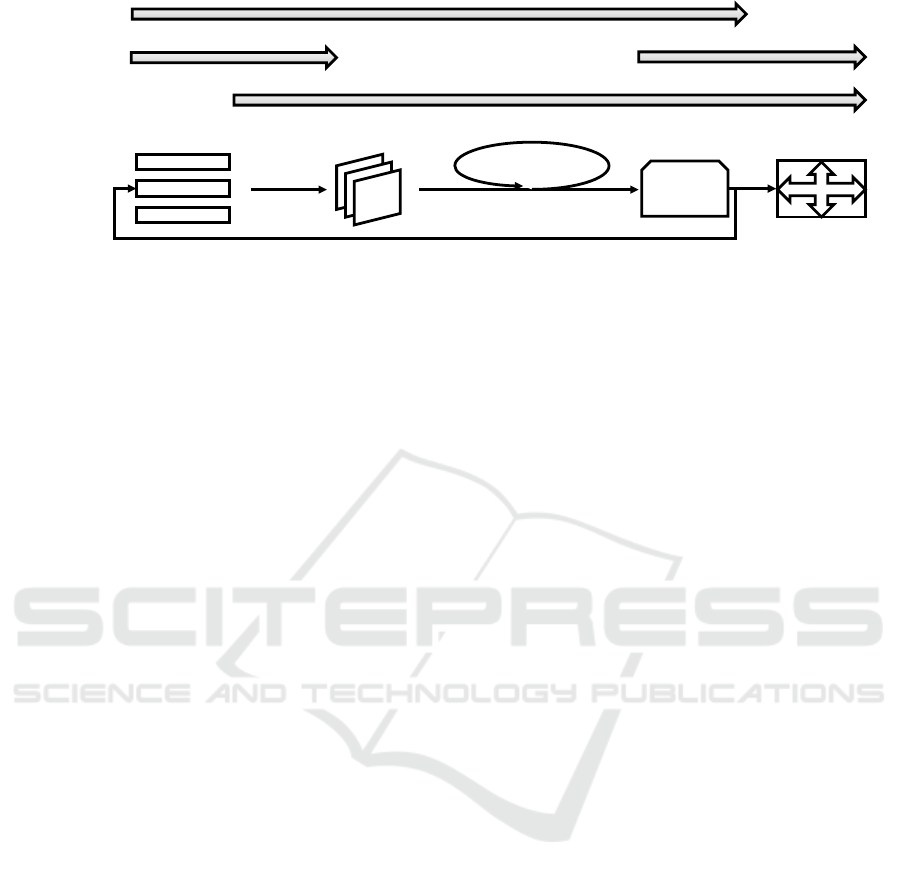
During a student project at Fraunhofer IAO, a piece of
software, usually a research prototype, is developed
by a team of 6 to 15 students over two semesters (one
year) using an approach with some concepts from
Scrum (Schwaber and Sutherland, 2011) as shown in
Figure 1. As the students have a limited amount of
time each week to work on the projects and other tasks
in parallel, it is not possible to implement Scrum fully.
As the process is Scrum-like, it is clearly not Scrum,
but still for the remainder of this paper, we use the
notion Scrum for better readability.
The students form a Scrum team, developing soft-
ware in month-long sprints, working 10 hours per
week according to their own schedule. The Scrum
master is a student, so the team is self-organizing.
Two or more researchers conduct the project, some-
times separated between a coach assisting the Scrum
team and a product owner. Students are highly en-
couraged to meet at least once a week for a weekly
Scrum meeting and co-working. About once a month,
a sprint review and a sprint planning with the product
owner and coach take place.
As part of the last sprint, the researchers perform
acceptance testing and take ownership of the finished
software. As the scope is variable, projects always
end on time. After the project concludes, the students
continue their studies and the researchers put the fin-
ished software to use.
Although it might be interesting to investigate the
skills of the students, previous experience of the stu-
dents and researchers, optimal student group sizes for
the projects, and many other factors which defini-
tively correlate with success and software quality of
student’s group projects, these cannot be influenced
by the researches coaching the students in the setting
described in this paper. The focus of this work lies on
the metrics and software repository statistics.
3.2 Maintainability Metric
The main criteria to measure the student software is
maintainability, as it is of most use for researchers and
a very important aspect of software quality in real life.
While functionality can be assessed relatively
straightforwardly during the project (e.g. acceptance
testing by the product owner), maintainability of code
cannot, as code reviews are time-intensive and need
knowledgeable product owners. However, maintain-
ability is critical, as students leave after the project.
As research is open ended, it is not always clear in
advance what kind of maintenance and continuing de-
velopment will be necessary. Outcomes range from a
prototype used once for trial immediately after ship-
ping to becoming the basis for a decade-running soft-
ware product.
To analyze maintainability, the goal question met-
ric method is used, due to its flexibility and suitabil-
ity to the low number of software projects under re-
view. Based on the definition of maintainability in
ISO 25010 (ISO 25010, 2011), we defined five ques-
tions:
• To what extent is the source code modularized?
• How well can parts of the source code be reused?
• How well can the source code be analyzed?
• How easily can the source code be modified?
• How well can the source code be tested?
Many metrics used by students and in industry to
quantify maintainability are outdated or of question-
able relevance (Ostberg and Wagner, 2014). Thus,
we only chose metrics for which the link with the
relevant question has been empirically shown or
scientifically argued. In the following, we list the
chosen metrics with relevant sources.
Modularity
Response for Class (Briand et al., 1999),
Coupling between Objects (Briand et al., 1999),
Message Passing Coupling (Briand et al., 1999),
Data Abstraction Coupling (Briand et al., 1999),
Coupling Factor (Briand et al., 1999).
Reusability
Weighted Methods per Class (Etzkorn et al., 2001),
Lack of Cohesion of Methods (Etzkorn et al., 2001),
Number of Public Methods (Etzkorn et al., 2001),
Comment Density (Etzkorn et al., 2001),
Documented Public API (Etzkorn et al., 2001).
Analyzability
Weighted Methods per Class (Zuse, 1993),
Depth of Inheritance Tree (Harrison et al., 2000),
Coupling Factor (Meyer, 1988).
Modifiability
Number of Methods (Li and Henry, 1993),
Weighted Methods per Class (Li and Henry, 1993),
Response for Class (Li and Henry, 1993),
Coupling between Objects (Chidamber et al., 1998),
Lack of Cohesion of Methods (Chidamber et al.,
1998)(Bruntink and Van Deursen, 2004),
Depth of Inheritance Tree (Chidamber et al., 1998)
(Harrison et al., 2000),
Number of Children (Bruntink and Van Deursen,
2004),
CSEDU 2019 - 11th International Conference on Computer Supported Education
246
product backlog
sprint backlog
sprint planning
sprint
7 days
weekly scrum
sprint review
software
increment
30 days per sprint
maintainance and
use in research
student team
(6-15 students)
product owner
(researcher)
coach
(researcher)
After
1 year
Figure 1: Scrum-like development in a simplified student project process with roles and their involvement over time.
Message Passing Coupling (Bruntink and
Van Deursen, 2004),
Data Abstraction Coupling (Bruntink and
Van Deursen, 2004),
Methods Inheritance Factor (e Abreu and Melo,
1996),
Attributes Inheritance Factor (e Abreu and Melo,
1996),
Polymorphism Factor (e Abreu and Melo, 1996),
Coupling Factor (e Abreu and Melo, 1996).
Testability
Number of Fields (Bruntink and Van Deursen, 2004),
Number of Methods (Bruntink and Van Deursen,
2004),
Weighted Methods per Class (Bruntink and
Van Deursen, 2004),
Response for Class (Bruntink and Van Deursen,
2004).
3.3 Benchmark
To compare the projects, we aggregate and weight the
metrics. While Quamoco and Squale contain meth-
ods to aggregate metrics, GQM does not. Thus, the
custom approach works as follows:
1. Calculate all metrics
2. For each metric, determine the best project and
divide the results of all projects by that of the best
project, resulting in a score between 0 and 1.
3. For each question, add the scores of each project.
Again, divide all resulting scores by that of the
best project.
4. Create the sum of all five questions, resulting in a
final score between 0 and 5.
3.4 Repository Analysis
Conway’s law states that the structure of software
mimics the structure of organizations that create it
(Conway, 1968). As one goal of the assessment is
to identify best practices, the software creation pro-
cess needs to be investigated as well. While the spe-
cific Scrum-like student project process defines the
broader project structure, the students have a high de-
gree of freedom how to work within this model.
As the projects are finished, a direct observation
of behavior is no longer possible. However, the soft-
ware repositories are artifacts containing the develop-
ment history as commits, associating increments of
code with completion date and authors. Students and
team vary in their experience, skill level, work habits
and commitment to the project. Based on our experi-
ences, we formulated the following questions for soft-
ware repository analysis:
• Are commits and lines of code evenly distributed
between weekdays, workdays and weekends? Are
they evenly distributed between the weeks within
the sprint and projects months or are there dis-
crepancies (e.g. higher activity before deadlines)?
• Are contributions evenly distributed between all
team members or are there members significantly
deviating from the average?
• Are commits uniform in size or are there many
very large or small commits?
3.5 Questionnaires
To capture the researchers’ perspective, who coached
the project and continued to use the finished soft-
ware in their work, we designed a questionnaire with
20 questions regarding researcher expertise, project
success, software structure, quality, maintainability,
further use and development, quality of researchers’
coaching, and the student team.
The researchers associated with one of the re-
viewed projects filled in the questionnaire, resulting
in 11 questionnaires, at least one for each project.
Assessing Software Quality of Agile Student Projects by Data-mining Software Repositories
247
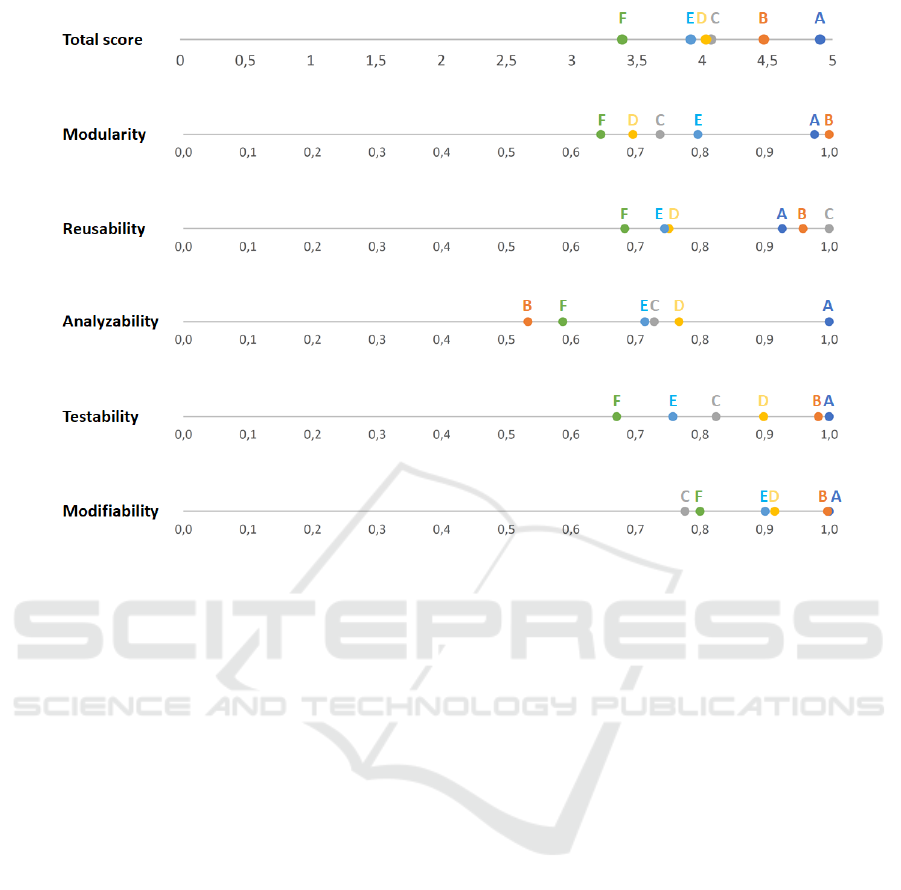
Figure 2: Maintainability benchmark results of six investigated student projects, total score and five questions.
4 RESULTS
Based on the proposed methodology, we developed
an automated Python tool to calculate the benchmark,
taking a GIT repository and calculating the maintain-
ability benchmark, performing the repository analysis
and visualizing all results in a web frontend. For cal-
culating metrics, the open source SourceMeter suite
was used (FrontEndART Ltd., 2018).
Using the tool, we conducted the benchmark for
six student projects. Results are displayed in Figure 2.
The results show a high consistency in the ranking
of projects regarding the different questions, with the
overall best project A and overall worst project F be-
ing consistently at the upper and lower ends. In the
total score, there is a difference of 40% between the
best and the worst project, indicating significant dif-
ferences in maintainability between projects.
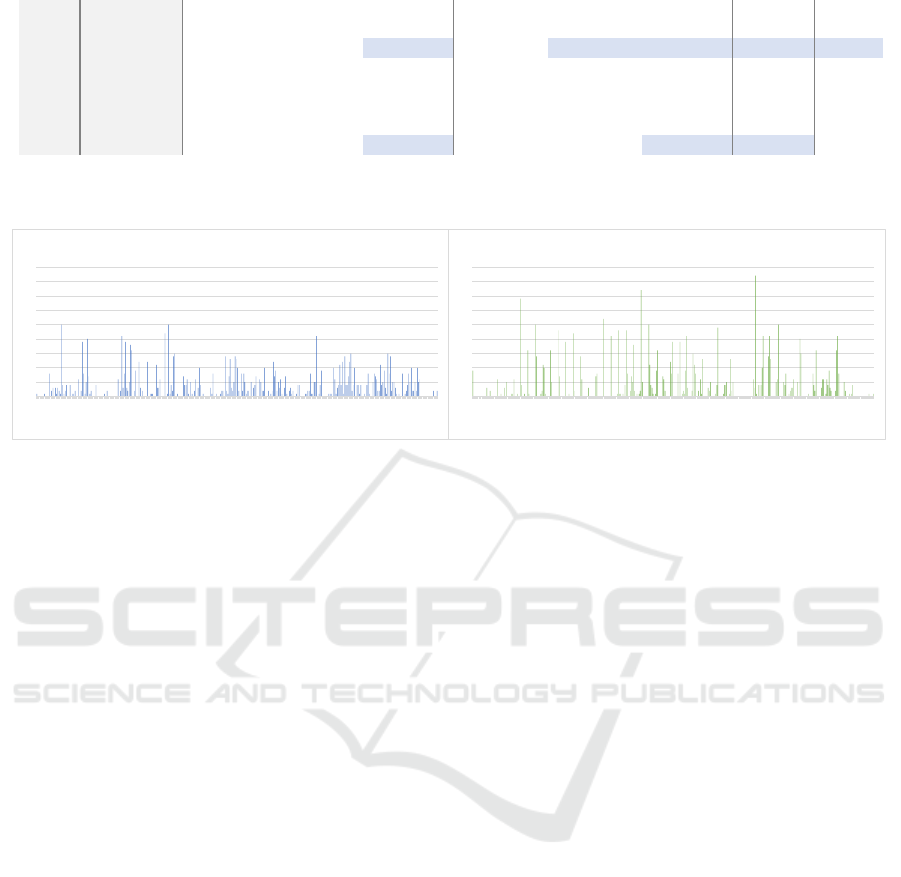
The main results of the repository analysis are
shown in Figure 3. From raw values we calculate av-
erages, standard deviation and coefficient of variation
(standard deviation divided by mean) to determine
how much and how consistently the students worked.
The results show that work habits of student between
the more successful and unsuccessful projects vary.
Figure 4 shows a comparison of commit history be-
tween project A and F. Project F fluctuates between
periods of low activity and large peaks (usually before
a sprint review). In comparison, commits in project A
are more evenly distributed, considering the part-time
nature of student projects.
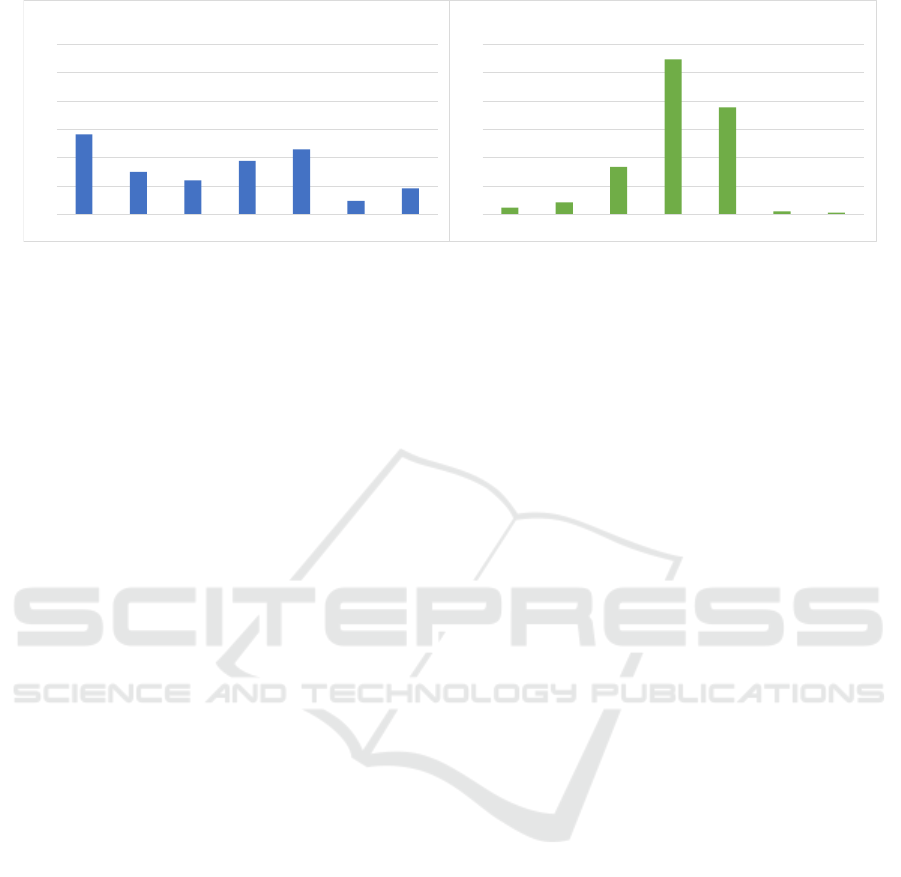
Comparing the commits of project A and F by
weekday gives a similar picture. While in project A,
work is distributed relatively evenly between week-
days and work is done on weekends as well, work
in project F focuses on two weekdays with almost
no work on weekends. The peak on Thursday in
project F results from this being the co-working days
the students spent together at the Fraunhofer office.
Overall, the uniformity of work between weekdays
shows a high positive correlation with benchmark
score (r = 0, 79), as does the percentage of commits
on weekends (r = 0, 78). It is possible that both these
values correlate with a higher percentage of work
done at home, where there are fewer distractions than
in a team setting. Evenly distributed commits may
also indicate students being confident working alone,
compared to only being comfortable committing code
with a colleague. Although it is possible to calcu-
late p-values for this data, the low number of projects
investigated does not provide statistical significance,
but an interesting trend for further investigation.
Finally, the amount of code created correlates neg-
atively with benchmark score (r = −0, 63), as does
team size (r = −0, 86), with an especially large corre-
lation between modularity and team size (r = −0, 93).
CSEDU 2019 - 11th International Conference on Computer Supported Education
248
Project
Benchmark
score
Commits /
day
… standard
deviation
… variation
coefficient
Commits /
weekday
... standard
deviation
… variation
coefficient
Weekend
commits
Lines of
code
A
4,905 3,420 4,727 1,382 159,286 74,674 0,469 12,7% 13969
B
4,475 1,609 3,050 1,896 89,857 51,745
0,576
12,7% 10267
C
4,069 4,477 9,595 2,143 492,429 334,782
0,680 12,6% 27020
D
4,030 12,085 17,139 1,418 630,143 524,474
0,832 12,7% 24031
E 3,916 2,480 6,610 2,666
263,571
133,200 0,505 8,9% 26756
F 3,389 3,175 6,440 2,028 168,714 197,239 1,169 1,7% 21489
Figure 3: Repository analysis results of six investigated student projects, showing benchmark score as well as number of code
commits per day and the variation of commits over weekdays as well as the percentage of commits on weekends.
0
5
10
15
20
25
30
35
40
45
Day 1
Day 11
Day 21
Day 31
Day 41
Day 51
Day 61
Day 71
Day 81
Day 91
Day 101
Day 111
Day 121
Day 131
Day 141
Day 151
Day 161
Day 171
Day 181
Day 191
Day 201
Day 211
Day 221
Day 231
Day 241
Day 251
Day 261
Day 271
Day 281
Day 291
Day 301
Day 311
Day 321
Projet A
0
5
10
15
20
25
30
35
40
45
Day 1
Day 12
Day 23
Day 34
Day 45
Day 56
Day 67
Day 78
Day 89
Day 100
Day 111
Day 122
Day 133
Day 144
Day 155
Day 166
Day 177
Day 188
Day 199
Day 210
Day 221
Day 232
Day 243
Day 254
Day 265
Day 276
Day 287
Day 298
Day 309
Day 320
Day 331
Day 342
Day 353
Day 364
Project F
Figure 4: Comparison of commits between projects with best (A) and worst (F) benchmark score and the number of commits
per day, commits on weekdays and percentage of commits on weekends as well as lines of code. Additionally standard
deviation and variation coefficient are provided.
This indicates that with larger team size students have
difficulties coordinating and communicating, which
may lead to less strict adherence to a common archi-
tecture and to software erosion.
The main results of the researcher questionnaire
show that self-assessed technical expertise (r = 0, 74)
and domain expertise (r = 0, 78) correlate with bench-
mark score, with reusability correlating very strongly
with technical competence (r = 0, 96). The self-
assessed quality of coaching correlates with bench-
mark score as well, but less (r = 0, 64).
The researchers assessment of source code qual-
ity (r = 0, 56) shows a medium correlation, the as-
sessment of maintainability (r = 0, 13) however does
not. Comparing researcher assessments of distribu-
tion of workload between students with actual com-
mits, which is not accurate, suggests that researchers
do not have a complete view of the happenings in their
projects, basing their assessments more on meetings
and interactions than of a survey of source code.
Other factors surveyed from the researchers which
do not correlate which benchmark score are per-
ceived project complexity, project success, working
atmosphere in the student team and differences be-
tween student capabilities within the team. Interest-
ingly, scheduling of dedicated refactoring sprints did
also not correlate, perhaps because refactoring sprints
were only performed when coaches already noted a
problem or because the refactoring sprint was not
properly executed.
Whether cutting edge or proven software libraries
were used had no impact on maintainability, how-
ever a higher use of third-party libraries correlated
with benchmark score (r = 0, 78), especially regard-
ing testability (r = 0, 90).
5 RECOMMENDATIONS
In this section, we discuss the results of the anal-
ysis and derive recommendations for future student
projects based on the results and questionnaires in the
areas where this appears most promising.
Aim for an Even Distribution of Workload.
The analysis showed projects distributing their work
evenly throughout the project time, sprint and weeks
do perform better. In previous projects, coaches urged
students to have a common co-working day to ease
communication. However, the findings might indi-
cate that only working in a team room might not be
sufficient. In future projects, students should be en-
couraged to meet and discuss topics like architecture,
interfaces and integration, but also work alone or in
smaller teams, strengthening confidence and compe-
tence. Regarding the distribution amongst the project
time, coaches should look closer at the work habits
of the team, discouraging deadline-driven frequent
check-ins of code.
Limit Number of Participants. A high number
of participants resulted in a worse benchmark score
and worse software architecture. From the coaches’
perspective, large groups tend to self-separate in
Assessing Software Quality of Agile Student Projects by Data-mining Software Repositories
249
0
100
200
300
400
500
600
Monday Tuesday Wednesday Thursday Friday Saturday Sunday
Project A
0
100
200
300
400
500
600
Monday Tuesday Wednesday Thursday Friday Saturday Sunday
Project F
Figure 5: Comparison of commits per weekday between projects with best (A) and worst (F) benchmark score.
smaller teams, making establishing team spirit, co-
ordinating and integrating software components, and
leading the team as a Scrum master harder and more
frustrating for students. In the future, teams should be
sized between six and nine students as recommended
in Scrum (Schwaber and Sutherland, 2011).
High Technical and Domain Expertise of Re-
searchers. As the survey has shown, the most impor-
tant predictor on researcher side is expertise and com-
mitment. On the long run, being able to communicate
project vision and requirements to students effectively
as well as supporting them in making software design
decisions is crucial for students to learn and deliver
a quality software product. However, these questions
would need additional research.
Take into Account Code as Well. High coaching
quality was a predictor of success. Being available
for students questions, coaching the student Scrum
master, supporting meetings etc. help the student
team self-organize and succeed. However, compar-
ing the survey to the analysis results has shown that
researchers do not have a full understanding of the
inner workings of their student projects. While full
transparency is desirable for neither students nor re-
searchers, coaches should watch source code qual-
ity more carefully. Currently, students present the
functional prototypes each month in sprint reviews,
while in sprint planning the next stories and major
architectural decisions are discussed. Code reviews
are performed less regularly, depending on the re-
searchers’ expertise and schedule, as they are very
time-consuming. The tool developed in this work
simplifies assessing code quality for taking additional
measures.
6 CONCLUSION AND OUTLOOK
In this work, we described an analysis of student soft-
ware projects by data-mining software repositories,
taking source code and commit history into account
to calculate a benchmark of software maintainability.
Comparing the findings to an assessment of projects
by coaches, we identified success factors for stu-
dent projects and derived recommendations for future
projects. Limitations include the number of projects
(being 6) as well as the timespan after the project end.
While this work yielded actionable insights to im-
prove student software projects, further applications
of the developed analysis methodology are manifold.
Now that an automated analysis tool is available,
the benchmark can be repeated easily therefore al-
lowing to quickly assess software quality in student
projects. It is possible to perform the analysis for
each project milestone (e.g. after third sprint) using
the code repositories. This data allows benchmarking
a project in progress, enabling the students and re-
searchers to gauge how they stand in comparison and
enabling them to course correct if necessary.
As this analysis was performed after the students
have completed their projects (some for many years),
in the future it could be interesting to provide a ques-
tionnaire to students after grading, letting them assess
their own efforts, project complexity, etc. similarly to
how the researchers did.
Some factors (like distribution of work over week-
days and commits of team members) might not be rel-
evant outside of the student project setting, others are
relevant for many settings. However, to perform the
benchmark, a variety of comparable software prod-
ucts needs to be available. In student projects, com-
parability is sufficient, as the same conditions, like
programming language, apply. Even more compa-
rability is given in a different setting: before a stu-
dent project, students have to complete a course, in
which many teams of three students implement the
same software. The best resulting software is chosen
for productive use. Due to the large amount of teams
and the high comparability of source code, investi-
gating differences in maintainability and success fac-
tors could be an interesting topic for future research
as well as an interesting source of feedback for the
CSEDU 2019 - 11th International Conference on Computer Supported Education
250

students.
Recently, the curriculum for student projects has
changed, mandating a fixed team size and shorten-
ing the projects to one semester while keeping the
same workload. According to the benchmark shown
in this work, the planned higher focus on student
projects combined with lessening other obligations
during project execution helps students to distribute
their workload more evenly, while reducing the team
size improves communication and coordination. In
future work, we would like to investigate the impact
of these changes using our analysis method.
ACKNOWLEDGEMENTS
The authors would like to thank all student software
project participants at Fraunhofer IAO and all re-
searchers who answered questionnaires and the stu-
dents for their software project work.
REFERENCES
Ahtee, T. (2003). Inspections and historical data in teach-
ing software engineering project course. In Software
Engineering Education and Training, 2003.(CSEE&T
2003). Proceedings. 16th Conference on, pages 288–
297. IEEE.
Briand, L. C., Daly, J. W., and Wust, J. K. (1999). A uni-
fied framework for coupling measurement in object-
oriented systems. IEEE Transactions on software En-
gineering, 25(1):91–121.
Bruntink, M. and Van Deursen, A. (2004). Predicting class
testability using object-oriented metrics. In Fourth
IEEE International Workshop on Source Code Anal-
ysis and Manipulation, pages 136–145. IEEE.
Caldiera, V. and Rombach, H. D. (1994). The goal question
metric approach. Encyclopedia of software engineer-
ing, 2:528–532.
Chidamber, S. R., Darcy, D. P., and Kemerer, C. F. (1998).
Managerial use of metrics for object-oriented soft-
ware: An exploratory analysis. IEEE Transactions on
software Engineering, 24(8):629–639.
Chidamber, S. R. and Kemerer, C. F. (1994). A metrics
suite for object oriented design. IEEE Transactions
on software engineering, 20(6):476–493.
Company, G. E., McCall, J. A., Richards, P. K., and Walters,
G. F. (1977). Factors in software quality. Information
Systems Programs, General Electric Company.
Conway, M. E. (1968). How do committees invent. Data-
mation, 14(4):28–31.
Deissenboeck, F., Juergens, E., Lochmann, K., and Wagner,
S. (2009). Software quality models: Purposes, usage
scenarios and requirements. In WOSQ’09., pages 9–
14. IEEE.
e Abreu, F. B. and Melo, W. (1996). Evaluating the impact
of object-oriented design on software quality. In Soft-
ware Metrics Symposium, 1996., Proceedings of the
3rd International, pages 90–99. IEEE.
Etzkorn, L. H., Hughes, W. E., and Davis, C. G. (2001).
Automated reusability quality analysis of oo legacy
software. Information and Software Technology,
43(5):295–308.
FrontEndART Ltd. (2018). SourceMeter - Free-to-use, Ad-
vanced Source Code Analysis Suite. https://www.
sourcemeter.com/.
Hampp, T. (2006). Quantitative Analyse studentischer Pro-
jekte. Softwaretechnik-Trends, 26(1).
Harrison, R., Counsell, S., and Nithi, R. (2000). Experi-
mental assessment of the effect of inheritance on the
maintainability of object-oriented systems. Journal of
Systems and Software, 52(2):173–179.
Hoffmann, D. W. (2013). Software-Qualit
¨
at. Springer-
Verlag.
ISO 25010 (2011). Systems and software engineering
– Systems and software Quality Requirements and
Evaluation (SQuaRE) – System and software quality
models. Norm ISO/IEC 25010:2011, International Or-
ganization for Standardization, Genf, CH.
ISO 9126 (2001). Software engineering – Product quality –
Part 1: Quality model. Norm ISO/IEC 9126-1:2001,
International Organization for Standardization, Genf,
CH.
Li, W. and Henry, S. (1993). Object-oriented metrics that
predict maintainability. Journal of systems and soft-
ware, 23(2):111–122.
McCabe, T. J. (1976). A complexity measure. IEEE Trans-
actions on software Engineering, (4):308–320.
Meyer, B. (1988). Object-oriented software construction,
volume 2. Prentice hall New York.
Mordal-Manet, K., Balmas, F., Denier, S., Ducasse, S.,
Wertz, H., Laval, J., Bellingard, F., and Vaillergues,
P. (2009). The squale model—a practice-based indus-
trial quality model. In Software Maintenance, 2009.
ICSM 2009. IEEE International Conference on, pages
531–534. IEEE.
Ostberg, J.-P. and Wagner, S. (2014). On automatically col-
lectable metrics for software maintainability evalua-
tion. In Software Measurement and the International
Conference on Software Process and Product Mea-
surement (IWSM-MENSURA), 2014 Joint Conference
of the International Workshop on, pages 32–37. IEEE.
Poncin, W., Serebrenik, A., and van den Brand, M. (2011).
Mining student capstone projects with frasr and prom.
In ACM international conference companion on Ob-
ject oriented programming systems languages and ap-
plications companion, pages 87–96. ACM.
Schwaber, K. and Sutherland, J. (2011). The scrum guide.
Scrum Alliance, 21.
Wagner, S., Lochmann, K., Heinemann, L., Kl
¨
as, M., Tren-
dowicz, A., Pl
¨
osch, R., Seidl, A., Goeb, A., and Streit,
J. (2012). The quamoco product quality modelling and
assessment approach. In Proceedings of the 34th in-
ternational conference on software engineering, pages
1133–1142. IEEE Press.
Zuse, H. (1993). Criteria for program comprehension de-
rived from software complexity metrics. In Program
Comprehension, 1993. Proceedings., IEEE Second
Workshop on, pages 8–16. IEEE.
Assessing Software Quality of Agile Student Projects by Data-mining Software Repositories
251
