
Behavioural Data Modeling: A Case Study in IoT
Jiri Petnik
1
, Lenka Lhotska
2
, Jaromir Dolezal
2
and Jindrich Adolf
2
1
Faculty of Information Technology, Czech Technical University in Prague, Th
´
akurova 9, 160 00 Prague 6, Czech Republic
2
Czech Institute of Informatics, Robotics, and Cybernetics, Czech Technical University in Prague, Jugosl
´
avsk
´
ych
partyzanu 1580/3, 160 00 Prague 6, Czech Republic
Keywords:
Behaviour Informatics, Behaviour, Sensor, Topology, Internet of Things, Smart Home, Elderly Care.
Abstract:
Modeling and analysis of behaviour by using data extracted from Internet of Things (IoT) sensors is an open
area. We take Behaviour Informatics (BI) as a formal representation into account and describe the case study
of the apartment monitored by IoT sensors. The case study targets persons who live home alone (e.g., elderly
people) without assistants (nurses), or any roommates. We present the apartment as a directed multigraph and
propose the model to deal with the conversion of transactional data coming from IoT sensors into behavioural
feature space represented by behavioural vectors. Further, the article describes a few use cases which can
occur in the apartment with installed sensors and explains how behavioural vectors are created. Last but not
least, we present the high-level overview of the complex system for detection and evaluation of behaviour
identified from data of IoT sensors.
1 INTRODUCTION
European Union countries are facing unprecedented
and extraordinary challenges linked to the progres-
sive aging of their population. Research is fo-
cused on novel medical solutions on one side and on
technologies that might support independence, self-
management of elderly persons (those living alone
in particular) on the other side. In addition, these
technologies allow long-term monitoring of physio-
logical parameters and changes in behaviour. One of
the enabling technologies in this area is the Internet
of Things (IoT). The IoT as a paradigm deals with
the connection of physical devices, vehicles, build-
ings, and other items – embedded with electronics,
software, sensors, actuators, and network connectiv-
ity that enable these objects to collect and exchange
data. The collected data represent different events,
phenomena, etc. The most frequently analyzed data
are physiological parameters, for example, heart ac-
tivity (heart rate, electrocardiogram), breathing rate.
They are represented as time series derived from mea-
sured analog signals. Besides this kind of data, it is
currently possible to acquire data from sensors placed
in buildings, apartments. Usually, this data has the
binary form (yes/no, logical 0/logical 1). A single
item does not provide information. To be able to in-
terpret a sequence of data from more sensors placed
in the rooms it is necessary to know the topology of
the space, types of sensors, possible actions, etc. It is
evident that these items cannot be represented in the
same form as physiological signals. We found a for-
malism that enables efficient representation and ma-
nipulation of data – Behaviour Informatics (BI).
The paper is structured as follows. Section 2 de-
scribes the basic features of BI and defines behaviour
model, vector and sequence. Section 3 presents
a case study, describes the apartment as a directed
multigraph, and proposes the model how to convert
transactional data coming from IoT sensors into be-
havioural feature space represented by behavioural
vectors. In Section 4, illustrative use cases are shown.
Section 5 discusses the proposed model and its use
in a complex system for detection of behaviour. Sec-
tion 6 concludes the paper.
2 BEHAVIOUR INFORMATICS
One of the critical IoT application within the smart
healthcare area is called behavioural detection, be-
havioural analysis, or BI (Sheriff et al., 2015). BI can
be used for initial problem description and formalism.
Petnik, J., Lhotska, L., Dolezal, J. and Adolf, J.
Behavioural Data Modeling: A Case Study in IoT.
DOI: 10.5220/0007691902590264
In Proceedings of the 12th International Joint Conference on Biomedical Engineering Systems and Technologies (BIOSTEC 2019), pages 259-264
ISBN: 978-989-758-353-7
Copyright
c
2019 by SCITEPRESS – Science and Technology Publications, Lda. All rights reserved
259

2.1 Definition
BI is a scientific field which aims to develop method-
ologies, techniques and practical tools for represent-
ing, modeling, analyzing, understanding and/or utiliz-
ing symbolic and/or mapped behaviour, behavioural
interaction and networking, behavioural patterns,
behavioural impacts, the formation of behaviour-
oriented groups and collective intelligence, and be-
havioural intelligence emergence (Cao and Yu, 2009).
Within healthcare, the IoT system with the ana-
lytical layer may help specialists to detect severe ill-
nesses at their early stages and subsequently prevent
the loss of life (Ahmed et al., 2017). Nowadays, we
use several IoT devices to monitor the human body.
The wearables are employed for direct monitoring;
while the sensors installed in the ambient environ-
ment monitor the human body indirectly. In combi-
nation with clinical data, all of these can be used to
model the particular behaviour of specific individuals
or precision cohorts.
2.2 Abstract Behaviour Model
A behaviour B is described as a four-ingredient tu-
ple (Cao, 2013):
B = (E , O, C , R) (1)
It indicates:
• Actor E =
h
S E, OE
i
is the entity that issues a be-
haviour (subject, S E ) or on which a behaviour is
imposed (object, OE ).
• Operation O =
h
OA, S A
i
is what an actor con-
ducts in order to achieve certain goals; both objec-
tive (OA ) and subjective (S A) attributes are asso-
ciated with an operation. Objective attribute may
include time, place, status, and restraint; while
subjective aspects may refer to action and its ac-
tor’s belief and goal of the behaviour, and the be-
haviour impact on business.
• Context C is the environment in which a be-
haviour takes place.
• Relationship R =
h
θ(·), η(·)
i
is a tuple which re-
veals complex interactions within an actor’s be-
haviours (namely intra-coupled behaviours, rep-
resented by function θ(·)) and that between mul-
tiple behaviours of different actors (inter-coupled
behaviours by relationship function η(·)).
2.3 Behaviour Vector
Behaviour can also be represented as a behavioural
vector
−→
γ which consists of behavioural attributes
(basic properties) including social and organizational
factors. When deploying this abstract model into dif-
ferent domains, some attributes and properties may
not be present, and thus a simplified behavioural
model
−→
γ
0
can be defined, e.g., as follows (Cao, 2010):
−→
γ
0
= (s, o, a, f , t) (2)
It indicates that a behavioural subject (s) conducts an
action (a) on an object (o) at a time (t) which leads to
a certain impact ( f ).
2.4 Behaviour Sequence
Further, a behaviour sequence Γ
0
of an actor can be
represented in terms of a vector sequence
−→
Γ
0
, which
consists of the behaviour instances represented in vec-
tors (Cao, 2010):
−→
Γ
0
=
n
−→
γ
0
1
,
−→
γ
0
2
, ...,
−→
γ
0
n
o
(3)
3 CASE STUDY
Basic task of BI is the preparation of behavioural
data. Usually, we deal with transactional data which
are not relevant for further behavioural analysis, and
thus a data conversion from transactional space to be-
havioural feature space is necessary (Cao, 2010). In
the behavioural feature space, behavioural elements
are presented in behavioural itemsets.
The movement of a person in the environment of
his/her apartment can be considered as one of the pri-
mary activities, which can be monitored. It is evident
that possible movement is given and constrained at the
same time by the actual structure of the apartment, its
topology. The topology clearly defines the organiza-
tion of individual rooms and mutual interconnections.
We can differentiate the movement either within the
particular room or movement (transition) between the
rooms.
Assuming we can detect the movement itself,
we can further infer the activity of the individual –
whether he or she is active during the day, or rather
stays in a single room, whether he or she has some
problems with sleeping, how often he or she visits
the restroom which can inform us about some urinary
problems, etc.
This case study targets persons who live home
alone (e.g., elderly persons), without assistants
(nurses), or any roommates. Thus we consider a sin-
gle actor model. The movement is detected in an indi-
rect way by using sensors, so we talk about so-called
BIOSIGNALS 2019 - 12th International Conference on Bio-inspired Systems and Signal Processing
260
Mapped behaviour. The main focus is to detect and
be able to describe transitions between each room.
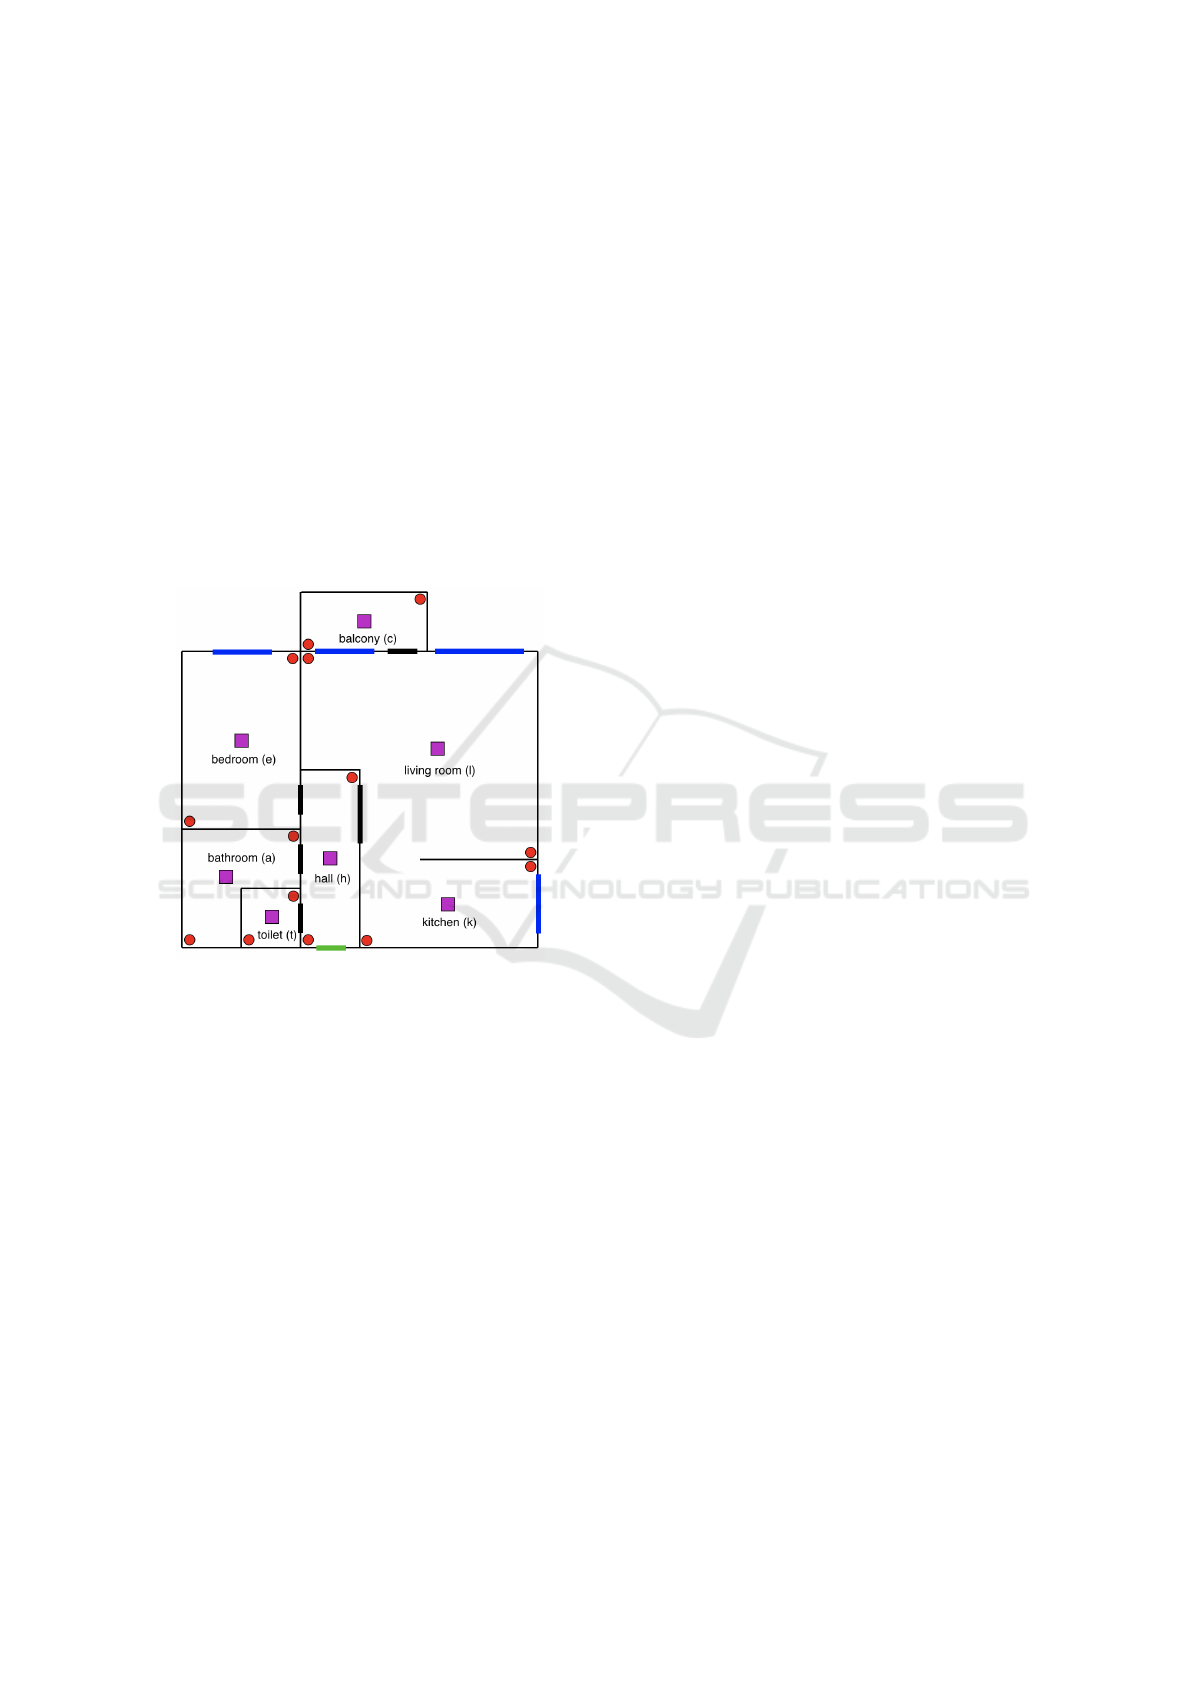
3.1 Floor Plan and Sensors Placement
The apartment floor plan is depicted in Figure 1. This
is a common apartment with living room, kitchen,
bedroom, bathroom, and toilet. The central part is
formed by the main hall which interconnects most of
the rooms together. The unfinished wall partially sep-
arates the space of the living room and the kitchen.
The main entrance door is marked in green. The rest
of the doors are marked in bold black (including the
door to the balcony). Windows are highlighted with
blue. For further description, each room is labeled
with a letter mentioned in parenthesis.
Figure 1: The floor plan of the apartment with sensors (PIR
sensors as red dots, Grid-EYE sensors as purple squares,
magnetic sensors on all windows and doors are not high-
lighted). Windows are marked in blue, the main door in
green, the rest of the doors in bold black.
The selection and placement of the sensors is
based on the study and the experimental verification
how to deal with its data as discussed in (Lhotska
et al., 2018). We propose to use:
• Passive Infrared (PIR) Sensor – is a standard mo-
tion detection sensor used in security technology
solutions. Since it works in an infrared portion of
the spectrum, it operates reliably during both day
and night. This sensor has two possible states at
its output; logic 0 if it does not detect movement,
or logic 1.
• Grid-EYE Infrared Array Sensor – is the sensor
made by Panasonic. The output is an 8 x 8 matrix
of temperatures of the scanned area. The built-
in lens includes a 60-degree viewing angle which
gives us, assuming ceiling height to be 3m, a de-
tection area about (3.48 x 3.48) m.
• Magnetic Sensor – consists of two non-connected
parts. The first part which contains a magnet is
usually placed on movable parts (doors or win-
dows). The second part is formed by a circuit with
a switch that is turned on and off by the magnetic
field of the first part.
To detect a simple movement inside a room or
translation between rooms, PIR sensors with the com-
bination of magnetic sensors on the doors should be
sufficient. In case we want to refine position within
the apartment, the use of Grid-EYE sensor is pro-
posed. Since the Grid-EYE sensor provides com-
plex information about temperature footprint, this can
also be used as a confirmation that the motion activ-
ity was performed by a living person and, e.g., not by
a robotic vacuum cleaner which is cleaning the apart-
ment.
To collect data from the sensors a Programmable
Logic Controller (PLC) is used which fulfills regular
data acquisition (Lhotska et al., 2018). The sensors
are connected via a wired bus or wireless bus. In an
ideal case, the wired infrastructure for connecting the
sensors is built during the construction of the apart-
ment. Another option is to implement the system with
the use of the IoT platform (Petnik and Vanus, 2018).
In any case, we must deal with the data which needs to
be processed, evaluated, and put into context. A mix
of different sensors and their data can enhance final
accuracy.
The algorithms and approaches used for data pro-
cessing and evaluation depend on the chosen data ac-
quisition method. It can be either regular reading of
all sensors at once or event-driven approach where
sensors provide data independently to each other. The
comparison of possible approaches is out of the scope
of this article, and the topic can be a subject of subse-
quent research.
Further sections deal with the formal description
of how a structural arrangement of the apartment can
influence and support the acquisition of behavioural
data.
3.2 Topology
The apartment can be represented as a directed multi-
graph:
G = (V, E, f ) (4)
which consists of a set V of vertices (or nodes), a set
E of edges, and a function f : E → V × V mapping
each edge with its incident vertices. The orientation
Behavioural Data Modeling: A Case Study in IoT
261

of edges is preserved by order of nodes in the map
function f .
Let V be the unification of three sets as follows:
R ∪ EV ∪UV = V (5)
where R is a set of vertices which represent rooms
(e.g., living room, kitchen, bedroom), EV is a set of
virtual vertices which represent areas directly con-
nected to natural entrances of the apartment (e.g.,
shared hall, garden), and UV is a set of virtual vertices
which represent areas directly connected to possi-
ble but non-standard entrances of the apartment (e.g.,
space outside the window).
Let E be the unification of two sets as follows:
DE ∪W E = E (6)
where DE is a set of oriented paths through standard
building holes (e.g., doors, gateways, some logical ar-
rangement of two spaces shared in one room – living
room with shared kitchen), and WE is a set of ori-
ented paths through non-standard entrances (usually
windows).
Map function f can be represented by unsymmet-
rical vertex-edge incidence matrix of a graph G, de-
noted VE, which is determined by the incidences of
vertices and edges in G. Let’s use +1 values for pos-
itively incident edges, the -1 values for negatively in-
cident edges, otherwise use 0 values.
3.2.1 Model Description
The apartment in Figure 1 can be represented by the
topology in Figure 2 where R = {a, c, e, h, k, l,t} is
the set of rooms with balcony. EV = {s} is the set
with the single item representing the shared hall of
an assisted living facility (ALF). Outer space behind
all the windows and balcony is described by the sin-
gle node as part of the UV = {o} set. The DE set
contains all standard transitions between rooms (see
black and green edges), while the W E set includes
unusual transitions via windows (see dashed edges
marked in blue).
Partial VE incidence matrix of the topology of the
apartment can be seen in Equation 7.
VE(G) =
h−a a−h ··· o−k k−o
a −1 1 ··· 0 0
c 0 0 ·· · 0 0
e 0 0 ·· · 0 0
h 1 −1 ··· 0 0
k 0 0 ··· −1 1
l 0 0 ·· · 0 0
t 0 0 ··· 0 0
s 0 0 ·· · 0 0
o 0 0 · ·· 1 −1
(7)
Figure 2: The topology of the apartment (virtual nodes are
dashed, entrance transition via the main door is marked in
green, unusual transition via windows are highlighted with
dashed blue).
3.3 Behavioural Walk
Let’s define a Behavioural walk BW as an alternation
sequence of nodes and edges:
BW = hv
0
, e
1
, v
1
. . . , v
n−1
, e
n
, v
n
i (8)
where (∀v; v ∈ V ) and (∀e; e ∈ E), which represents
sequential behavioural activity (movement) of a per-
son in an apartment from the room v
0
to the final room
v
n
. BW can be used for description of person’s trans-
lations between apartment rooms for the relevant pe-
riod (i.e., an hour, a day, a week or so). The length of
a BW is the number m of its edges.
m = len(BW ) (9)
3.4 From Behavioural Walk to
Behavioural Vector
The definition of BW is based on a walk from graph
theory and its usage here is suitable for the formaliza-
tion mapping of a topology describing the structure
of the apartment itself into the behavioural vector
−→
γ
which forms a cornerstone of further behavioural pat-
tern analyses.
Let
−→
γ
0
be a simplified behavioural vector:
−→
γ
0
= (s, a, p,t) (10)
It indicates that a behavioural subject s (a person) con-
ducts an action a (a translation between rooms) in
place p at a time t (a timestamp when the translation
BIOSIGNALS 2019 - 12th International Conference on Bio-inspired Systems and Signal Processing
262

was detected). The attribute p can be used to spec-
ify a room (both physical and virtual) from which the
translation was started, or, e.g., a floor of the house.
Except for the starting node v
0
of Behavioural
walk BW , all subsequent adjacent pairs of nodes and
edges (e
k−1
, v
k
) where 1 < k ≤ n can be converted by
the process B into the simplified manifestation of be-
haviour vector as described in Equation 10:
B : {e
k−1
, v
k
} →
−→
γ
i
0
(11)
The final Behaviour vector sequence
−→
Γ
0
:
−→
Γ
0
=
n
−→
γ
0
1
,
−→
γ
0
2
, ...,
−→
γ
0
m
o
(12)
where 0 < i ≤ m then contains m behaviour vectors
which is equal to the length of initial Behavioural
walk BW .
4 USE CASES
We assume that a person’s behaviour is partly pre-
dictable and that he or she does not try to disguise
his or her behaviour intentionally. Following sections
describe several typical situations which can occur
in the monitored apartment and presents how the be-
havioural vector sequence
−→
Γ
0
is gradually created. It
is obvious that
−→
Γ
0
can be created by batch process-
ing or by real-time processing when the system can
decide with a certain degree of confidence. For the
description, we present the real-time variant.
The person (identified by ‘s’) gets up of his bed
in the morning and is moving around the bedroom.
PIR sensors detect movement. The Grid-EYE sen-
sor confirms the living person is present. We do not
create any behaviour vector that would describe this
state. Right now, we understand movement in the
room as a standard situation which does not need to
be further detailed. The person is opening the bed-
room’s door, and the magnetic sensor warns that the
door is opened. The person is going through to the
hall. After a while, PIR sensors in the bedroom do
not detect any activity, nor does the Grid-EYE. On
the other hand, PIR sensors and the Grid-EYE sensor
in the hall detect the presence of the person. Taking
the description of defined Behavioural walk (BW ) in
mind, the person just moved from the starting node
v
0
to the node v
1
via the edge e
1
. This transition is
therefore described by simplified behavioural vector
−→
γ
1
0
= (‘s’, ‘eh’, ‘e’, t
1
) where ‘s’ stands for the per-
son, ‘eh’ is the identification of the movement ac-
tion from node e to h, and t
1
is the variable repre-
senting the timestamp when this behaviour was de-
tected. The system resets (updates, stores, etc.) its
internal state and understands the living person is
present in the hall. The person further visits the
toilet, has breakfast in the kitchen, and then leaves
the apartment. Without the same level of details,
the rest of these steps is identified by the following
behaviour vectors: (‘s’, ‘ht’, ‘h’,t
2
), (‘s’, ‘th’, ‘t’, t
3
),
(‘s’, ‘hl’, ‘h’, t
4
), (‘s’, ‘lk’, ‘l’, t
5
), (‘s’, ‘kl’, ‘k’, t
6
),
(‘s’, ‘lh’, ‘l’,t
7
), (‘s’, ‘h−exit’, ‘h’,t
8
). The last action
‘h −exit’ expresses that the person left the apartment.
By taking this situation as the initial state, we can
imagine that the person has a robotic vacuum cleaner
which starts to clean the apartment. Movement is de-
tected by PIR sensors, but the evidence of living per-
son is missing, so the activity is logged, but this has
no influence on the overall behaviour of the person.
Last but not least, let’s imagine an extreme situ-
ation. A living person has left the apartment, and
suddenly the magnetic sensor of the window in the
kitchen detects the window is being opened. This can
simply mean the sensor could have been broken and
it needs to be repaired, but in combination with the
PIR sensors and the Grid-EYE sensor in the kitchen,
the presence and movement of a living person are de-
tected. Since this is the transition from the node o to k
via the edge ‘ok’, this behaviour should be described
by a behaviour vector, but in this case, the system
is missing the context, and the activity is suspicious.
This behaviour is logged, but the identifier for an un-
known person is used. As can be seen in Figure 2,
this particular transition follows dashed line marked
in blue. This edge is a part of W E set which can be
understood as the set of edges with warnings. Any
of behaviour vectors which are created by following
these types of lines must be reported as unusual and
the operator of the system, as same as the user (if it is
relevant or possible), should be informed about these
events.
5 DISCUSSION
The proposed model deals with the conversion of
transactional data coming from IoT sensors into be-
havioural feature space represented by behavioural
vectors. These behavioural vectors can be used fur-
ther by the processes which try to identify behavioural
patterns. It is obvious that the topology of the mon-
itored apartment must be taken into account and it
forms an undivided part of the whole system. For
instance, the distribution of edges among two sep-
arated sets DE, and WE allows immediately distin-
guish which transition (detected behaviour) is natural
and which requires further actions (transitions follow-
ing edges which are as part of the latter set). Events
Behavioural Data Modeling: A Case Study in IoT
263
in the system must be created as reactions to these sit-
uations. As was presented in the previous Section 4,
the example can be a housebreaker entering the apart-
ment in case a resident is outside. In extreme case,
the similar situation can happen if a resident falls out
of the window, etc.
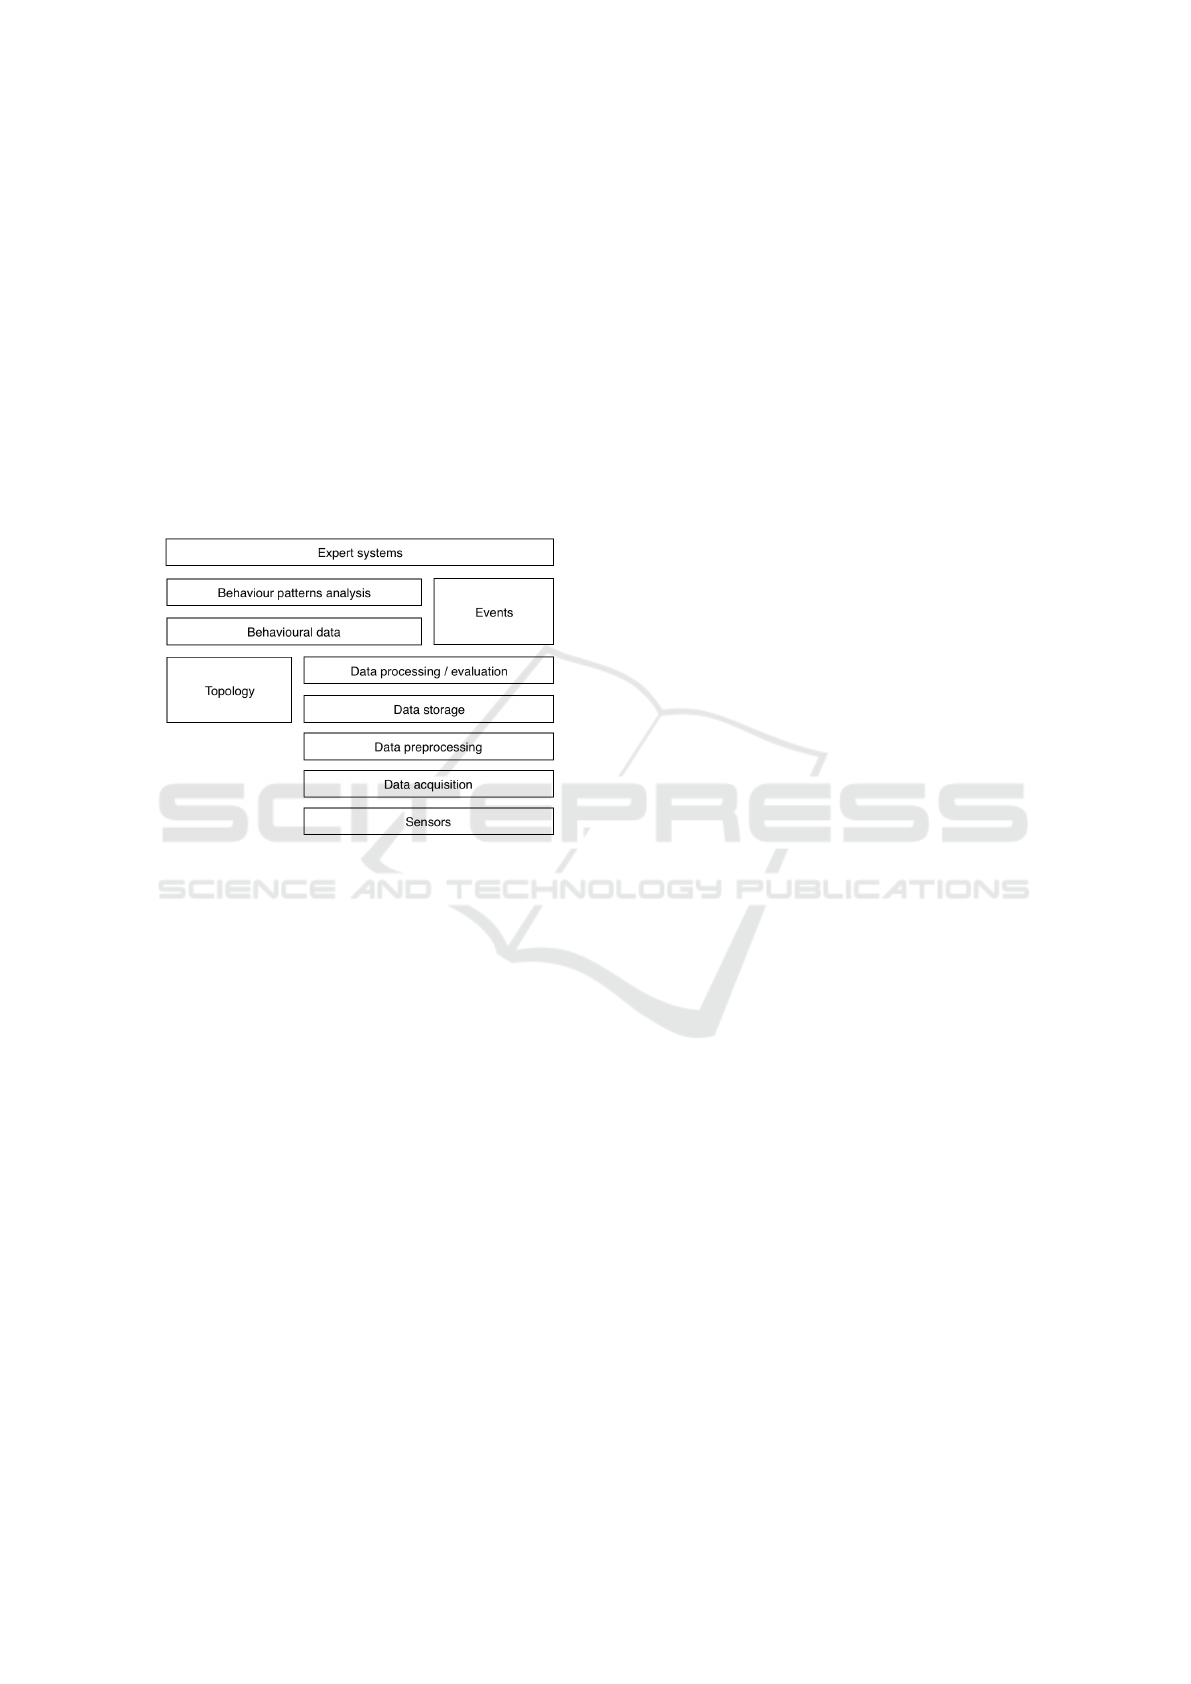
In Figure 3 we present an overview of the com-
plex system where the behavioural data are prepared
by using a combination of standard data processing /
evaluation and the topology of monitored apartment.
Both the events emitted by data processing layer and
findings of behaviour pattern analysis should be fur-
ther processed by an expert system which can decide
and act.
Figure 3: Proposal of the complex system for detection and
evaluation of behaviour from data of IoT sensors.
6 CONCLUSIONS
Technology may be advantageous when monitoring
persons’ health state and activities during everyday
life in their homes and at work continuously because
it helps adjust a personalized health state model, in
particular for a person with a chronic disease. We are
well aware of the fact that many elderly people prefer
not to use wearables, at least in their homes. There-
fore one of the aims of our presented study is to find
methods and tools for indirect monitoring based on
sensors installed in the ambient environment. Next
step is then to identify methods that can easily pro-
cess and evaluate data acquired from such sensors.
We showed the basic principles of BI that might be
utilized for transparent representation of the environ-
ment, sensors, data, and moving persons.
ACKNOWLEDGEMENTS
Research has been supported by the Czech Ministry
of Industry and Trade project No. FV-20696 Personal
health monitoring and assistive systems.
REFERENCES
Ahmed, E., Yaqoob, I., Hashem, I. A. T., Khan, I., Ahmed,
A. I. A., Imran, M., and Vasilakos, A. V. (2017). The
role of big data analytics in Internet of Things. Com-
puter Networks, 129:459 – 471. Special Issue on 5G
Wireless Networks for IoT and Body Sensors.
Cao, L. (2010). In-depth behavior understanding and use:
The behavior informatics approach. Information Sci-
ences, 180(17):3067 – 3085. Including Special Sec-
tion on Virtual Agent and Organization Modeling:
Theory and Applications.
Cao, L. (2013). Behavior Informatics and Computing. Ad-
vanced Analytics Institute, University of Technology
Sydney, Australia.
Cao, L. and Yu, P. (2009). Behavior Informatics: An Infor-
matics Perspective for Behavior Studies. IEEE Intel-
ligent Informatics Bulletin, 10:6–11.
Lhotska, L., Dolezal, J., Adolf, J., Potucek, J., Krizek, M.,
and Chbani, B. (2018). Z
´
av
ˇ
ere
ˇ
cn
´
a zpr
´
ava re
ˇ
ser
ˇ
se sen-
zor
˚
u a
ˇ
cidel -– project No. TRIO FV20696. [Unpub-
lished project report, CTU CIIRC Prague].
Petnik, J. and Vanus, J. (2018). Design of Smart Home
Implementation within IoT with Natural Language In-
terface. IFAC-PapersOnLine, 51(6):174 – 179. 15th
IFAC Conference on Programmable Devices and Em-
bedded Systems PDeS 2018.
Sheriff, C. I., Naqishbandi, T., and Geetha, A. (2015).
Healthcare informatics and analytics framework. In
2015 International Conference on Computer Commu-
nication and Informatics (ICCCI), pages 1–6.
BIOSIGNALS 2019 - 12th International Conference on Bio-inspired Systems and Signal Processing
264
