
This Music Reminds Me of a Movie, or Is It an Old Song?
An Interactive Audiovisual Journey to Find out, Explore and Play
Acácio Moreira and Teresa Chambel
LASIGE, Faculdade de Ciências, Universidade de Lisboa, Portugal
Keywords: Music, Movies, Versions, Covers and Standards, Time; Genres, Emotions, Mood, Popularity, Hyperlinking,
Video, Visualization, Graphics, Interactive Environments, Media Access, Synchronicity, Serendipity.
Abstract: Music and movies are major forms of entertainment with a very significant impact in our lives, and they
have been playing together since the early days of the moving image. Music history on its own goes back
till much earlier, and has been present in every known culture. It has also been common for artists to
perform and record music originally written and performed by other musicians, since ancient times. In this
paper, we present and evaluate As Music Goes By, an interactive web environment that allows users to
search, visualize and explore music and movies from complementary perspectives, along time. User
evaluation results were very encouraging in terms of perceived usefulness, usability and user experience.
Future work will lead us further in the aim for increased richness and flexibility, the chance to find
unexpected meaningful information, and the support to discover and experience music and movies that keep
entertaining, connecting and touching us.
1 INTRODUCTION
The importance and impact of entertainment has been
widely recognised (Zillmann and Vorderer, 2000),
and media has played an important role in providing
means and support for it. Music and movies, in
particular, are major forms of entertainment, and
they have been playing together since the early days
of the moving image,
amusing, relaxing, provoking
and inspiring us.
Music has been present in every known culture,
and
it is a ubiquitous companion to people's everyday
lives. People listen to music to regulate arousal and
mood,
to achieve self-awareness, and as an expression
of social relatedness (Reflectd, 2014; Schäfer et al.,
2013; Zillmann and Vorderer,
2000). Music is also
said (Buchanan, 2016) to provide the backdrop to
our lives, as we associate different tunes and sounds
with various events and landmarks. It is no wonder
that we treasure music so much and that it has been
created, performed, and recorded since technology
has allowed.
It
has also been common for artists to perform and
record music originally written and performed by
other musicians, since ancient times (Maehner, 2015).
New artists and bands often start versioning, or
covering, their favorite songs, making them their
own, on the journey to find their own musical
identity. It is also common for artists to imprint their
individual style to favorite songs, to revive songs’
popularity long after the original version, or even as
tributes. There are covers that are career-making or
career-breaking, one-hit wonders, and those that
become more popular than the original.
Music
has always played a significant role in mo-
vies, also seen as important sources of entertainment,
learning and inspiration, with significant emotional
impact (Chambel et al., 2011). Music was originally
used to enhance mood and aid narrative and meaning,
becoming an essential part of the movie itself (Inskip
et al., 2008). Music was written especially for the
movies, or consisted of well-known favourites from
classical and popular repertoires, gradually leading to
a creative industry and theories on how music works
with film.
In this paper, we present and evaluate As Music
Goes By, a web application we are designing and
developing
to provide users with an interactive envi-
ronment to search, visualize and explore music and
movies
from complementary perspectives, along time.
It contemplates the music in its different versions, the
artists,
and the movie soundtracks they belong to,
highlighting properties like popularity, genre and
emotional impact. We aim at increased richness and
Moreira, A. and Chambel, T.
This Music Reminds Me of a Movie, or Is It an Old Song? An Interactive Audiovisual Journey to Find out, Explore and Play.
DOI: 10.5220/0007692401450158
In Proceedings of the 14th International Joint Conference on Computer Vision, Imaging and Computer Graphics Theory and Applications (VISIGRAPP 2019), pages 145-158
ISBN: 978-989-758-354-4
Copyright
c
2019 by SCITEPRESS – Science and Technology Publications, Lda. All rights reserved
145

flexibility in media access, and base our contribution
on a reflection about the relevance and the support
that has been given to accessing music in versions
and movies along time. Section 2 makes a review of
related and previous work.
As Music Goes By and its
underlying design rationale are described in sections
3 and 4, while section 5 presents the user evaluation
that
was recently carried out. Section 6 draws con-
clusions and identifies perspectives for future work.
2 STATE OF THE ART
This section presents most relevant concepts and
developments in related and previous work in the
relevant areas of Music Information Retrieval &
Visualization, Music Versions, Music in Films, and
the Emotional Impact of Movies and Films.
Music Information Retrieval & Visualization
became a very relevant area when music digital
collections were becoming large. Langer’s survey
(Langer, 2010) identified motivations, common
ideas and techniques to solve main problems, and
presented examples. In spite of the lack of ”the”
best-working method, visualization usually relied on
music similarity, hierarchical structures, and tracks
often based on time-bars along the music; with
search methods aiming at Query-By-Example,
Query-By-Humming, Query-By-Rhythm, and Query
User Interfaces based on parameters or symbolic
representations. Musicmap(.info) aims to provide the
ultimate genealogy of popular music genres, based
on an interactive visualization along time, genre
relations, and textual descriptions, aiming at a
balance between comprehensibility, accuracy and
accessibility. The focus are the genres, in depth, not
particular songs or movies. Music Timeline (music-
timeline.appspot.com) is an interactive visualization
tool of artists and genres over the decades, centered
around an area chart. It uses aggregated data from
Google Play Music to show how artists and genres
have gained and dropped popularity. Users can
highlight key artists in each genre, read their stories,
and listen to the music on Google Play.
SecondHandSongs(.com) claims to be the largest
and
most accurate database (DB) of cover songs (refer
to Tab.1 for a definition of these concepts), It includes
information about who performed the originals and
cover or sample versions, songwriters, releases, popu-
larity, videos and web covers. Data is crossreferen-
ced
with other DBs, like Discogs, RateYourMusic,
Echonest,
Spotify, and iTunes. The web interface
allows to search by song and by artist. Results are
presented in lists that can be explored to watch
and
listen to the songs. Users can also participate in discus-
sions,
contribute to the DB, play quizzes, and compare
in a random selection a pair of original and cover song,
introducing a touch of surprise to the experience. It
involves
users in the DB updating, in spite of the work
in the area of audio processing for version identifica-
tion, like (Salamon et al., 2012) that compares the
use
of different musical representations to demons-
trate that: harmony remains the most reliable for
version identification, but in some cases melody and
bass line descriptions can improve performance. In
another perspective, Smule (.com) is about creating
social music experiences. It supports creating,
sharing, discovering, participating, and connecting
with people, around the world, making music and
often singing covers in duets. It then allows to
search and access all the covers of the same music.
Table 1: Key concepts for Music Versions.
Cover versions, cover songs, or simply covers, have
been a quite relevant part of music history (Maehner,
2015). Although technically sonatas and piano
concerts, originally from other artists, would also be
covers, they do not usually go by that name. The same
happening with Jazz standards: widely known by
listeners and musicians,
as an important part of their
musical repertoire. It is in pop music and even in
traditional folk music that the term cover is used more
often.
For the sake of consistency, we will adopt the terms
cover and original versions, independent of musical
genre. Note that the term version may refers to both
original and cover, but if a song is a version of another
one, it is not the original.
Sampled versions, also a relevant concept in this
context, refers to songs or pieces of music that take in a
portions or sample of another pre-existing music or
sound
recording, but they are usually considered
distinct from the original source(s), unlike cover
versions.
Inskip et al., (2010) examined and discussed the
classification of commercial popular music for use
in films. They analyzed the metadata used by
systems, choices for user queries, and music facets
derived from musicological literature on semiotic
analysis of popular music, finding that genre, subject
and mood are used widely, along some musical
facets, in some systems. Previously (Inskip et al.,
2008), they had discussed the use and matching of
music in films, advertising and TV programs,
focusing on communication and meaning of the
music, with the aim to inform and improve decision
making. Although final decision is partly intuitive
and determined by creative professionals, search by
GRAPP 2019 - 14th International Conference on Computer Graphics Theory and Applications
146

content and context was found important. The IMDb
(.com): Internet Movie Database, is probably the
most popular and complete online database of
information related to films, TV as a platform for
audiovisual content. It allows users to search for:
cast, production, characters, biographies, arguments,
etc. It includes movies soundtracks as lists, but not
to index the soundtracks in the movies, and trailers
can also be watched, not the entire movies. The
emotional dimension is also not contemplated.
Registered users can make contributions such as
comments, photos or content evaluations, where
they can express their opinions. Whatsong (what
song.com), since 2008, provides the official
soundtrack and list of songs, from movies and TV
shows, with scene descriptions. Can be searched by
artists, movies and shows, not songs. Content is
generated from admins and users, videos are from
YouTube, and audio samples from Spotify and
iTunes. More recently, Tunefind(.com) (TF) and
Sweet Soundtrack(.com) (SS) also find music in TV
shows and movies, by author or by shows and
movies, not by song. Results are presented in lists,
and for each movie or show, song can be accessed
from iTunes or Amazon. In addition, SS lists all the
songs in each movie, all the movies for each song,
and all the songs for each artist, allowing to browse
across movies that share the same songs or artists. In
TF, the information comes from professionals
(Music Supervisors), or may be submitted by users,
Tunefind community voting on accuracy. All of
them allow to search, sometimes play, but they
barely present visualizations for overviews and
comparison, and do not support music versions or
scene indexing in the movies. With video timelines
like those found in video players. On the other side
of the spectrum, richer approaches like Story Curves
(Kim et al., 2018) visualize nonlinear narratives of
movies by showing
the order in which events are told
comparing them to their actual chronological order.
Music
and movies are among the most used media
to improve emotional states. In (Chambel et al., 2013)
we present work related with accessing music based on
mood, as consumers, like www.rockola.fm. Rothera
et al. explored the creator’s perspective in Flutter, an
app using music to help those dealing with loss of
loved
ones, by expressing themselves in a safe,
positive environment, as described in (Stinson, 2015).
In (Oliveira et al., 2013) and (Bernardino et al., 2016)
we made a literature review of models of emotions,
emotional classification of movie content and their
impact on viewers, video access and visualization, and
eliciting and visualizing emotions. In summary, some
related work exists, but not so much allowing to
access movies based
on emotions. In our own work in
iFelt, we addressed movie classification and access
based on the emotions felt by the user. Movie
Clouds (Chambel et al., 2013) allows to access,
explore and watch movies based on their content,
mainly in audio, and subtitles, and with a focus on
emotions expressed in the subtitles, in the mood of
the music,
and felt by the users. As a follow-up (Jorge
et al., 2017) we enriched the design of interactive
spatiotemporal visualizations to enhance movie
browsing, and in Media4Wellbeing (Bernardino et
al., 2016) we are taking a step further to include
other media (also music) and the sense of wellbeing.
3 AS MUSIC G.B - CONCEPTS
AND DESIGN RATIONALE
As Music Goes By is being designed and developed
as an interactive web application to allow users to
search, visualize and explore
music and movies from
complementary perspectives that highlight music in
different versions, the artists, and the movie sound-
tracks they belong to. Relevant properties are highligh-
ted,
including popularity, genre and emotional impact.
It is possible to compare versions of same song, see
which songs or artists have more versions, find the ori-
ginal versions, performers and authors, see the mood
of the songs, and the movies and scenes they appear
in. At all times, the user can listen to and watch the
music clips, and access and watch the movie scenes
where they play. This section presents and overview
of main concepts, models and foundations in the
design rationale of As Music Goes By. Next section
will present more detailed options about its main
views or perspectives, allowing for the interactive
access to music, versions and movies along time.
3.1 Design Rationale
The quantity and complexity of the information pro-
duced in the most varied areas are increasing in recent
years
at an astonishing rate. Visualization not only
contributes to the visual interpretation of data, as it
helps to improve understanding, communication and
decision-making,
becoming a very useful tool to han-
dle
the complexity inherent to huge information sys-
tems.
Edward Tufte, considered one of the founders of
information
visualization, declared that graphical ex-
cellence consists of complex ideas communicated with
clarity, precision, and efficiency (Tufte, 2001). Ware
(2012) states that the visualization can be considered
a mapping process from information to images, the
This Music Reminds Me of a Movie, or Is It an Old Song? An Interactive Audiovisual Journey to Find out, Explore and Play
147

data is processed and its value is expressed in visual
representations. According to Shneiderman (1996),
there is a mantra for effective visualizations, which
can be defined in the following principle: “first
overview, zoom and filter, and details on request”.
This
principle is usually followed as a guideline
when building information visualization systems, and
was
also followed in our approach. In particular, we
combine Search Browsing, where users seek for well-
defined targets, with Exploratory Browsing, where
users query to discover a local neighborhood of interest
and browse to explore this area in detail, looking for
results they cannot fully specify but will recognize
(general-purpose browsing) or engage in discoveries
by accident exploration (serendipity browsing)
(Chen, 2010).
3.2 Music Genres and Colors
We defined 17 genres to aggregate from the Spotify
API subgenres: Classical, R&B and Soul, Electronic,
Blues, Adult Standards, Jazz, Easy Listening, World
Music, Folk, Country, Religious, Comedy, Movie
Scores & Musicals, Latin, Rock, Hip Hop, and Pop.
We used the list in (MGR-ref), and aggregated the
Ethnic and Regional music in World Music. Three
new genres were added: Adult Standards, because
several songs are associated with this genre even
though it does not belong to (MGR-ref), as well as
the Religious and Movie Scores & Musicals, quite
relevant in our context. In a UC Berkeley study
(Palmer et al., 2013), participants consistently
picked bright, vivid, warm colors to go with upbeat
music, and dark, dull, cool colors to match the more
somber pieces. According to Holm and Siirtola
(2012) color-genre mapping is not totally consistent,
probably due to cultural bias. We do not aim at
providing a definite or reference mapping, but to
adopt a consistent one that is aligned with previous
work and what is commonly accepted or familiar.
The genres in As Music Goes By were colored
according to the UC Berkeley study (Palmer et al.,
2013) and partially to (Holm and Siirtola, 2012),
resulting in a palette that goes from brown for
Classical, around the hue color to fuschia for Pop.
Two shades of each color are used for different
highlight levels, e.g. active / not active or selected /
not selected.
Text labels are also used to help genre
identification,
as illustrated in the Figures.
3.3 Model & Visualization of Emotions
We adopt Russell’s (1980) circumplex, or emotional
wheel, based on the valence (x-axis) and arousal (y-
axis)
bidimensional model for emotions. For a referen-
ce,
we present the user with 12 categorical emotions
around the circle, 3 in each quadrant (Fig.3b). These
emotions are based in (Russell, 1980), but slightly
adapted for a better match with the emotions and
moods more commonly found associated with music
(e.g. melancholic and calm at the bottom – both with
low energy, the former tending to negative,
and the
latter to positive).
The position of each song is determined by the
audio features of Valence (for valence) and Energy
(for arousal) defined and provided by the Spotify
API, and described as: Valence (0-1), the musical
positiveness conveyed: high valence sounds more
positive (happy, cheerful or euphoric) and low
valence sounds more negative (sad, depressed or
angry); and Energy (0-1), a perceptual measure of
intensity and activity: typically, energetic songs feel
fast,
loud, and noisy. Perceptual features contributing
to this attribute include dynamic range, perceived
loudness, timbre, onset rate, and general entropy.
4 AS MUSIC G.B - INTERACTIVE
VIEWS AND NAVIGATION
This section presents the main features of As Music
Goes By, highlighting aspects of interactive visualiza-
tion and navigation in the different views that are des-
cribed
in the subsections and illustrated in the figures.
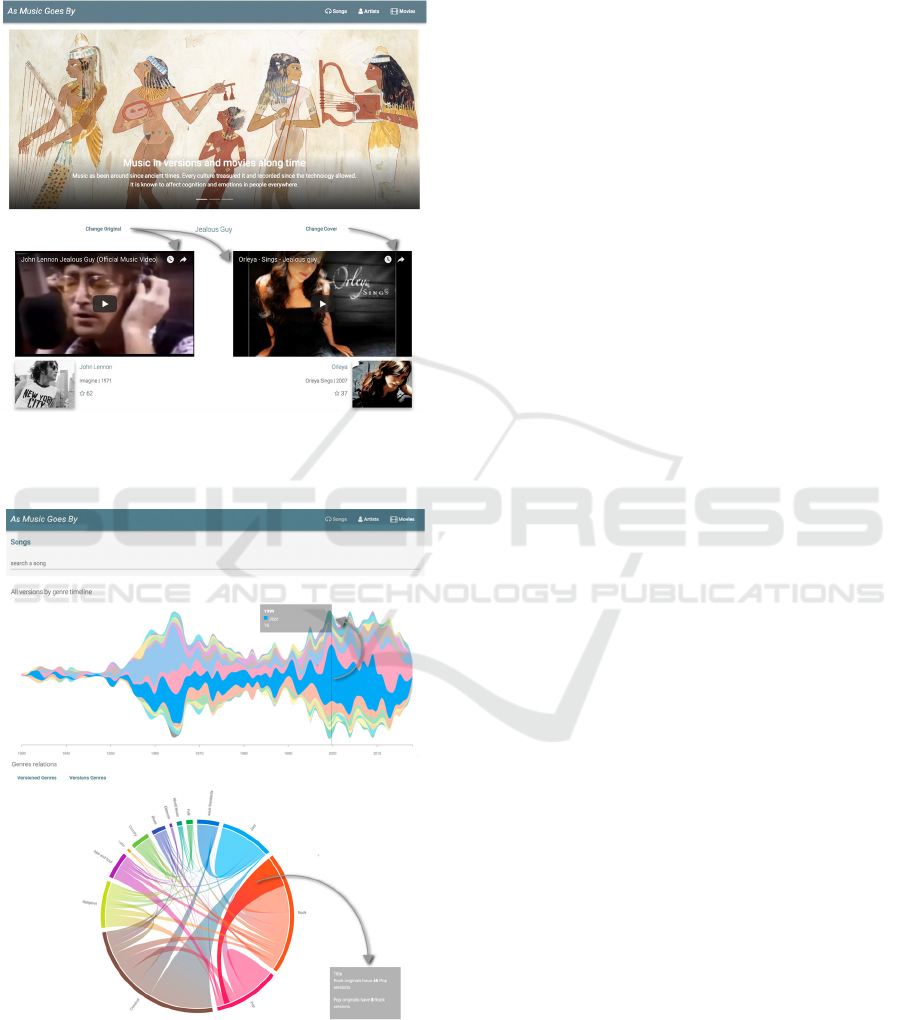
4.1 Homepage View
In the homepage (Fig.1) the users can view a brief
presentation of the motivation and goals of the
application, in 3 images shown in carousel, and a
view with a random video of an original and a
version that the user can watch to compare, and then
change to another random pair: original-version or
sameOriginal-anotherVersion. The objective of this
feature is to introduce the users to versions that they
may
not know, as a flavour of surprise and serendipity.
It
adds the flexibility to just change the cover, compa-
red to what SeconHand Songs offers, to change both
original-cover altogether.
In
Fig.1 the user was presented with the original
(from John Lennon in 1971) and a cover version
(from Orleya in 2007) of Jealous Guy. As an
interesting coincidence, the most popular version
ever of this song is a cover by Bryan Ferry from
1981 (an artist highlighted in a couple of examples
ahead), as a tribute to John Lennon (one of the most
popular musicians ever). When the users click on the
GRAPP 2019 - 14th International Conference on Computer Graphics Theory and Applications
148
Change Original or Change Cover, they’re up for
new discoveries. The menu at the top is always
present and allows users to navigate to the three
main views: Songs, Artists and Movies.
Figure 1: Homepage view. On Change Original, it changes
original and cover versions; on Change Cover, only cover
version is changed, same original. Always at random.
Figure 2: Songs view. On entry, it displays overview
visualizations. Version Genres Timeline as a streamgraph
(top); switch between Versioned or Versions genres chord
diagrams (bottom). More detailed information on over
(e.g. Rock originals have 46 Pop versions, at the bottom.
4.2 Songs View
In the Songs View, we are presented with overview
visualizations for a high level perception of the
evolution of the number of versions along time, and
the relations between genres and versions.
In
Fig.2,
a
streamgraph
view
is
shown
where
we
can
see
how
the
various
genres
have
evolved
along
time,
in
terms
of
the
number
of
versions. For example
the Adult Standards genre had a large number of
versions between 1950 and 1970 and thereafter has a
reduced expression. When hovering the cursor,
information about the number of versions
of the
genre is displayed in that year. Also on this view,
users
can see the relations between genres, in terms
of number of versions. To this purpose,
we
used
an
interactive
chord
diagram,
allowing the users to see
the relation from two perspectives: Versioned
Genres (originals) and Versions Genres (covers),
which the user can choose using a button. In Fig.2
(bottom) we can see that the most versioned genre is
Classical. On over, it is possible to see more detailed
information about that relation.
When users Search a song in the search field or
click a song name elsewhere in the application,
Smoke Gets in Your Eyes in this case, they navigate
to the Song view (Fig.3). This view has information
about the original version, always present, and tabs
for different perspectives and features of this
section, Timeline, Emotions, Movies and Compare.
The Timeline view (Fig.3a) represents all the
versions of that song by circles, having the size for
the popularity and the color for the genre.
Once the user clicks on a genre in the caption,
the versions in that genre are displayed in a list
below, with title and background in the genre color
(e.g. Adult Standards, with 24 versions, in blue).
When the user clicks on one song (e.g. cover by The
Platters), it opens a Player View with more details
about the song (title, artist, release date,
genre,
popularity and emotion) and a video that can be
played (Fig.3c). We chose to use non-overlapping
circles (bubbles, in bubble charts) to represent the
popularity and genre dimensions, because they can
represent songs as individuals points of data and, at
the same time, and it is possible to clearly perceive
both the amount and popularity of versions along
time, as well as their genres.
In the Emotions tab (Fig.3b), circles represent
each version in the emotional circumplex, their
position is based on valence and energy. We think
that this kind of visualization allows for a good
perception of the songs emotions, while keeping the
song’s circle representation. This also allows for a
This Music Reminds Me of a Movie, or Is It an Old Song? An Interactive Audiovisual Journey to Find out, Explore and Play
149
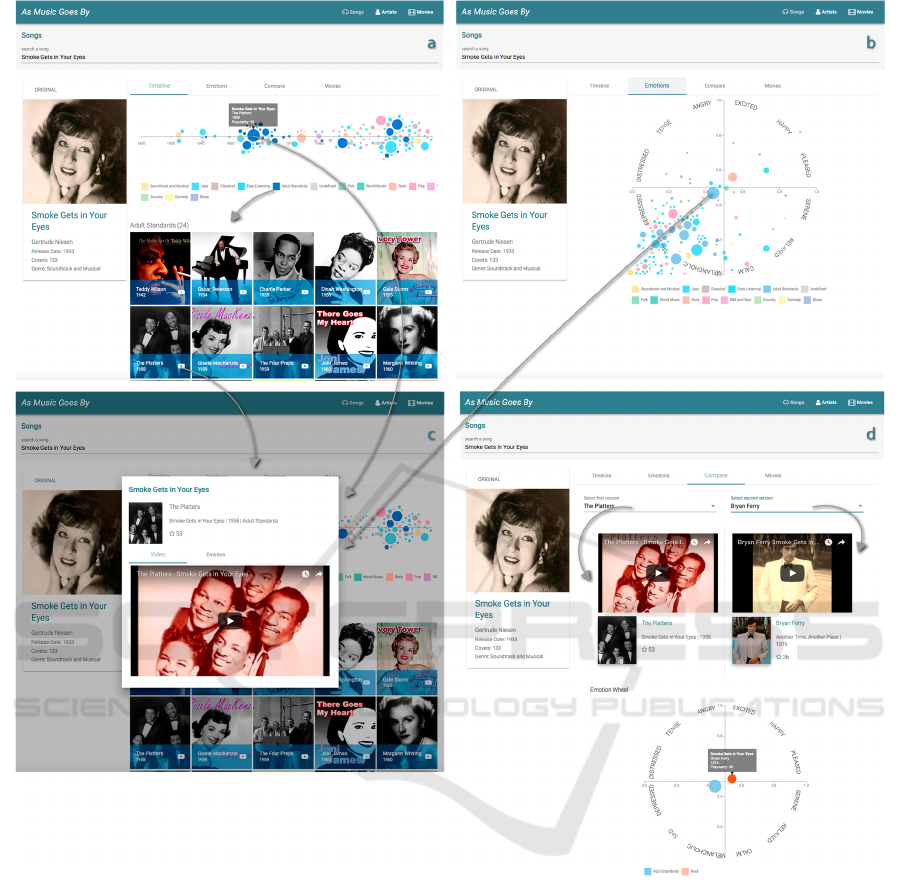
Figure 3: Song View. a) Versions Timeline: each version represented by a color circle along a timeline. Information on
over, access to video on click. Uses caption to filter by genre; b) Emotional perspective: versions distributed in emotion
wheel; c) Song Player view, appears in a dialog window, can be access through circle click or button click on YouTube
icon in list item (a): d) Compare versions: select 2 versions from dropdown lists to view video, info and emotions. Smoke
Gets in Your Eyes by Gertrude Niesen, The Platters and Bryan Ferry exemplified.
quick browsing and access (by clicking the circles)
to the songs from an emotional perspective. Again,
circle size used for popularity and color for genre.
The users can also Compare two versions
(Fig.3d) by selecting them in dropdown lists in the
Compare view. In the e.g. the current version of
Smoke Gets in Your Eyes is from The Platters,
1958, the most popular (60/100), in adult standards
genre, and it is now compared to Bryan Ferry’s
version, 1974, also very popular (45), in rock genre,
and a more positive emotion (higher valence). Both
can be played. An emotion wheel is presented with
the two compared versions, and there is a Movies
tab where users can see in which movies the
versions of this song have appeared.
4.3 Artists View
In the Artists View (Fig.4), overviews and search
are available. On the left side, the artist personal data
GRAPP 2019 - 14th International Conference on Computer Graphics Theory and Applications
150
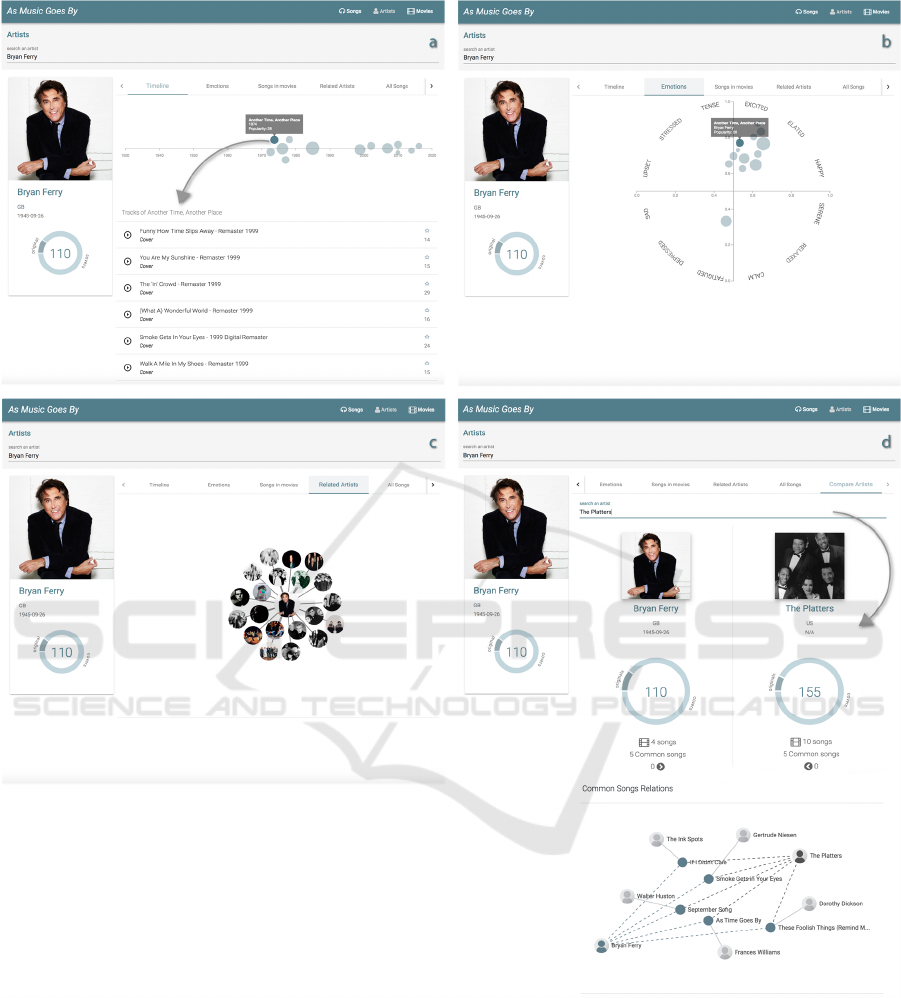
Figure 4: Artist View. a) Album Timeline, click on circle to show album tracks; b) Album Emotions; c) Related artists, on
click navigates to that artist view.; d) Compare, search an artist in search field to view comparison, in this case Bryan Ferry
vs The Platters. Displays info on both artists and Common Songs Relations graph, with cover versions made of each other,
and original versions from others artists that they both covered.
(photo,
name,
country,
birth),
nb.
of
covers
and
originals, with more details on over, is always
displayed.
In the Album tab (Fig.4a), a timeline is showing
albums released by this artist along time, with
popularity represented by size of the circles, and
below, a list of tracks for the selected/clicked album,
highlighting if it is a cover or an original version. In
Fig.4a) we can see the Another Time, Another Place
(1974) album highlighted and its list of tracks.
This Music Reminds Me of a Movie, or Is It an Old Song? An Interactive Audiovisual Journey to Find out, Explore and Play
151
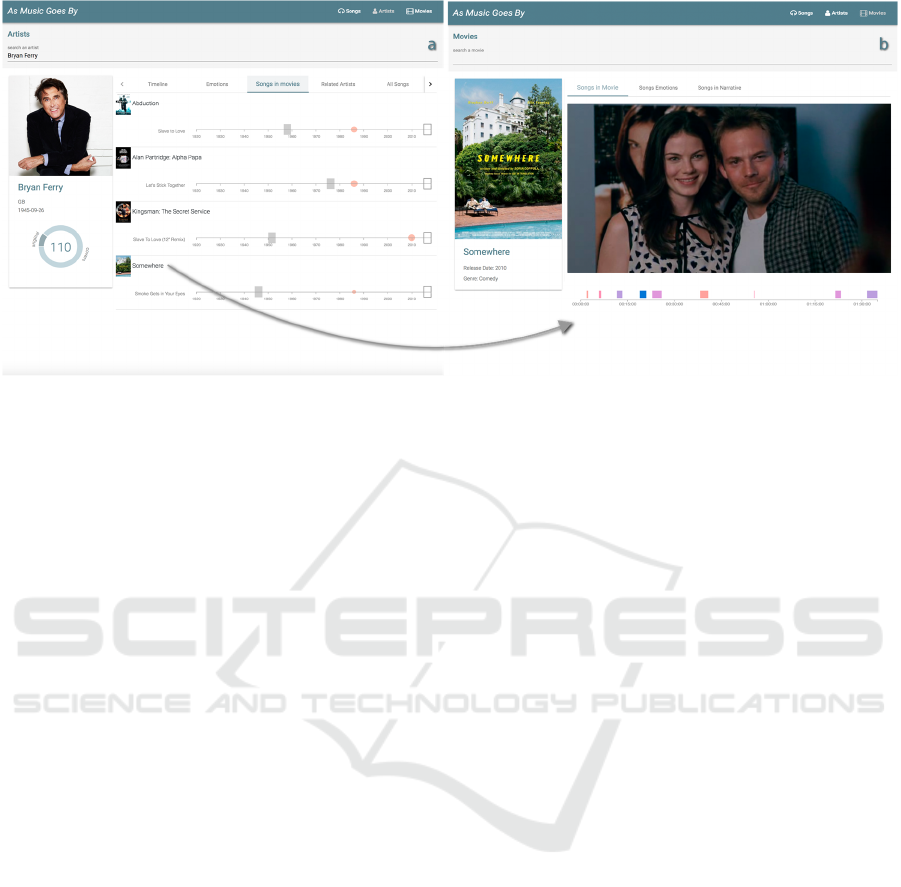
Figure 5: a) Artist Songs in Movies. Bryan Ferry songs that appeared in movies. Click in song name, navigates to song
view, and click In movie name navigates to the Movie view (b).
Fig.4b) shows a distribution of the albums in the
Emotion wheel. The emotion of each album is an
average of its tracks. The Related tab (Fig.4c),
displays a connected graph with images of the artists
related to the selected artist, in this case Bryan Ferry.
The related artists are fetched from the Spotify API.
In the Compare tab (Fig.4d), the user can
compare information about the current artist with
another one, and see how their work is related
through a connected graph highlighting cover
versions they have made of each other, and original
versions from others artists that they both covered.
Finally, in the Movies tab, a list of songs in
movies is available (Fig.5a). We are designing a
proof of concept view for each movie of the list,
where a timeline is representing the movie release
date (wireframe rectangle on the right), grey
rectangles represent times in the narrative of the
movie, and a colored circle represents the song
positioned in the timeline by release date. The user
can click both movie or song to access the views
related to each one (Fig.5b). In this case, movie
Somewhere was selected, featuring Bryan Ferry’s
cover of Smoke Gets in Your Eyes.
4.4 Movies View
This view allows users to present more detailed
information about a movie and its soundtrack, and
view the complete movie, from the start or indexed
by the songs on the soundtrack. In the Timeline tab,
the user can see the movie, its songs and a timeline
to access the movie at the time the song is playing.
Fig.6a) shows the movie Always, in the scene where
the selected song: Smoke Gets in Your Eyes from
The Platters is playing. The soundtrack features a list
of song titles, artists, popularity, and genre. It shows
the current music, with a different background color,
and this is synchronized with the timeline of the
movie (below the movie) and with the movie itself
when viewed (above). We assume the use within a
context in which the user has access to the movies.
For cases where this does not happen, one could
think of access to isolated scenes available in a
generalized way, for example in videos on YouTube.
The Movie view also has an Emotions tab
(Fig.6b) with the emotion wheel of the movie songs.
As with the song versions emotion wheel, the songs
are colored by genre and sized by popularity and can
be clicked to access the song video.
In the Narrative timeline it is shown how the
release date of the songs relate to the movie release
date and the narrative date (in the y-axis) along the
whole movie (in the x-axis). In Fig.6c) we have an
example of this visualization for the movie Back to
the Future. It is perceivable that the songs generally
match the date of the narrative of the movie both in
1985 and 1955, with some exception of recent
musics in 1985 being some times played in the 1955
part of the story being told.
When accessing the Movies view, overview
visualizations about movies are presented. In Fig.6d)
one relating movie to song genres. Rock is displayed
as the most used genre in movies, for Comedy,
although Pop music is also very popular in this
movie genre. Colors are adopted for music genre,
movie genres are depicted in grey. This alignings
with the color design options in the application,
highlighting music genres, and contibuting to an
elegant representation.
GRAPP 2019 - 14th International Conference on Computer Graphics Theory and Applications
152
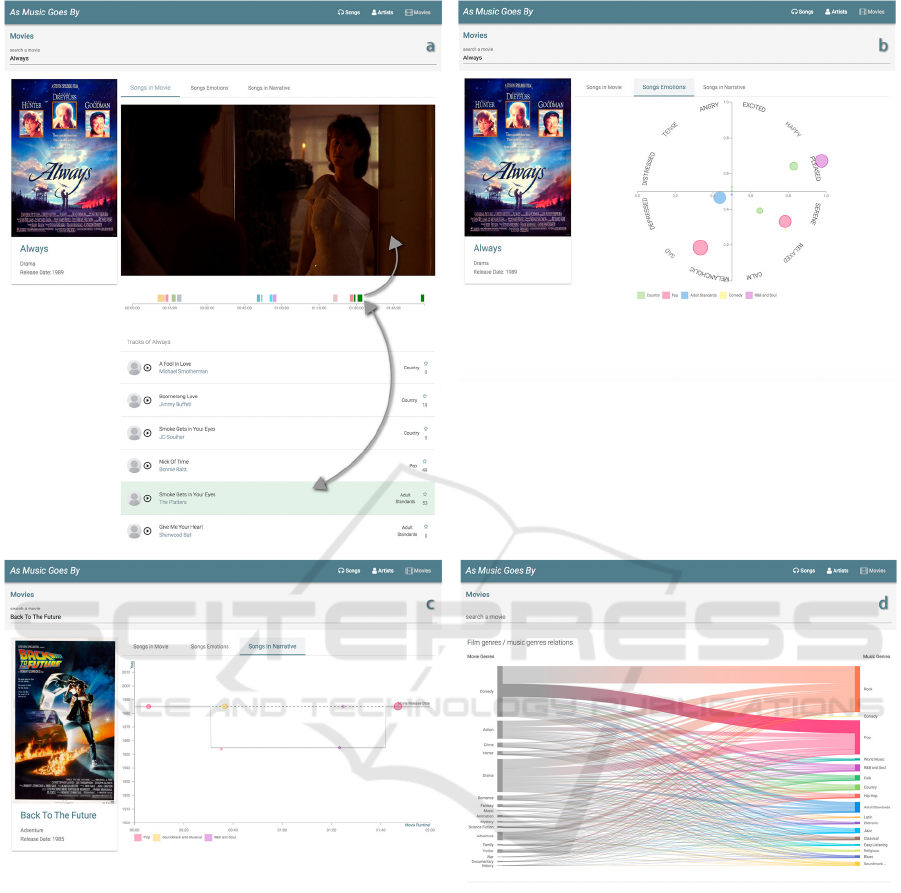
Figure 6: Movies view. a) Movie view. users watch the movie, songs along timeline, indexed to scenes in the movie;
b) Emotions tab; c) Narrative timeline: movie and song release compared with narrative dates; d) Movies view:
Visualization relating Movies genres to Music Genres.
4.5 Architecture and Technologies
A
three
tier
architecture
is
used,
with
Data
Layer
(Mongo
DB,
external
APIs),
Business
Logic
Layer
(NodeJS,
Express)
and
Presentation
Layer
(Angular-
JS, D3). It uses external REST APIs to collect data,
at this point from Spotify (tracks, artists, albums,
images, popularity and audio features), Second-
HandSongs
(original
and
cover
versions,
and
You-
Tube links for the songs), and WhatSong (song
information in the movies).
5 USER EVALUATION
A user evaluation was conducted to assess perceived
usefulness, usability and user experience in As
Music Goes By. We wanted to know how users
would use the it and their opinion on the user
interface and functionalities, how interesting,
effective and usable the interactive visualizations,
the search and navigation across and within music,
artists and movies.
This Music Reminds Me of a Movie, or Is It an Old Song? An Interactive Audiovisual Journey to Find out, Explore and Play
153

5.1 Methodology
We conducted a task-oriented evaluation with semi-
structured Interviews and Observation while the
users performed the tasks with the different features
and visualizations. After explaining the purpose of
the evaluation, asking some demographic questions
and briefing the subjects about the application, the
users performed a set of tasks. For each task, we
observed and annotated success and speed of
completion, errors, hesitations, and their qualitative
feedback through comments and suggestions. There
was also an evaluation based on USE (Lund, 2001)
for each task, where they rated perceived Utility,
Satisfaction in user experience and Ease of use on a
5-point scale.
At the end, the users were asked to provide a
global appreciation of the application, through a
USE rating, to mention the features or characteristics
that stood out on the positive or negative sides, and
suggestions regarding what they would like to see
improved or added in the future. Users were also
asked to characterize the application with most
relevant perceived ergonomic, hedonic and appeal
quality aspects, by selecting pre-defined terms
(Hassenzahl et al., 2000) that reflect aspects of fun
and pleasure, user satisfaction and preferences.
5.2 Participants
This study had 12 participants, 7 male, 5 female, 31-
51 years old (Mean 38.4, StdDev 6.6), most having
college education (2 MSc, 7 BSc, 3 high school),
coming from diverse backgrounds (3 designers, 3
managers, 1 IT, engineer, psychologist, journalist,
salesman, and postman), all having moderate to high
acquaintance with computer applications and having
their first contact with this application, allowing to
discover most usability problems and perceive a
tendency in user satisfaction.
Most participants listen to music every day(10),
week(1) or month(1), using mostly YouTube(11),
but also Spotify(3), SoundCloud(3) and iTunes(2);
whereas they watch movies mostly every week(8) -
day(2), month(1) or occasionally(1)
- using mostly
YouTube(7),
but also NetFlix(4), Vimeo(3) and Daily-
Motion(2).
Most of them search for information about
music
or movies every day(5) or weekly(3) - monthly
(1), occasionally(2), never(1) - using mostly IMDb
(9)
or RottenTomatos(4), less often AllMusicGuide(2)
and Wikipedia(2) and even less(1) often applications
like Last.FM, MusicBrainz, AllMusicGuide, Discogs,
and MetalArchivez. As positive aspects about these
platforms and services, YouTube was clearly the
preferred one to access music and movies, and users
pointed out as key qualities the diversity of content,
playlists, being free and the music suggestions. As
negative aspects, they mainly criticized the ads. For
media information search users preferred IMDb,
praising the amount of information and comments.
In terms of music in versions and movies, the
main focus of the application, half the participants
rated their interest in song versions as medium(6) –
very high(2), high(1), low(2), none(1) - whereas half
rated their interest in songs in movies as very
high(6) - medium(5), low(1). Users were not aware
of
any application for this purpose, like SecondHand-
Song and WhatSong. In sum, most participants have
at least some interest in the main focus of the
application, with an a priori greater interest in songs
in movies, although they do not know any
applications providing that support.
5.3 Results
The users finished almost all the tasks quickly and
without many hesitations, and generally enjoyed the
experience with the application. The results are
presented in tables 2 and 3, and explained in the text
along with the comments made by the users.
Homepage. On the homepage we tested the
interactive feature of watching and comparing music
videos of random original-version pairs. To evaluate
this functionality, we asked the subjects ‘to pick a
random song and watch the videos of the original
and random versions presented’. We had quite
positive results for USE (U:4.1; S:4.2; E:4.8), as can
be
seen on table 2. Users found the feature “very easy
to use”, “interesting” and “appealing”. They liked to
“see the covers of each original” and noted that It
“allows to know new songs”. In a dissenting
opinion, a user said that it could be made visually
more appealing. Another user suggested that it could
have more information about the songs and artists,
which they would in fact access if they navigated to
those song’s and artist’s view.
Songs View. For this view of the application we
created 8 tasks to test the information overview
visualizations in the initial screen, the search and the
song’s detail interface and functionalities.
In T 2.1, the users were asked ‘to identify the
year
with the most versions and the genre with the
most versions in that year’ in the overview visua-
lizations of the Songs View. Although all subjects
completed the task reasonably quick, some hesitated
a bit in the second part, not realizing immediately
that they could interact with the visualization. It was
noted that “there could be a caption to identify the
genres” (something already present in other similar
GRAPP 2019 - 14th International Conference on Computer Graphics Theory and Applications
154

visualizations in the application) and that some were
“not familiar with this kind of graphic repre-
sentation”. Despite this, the general opinion was
quite positive (U:3.8; S:4.3; E:4.2), with some
highlighting the “visual appeal” of the visualization.
In T 2.2, the user is asked ‘to identify what is the
genre whose originals are more versioned, and what
genre has more versions’. Overall opinion was quite
positive (U:3.9; S:4.0; E:4.1), with some users
considering
that the visualization is visually appealing
and that the gender relations are easy to perceive.
Others, on the contrary, have said that it could be
more intuitive. Regarding these visualizations, the
mixed opinions could be a result of different nevels
of familiarity with this type of visualization.
Table 2: USE evaluation of As Music Goes By.
(Scale:1-5: lowest-highest); M=Mean; SD=Std. Deviation).
Task U S E
T# Feature M SD M SD M SD
1 Home: Random versions
4.1 0.9 4.2 0.7 4.8 0.6
Songs View: (mean)
4.3 0.6 4.3 0.6 4.5 0.6
2.1 Vis: overview (streamgrap)
3.8 0.7 4.3 0.5 4.2 0.7
2.2 Vis: Genre relations (chord)
3.9 0.7 4.0 0.4 4.1 0.8
2.3 Search music & versions
4.8 0.5 4.8 0.5 4.9 0.3
2.4 Vis: Timeline (scatterplot)
4.4 0.5 4.3 0.5 4.8 0.5
2.5 Vis: Emotions (scatterplot)
4.3 0.6 4.5 0.7 4.5 0.7
2.6 Vis: List byGenre (imgs)
4.6 0.5 4.5 0.5 4.6 0.5
2.7 Music video play
4.7 0.5 4.3 0.9 4.8 0.5
2.8 version comparison
4.0 0.6 4.1 0.7 4.4 0.7
Artists View: (mean) 4.4 0.6 4.2 0.7 4.3 0.8
3.1 Artist info
4.6 0.7 4.3 0.6 4.4 0.7
3.2 Vis: Album + tracks
4.4 0.7 4.3 0.6 4.3 0.9
3.3 Vis: Related Artists
4.3 0.5 4.1 0.7 4.8 0.5
3.4 Vis: Artists comparison
4.2 0.7 4.2 1.0 3.8 1.1
3.5 Vis: Artists movies (music)
4.6 0.5 4.2 0.4 4.3 0.7
Movies View: (mean) 4.3 0.7 4.4 0.6 4.6 0.6
4.1 Movie info
4.7 0.7 4.8 0.6 4.8 0.4
4.2 Vis: Music timeline
4.7 0.7 4.6 0.7 4.4 1.0
4.3 Vis: Music emotion wheel
4.0 0.7 4.2 0.7 4.5 0.7
4.4 Vis: Music vs narrative
3.8 0.7 3.9 0.7 4.3 0.6
4.5 Vis: Overview genres
4.3 0.8 4.5 0.5 4.8 0.5
Global Evaluation
4.6 0.5 4.7 0.5 4.3 0.8
Total per Task (mean)
4.3 0.6 4.3 0.6 4.5 0.6
The search functionality was tested in T 2.3,
where we asked the subjects ‘to search for the song
Smoke Gets in Your Eyes’. All the users performed
the task quickly and without any hesitation, it was
highly appreciated (U:4.8; S:4.8; E:4.9) and
considered “user friendly”.
To test the initial view of the song – a version
timeline view - we asked the subjects ‘to identify the
original version of this song, its genre, popularity
and number of versions’ (T 2.4). Once more, the
users had no problems performing the task, and
appreciated it (U:4.4; S:4.3; E:4.8). The visual
aspect and the intuitiveness were praised, although a
user said it could be more appealing. It was
suggested that it could have a link to Wikipedia to
allow access to more information.
In T 2.5, we asked the subjects ‘to identify the
emotion associated with the original version of the
song’.
Some users found the emotion wheel visuali-
zation very interesting (U:4.3; S:4.5; E:4.5), saying
that it was “useful to be able to access the songs
according to their mood”. The suggestions included
“highlighting more the original and the names of the
emotions” although the original already has a frame
around it, and the names are presented around the
emotion wheel, as a reference for the positions in the
wheel, where the songs are positioned. This was not
obvious to everyone on the first contact.
In T 2.6, to test the song list by genre, the users
had ‘to select the songs of the genre of the most
popular
song’. The objective was to test the interaction
and the perception of information in this view. All
users performed the task with no hesitations and
apprciated it (U:4.6; S:4.5; E:4.6). Some highlighted
the “visual appeal” and that “it was good to be able
to select songs from a preferred genre”.
The ‘song video play interface’ was tested in T
2.7. In the results we can notice that the subjects
found it easier to use (4.8) than satisfactory (4.3),
but still useful (4.7). This reflects the familiarity of
this feature: “ there are already other applications
that allow you to watch videos”, so they were not
impressed, though satisfied. One user said that he
would prefer the video to open in the same screen.
The version compare feature was tested in T 2.8,
where subjects were asked ‘to compare the Smoke
Gets in Your Eyes version from The Platters with the
one from Bryan Ferry’. This option was appreciated
(U:4.0; S:4.1; E:4.4), as had already happened with
T1, though now the versions were not picked at
random, with a subject highlighting its “ease of use”.
Artists View. In T 3.1, it was asked that the subjects
‘identified how many songs the artist (Bryan Ferry)
had and how many of these were covers and
originals’. The subjects had no problems performing
this task, all of them completed the task quickly
without errors or hesitations. It was appreciated
(U:4.6; S:4.3; E:4.4), and one user mentioned that
the requested information was “easy to find”.
In T 3.2, subjects were asked ‘to indicate he’s
most popular album, its date and the most popular
This Music Reminds Me of a Movie, or Is It an Old Song? An Interactive Audiovisual Journey to Find out, Explore and Play
155

song of that album’. In this task, 3 users took a while
to realize that they had to click the circle to show the
songs, but most of them had no hesitations. The
global evaluation was positive (U: 4.4, S: 4.3,
E:4.3), and users found it “easy to use”, “one of the
most interesting” features and “useful to be able to
access the albums and tracks to know new songs”.
One user suggested that it could also “show the
original artist of the cover versions in the list”.
The
T 3.3 task consisted of ‘identifying the artists
related to the selected artist’. All users completed it
without any issues, appreciated it (U:4.3; S:4.1;
E:4.8). and said it was easy to understand.
According to a user the “images are too small”.
In the compare artist view, the users were asked
‘to compare The Platters with Bryan Ferry, say how
many songs they had in common and identify who is
the original author of the September Song’ (T 3.4).
Subjects had some hesitations in the second part of
the task, taking longer than expected to complete it,
and that was reflected in the slightly lower score for
E (U:4.2; S:4.2; E:3.8). They had to use a connected
graph, that some users could not understand well at
first sight. It was mentioned by some
of them that the
representation is “not very intuitive” and that “it
takes a while to understand the graph”. On the other
hand, a user especially “liked the interactivity”.
To evaluate the ‘artist’s songs in movies’ view
we asked users ‘to identify in which movies the song
Smoke Gets in Your Eyes appears’ (T 3.5). The users
generally liked this feature (U:4.6; S:4.2; E:4.3),
with one mentioning the “font was too small”.
Movies View. In T 4.1, subjects were asked ‘to go to
the Always movie, and indicate how many songs
there are in this movie’. Users liked it a lot (U:4.7;
S:4.8; E:4.8). Most users found the task very easy to
perform, with one taking a little longer due to
hesitations. Users found it “useful and good to be
able to watch the movie and access the soundtrack”.
One user commented that “it could be useful for
people choosing soundtracks for movies”. One of
our goals, actually.
Still on this view, we asked the users ‘to indicate
the moment of the movie in which the song Smoke
Gets in your Eyes from The Platters appears, and to
visualize the moment in the movie in which the song
appears’. Some users did not understand right away
how they could do the task, with one user noting that
“it wasn’t easy to find the song”, but once they did,
they found it easy to use. These hesitations did not
heavily affect the evaluation of the functionality
after all (U:4.7; S:4.6; E:4.4). Some users referred to
it as “aesthetically pleasing” and “useful”.
In T 4.3, it was asked the subjects ‘to identify the
mood of the songs in the movie’. As with the other
emotional view we tested in T 2.5, there were mixed
opinions about the usefulness, with a slightly lower
score in average (U:4.0) reflecting that some find it
very interesting while others not so much, not being
used to this emotional perspective. Still, a user
mentioned that “it could help to understand the
mood of the movie” and they liked the experience
and found it easy (S:4.2; E:4.5).
In T 4.4, the task was ‘to check if the release
date of the songs matched the date of the narrative
of the Back to the Future movie’. This visualization
got some of the lowest scores in Usefulness and
Satisfaction (U:3.8; S:3.9; E:4.3), showing that some
of the users did not have much interest in this
information,
or did not fully understand its relevance,
though they found it easy. One user mentioned that
“it didn’t seem useful”. These were the same
subjects who did not appreciate the overview
visualizations (T 2.1, 2.2 and 4.5) so much.
The movie genres - music genres relations
visualization
was evaluated in T 4.5, where we asked
users ‘to identify which is the predominant musical
genre in comedy films’. The users found this
visualization “aesthetically pleasing”, “original” and
“interesting”.
They were quite satisfied and particular-
ly appreciated its ease of use (U: 4.3; S: 4.5; E: 4.8),
noting that the information was “easy to perceive”.
Global Evaluation. Overall, users thought the
application was interesting, innovative and visually
appealing. Although there were some difficulties in
the first interactions with some of the most unusual
visualizations for the participants less familiar with
this kind of representations, the ease of use was also
referred. Interesting to notice that the global USE
classification users assigned to the application (U:
4.6; S: 4.7; E: 4.3) indicates that at the end they
found it even more usefull and satisfactory that
along their appreciation for the individual features,
in average: (U: 4.3; S: 4.3; E: 4.5). Ease of use as the
most hilighted along the way, gave way to
usefulness and especially to satisfaction as main take
aways from the experience.
When explicitly asked to refer to the features and
functionalities that they appreciated the most, they
mentioned: the “visually appealing visualizations”,
“ability
to view various versions and information of
songs and artists”, “ability to access songs in the
movie”, “the emotional perspective”, “Ease of use”,
“appealing
design”, “comparing songs” and the
“timeline view of the versions”. Some of the less
appreciated aspects were “the connected graph [from
the artist compare screen] is not easy to perceive”,
GRAPP 2019 - 14th International Conference on Computer Graphics Theory and Applications
156

“some parts could be more intuitive”, “the video play
view”, and the “all versions timeline streamgraph”.
The users made some suggestions that they think
would benefit the application like “using analysis of
the song lyrics for the emotions”, “links to IMDb,
and the artist's website” or “gamification of some
parts of the application”.
To summarize this appreciation,
users classifyed
the application with most relevant (as many as they
found appropriate) perceived ergonomic (8 positive
+ 8 negative (opposite)), hedonic (7+7) and appeal
(8+8) quality aspects in (Hassenzahl et al., 2000).
Table 3: Quality terms users chose for As Music Goes By.
H:Hedonic; E: Ergonomic; A: Appeal; Simple (+) vs
Complex (-); Exclusive (+) vs Standard (-).
1 Terms type #
Comprehensible E 10 Attractive A 3
Interesting H 8 Exclusive H 2
Aesthetic A 8 Desirable A 2
Clear E 7 Predictable E 1
Original H 7 Trustworthy E 1
Innovative H 7 Controllable E 1
Simple E 5 Familia
r
E 1
Supporting E 4 Exciting H 1
Motivating A 4 Sympathetic A 1
Pleasan
t
A 3 Complex E 1
Inviting A 3 Standard
H
1
Comprehensible was the most chosen term.
Interesting, Aesthetic, Clear, Original and Innovative
were also chosen by more than half of the subjects.
Just two negative terms were chosen: Complex and
Standard, only once, and less often than the opposite
positive terms. The chosen terms are well distributed
among the hedonic, ergonomic and appeal qualities.
These results confirm and complement the feedback
from
the other evaluation aspects and user comments.
6 IN CONCLUSION
This paper presented As Music Goes By, a web
application being designed and developed with the
aim to propose a richer way to access and relate music
and
movies along time. There is also a focus on genres,
emotions and popularity, reflecting the impact that
these
media have on us, and following on our previous
work on movies, media and wellbeing (Bernardino et
al., 2016). The way we see it differing from and con-
tributing to the scenario of existing applications is
trough flexibility and richness, and the user evaluation
provided a good indication that it is achieving its goals.
Users appreciated the concept of As Music Goes
By, and the new possibilities and perspectives
provided to search, overview, listen, watch and
browse music versions, astists and movies. Overall,
the results were very encouraging, and we got some
insights to inform our future developments. Scores
for Usefulness, Satisfaction and Ease of use were
quite high, and users particularly liked the visually
appealing visualizations, the ability to view various
versions and information of songs and artists, to
compare songs, to access songs in the movies, the
timeline view of the versions and the emotional
perspective. Ease of use and appealing design were
also mentioned often. The less appreciated aspects,
especially by those less familiar with graphical
representations and visualizations were the connect
and stream graphs, although they came to like them
better as soon as they understood them. Interesting,
Aesthetic, Clear, Original and Innovative were the
most perceived qualities, followed by Simple,
Supporting and Motivating.
For the future, we plan to refine the As Music
Goes By, based
on this recent user evaluation and
extend its interactive features. To develop visuali-
zations
further, with more integrated overviews, and
enriching relations among music, artists and movies,
making
it easy to go through, relate and find them
based on common features (e.g. songs that appear in
similar movies), increasing the chances and opportuni-
ties to find unexpected meaningful information, by
chance, synchronicity or serendipity (Chambel, 2011).
This could be enhanced by richer content processing
(e.g. subtitles, lyrics, quotes, and audio (Chambel et al.,
2013),
possibly with human aid (Gomes et al., 2013)),
and emotional impact (Bernardino et al., 2016); and
the flexibility of access from diverse media, modalities
and
contexts, e.g. while listening to a music (identi-
fying the version, like in Shazan,
through query by
example, or by humming); or when feeling blue; or
while watching a movie or music clip, to reach at
related or recommended information.
We believe that this could be a service valuable
for everyone, the general public, interested in music
and
movies, for entertainment, curiosity and inspira-
tion, as well as to professionals and content creators,
e.g.
to raise awareness about the way music has
evolved and has been used in movies, and as a support
to help them choose or create music and movies that
keep entertaining, connecting and touching us.
ACKNOWLEDGEMENTS
This work was partially supported by FCT through
funding of the AWESOME project, ref. PTDC/CCI/
29234/2017, and LASIGE Research Unit, ref. UID/
CEC/00408/2019.
This Music Reminds Me of a Movie, or Is It an Old Song? An Interactive Audiovisual Journey to Find out, Explore and Play
157

REFERENCES
Bernardino, C., Ferreira, H.A., and Chambel, T. 2016.
Towards Media for Wellbeing. In Proc. of ACM TVX'
2016, ACM. 171-177.
Buchanan, B. 2016. The importance of music in enter-
tainment. Alternative Nation. http://www.alternative-
nation.net/the-importance-of-music-in-entertainment/
Chambel, T. 2011. Towards Serendipity and Insights in
Movies and Multimedia. In Proc. of International
Workshop on Encouraging Serendipity in Interactive
Systems. Interact'2011. 12-16.
Chambel, T., Langlois, T., Martins, P., Gil, N., Silva, N.,
and Duarte, E., 2013. Content-Based Search
Overviews and Exploratory Browsing of Movies with
MovieClouds. IJAMC, InderScience, 5(1): 58-79.
Chambel, T., Oliveira, E., and Martins, P. 2011. Being
Happy, Healthy and Whole Watching Movies that
Affect our Emotions. Proc. of ACII 2011, 35-45.
Chen, Y. 2010. Exploratory Browsing: Enhancing the
Browsing Experience with Media Collections, PhD
thesis, Ludwig-Maximilians-Universität München.
Gomes, J.M.A., Chambel, T., and Langlois, T. 2013.
SoundsLike: Movies Soundtrack Browsing and
Labeling Based on Relevance Feedback and Gami-
fication", In Proc. of EuroiTV'2013, ACM, 59-62.
Hassenzahl, M., Platz, A., Burmester, M, Lehner, K. 2000.
Hedonic and Ergonomic Quality Aspects Determine a
Software’s Appeal. ACM CHI 2000. The Hague,
Amsterdam, pp.201-208.
Holm, J., Siirtola, H. 2012. A Comparison of Methods for
Visualizing Musical Genres. Proc. of 16th Interna-
tional Conf. on Information Visualisation, 636-645.
Inskip, C., MacFarlane, A., Rafferty, P. 2008. Music,
movies and meaning: communication in film-markers'
search for pre-existing music, and the implications for
music information retrieval. Proceedings of ISMIR’
2008, pp. 477-482.
Inskip, C., MacFarlane, A., Rafferty, P. 2010. Organising
music for movies. Aslib Proc., 62(4/5), pp. 489-501.
Jorge, A., Correia, N., and Chambel, T. 2017. Designing
Interactive Spatiotemporal Visualizations to Enhance
Movie Browsing. Proc. of Interact. 352-5.
Kim, N.,W., Bach, B., Im, H., Schriber, S., Gross, M.,
Pfiste, H. 2018. Visualizing Nonlinear Narratives with
Story Curves. IEEE Transactions on Visualization and
Computer Graphics, 24(1):595–604.
Langer, T. 2010. Music information retrieval & visualiza-
tion. Trends in Information Visualization.
Lund, A. M. 2001. Measuring usability with the USE
questionnaire. Usability and User Experience, 8(2).
Maehner, J. 2015. Under The Covers: Second Hand Songs
That Matter, Cuepoint. https://medium.com/cuepoint/
under-the-covers-5ffe85ac96d0
MGL-ref: Music Genres List https://en.wikipedia.org/
wiki/ List_of_popular_music_genres
Oliveira, E., Martins, P., and Chambel, T. 2013. Accessing
Movies Based on Emotional Impact. ACM/Springer
Multimedia Systems Journal, ISSN: 0942-4962, 19(6),
Nov. 559-576.
Palmer, S. E., Schloss, K.B., Xu, Z., Prado-León, L. R.
2013. Music–color associations are mediated by
emotion. Proc. of the National Academy of Sciences.
Reflectd. 2014. The Psychology of Music: Why We Listen
to Music and How It Affects The Mind.
http://reflectd.co/2014/06/17/the-psychology-of-music
Russell J. 1980. A circumplex model of affect. Journal of
Personality and Social Psychology, 39:1161–1178.
Salamon, J., Serrà, J., Gómez, E. 2012. Melody. Bass
Line, and Harmony Representations for Music Version
Identification. In AdMIRe’12 Workshop: "The Web of
Music". Proc. of WWW 2012 Companion, ACM, 887-
894.
Schäfer, T., Sedlmeier, P., Städtler, C., Huron, D. 2013.
The psychological functions of music listening. Front.
Psychology, 4:511.
Shneiderman B. 1996. The Eyes Have It: A Task by Data
Type Taxonomy for Information Visualizations.
Proceedings IEEE Symposium on Visual Languages.
Stinson, E. 2015. A Music-Making APP Designed to Help
Teens Deal with Death, WIRED, Design 1(15).
Tufte E. 2001. The Visual Display of Quantitative
Information. Graphics Press, 2
nd
ed.
Ware C. 2012. Information Visualization: Perception for
Design. Morgan Kaufmann, 3
rd
ed.
Zillmann, Dolf; Vorderer, Peter. 2000. Media Enter-
tainment – the psychology of its appeal. Mahwah, NJ:
Lawrence Erlbaum Associates, Inc. Taylor & Francis
e-library 2009. pp. vii. ISBN 0-8058-3324-2.
GRAPP 2019 - 14th International Conference on Computer Graphics Theory and Applications
158
