
Design and Implementation of Web-based
Hierarchy Visualization Services
Willy Scheibel, Judith Hartmann and J
¨
urgen D
¨
ollner
Hasso Plattner Institute, Faculty of Digital Engineering, University of Potsdam, Germany
Keywords:
Service-based, Web-based Visualization, Hierarchy Visualization, Treemap Visualization, REST API.
Abstract:
There is a rapidly growing, cross-domain demand for interactive, high-quality visualization techniques as
components of web-based applications and systems. In this context, a key question is how visualization
services can be designed, implemented, and operated based on Software-as-a-Service as software delivery
model. In this paper, we present concepts and design of a SaaS framework and API of visualization techniques
for tree-structured data, called HIVISER. Using representational state transfer (REST), the API supports
different data formats, data manipulations, visualization techniques, and output formats. In particular, the API
defines base resource types for all components required to create an image or a virtual scene of a hierarchy
visualization. We provide a treemap visualization service as prototypical implementation for which subtypes
of the proposed API resources have been created. The approach generally serves as a blue-print for fully
web-based, high-end visualization services running on thin clients in a standard browser environment.
1 INTRODUCTION
Web-based applications and systems demand for in-
teractive, high-quality visualization across all dom-
ains, in particular in the fields of big data analytics.
The rapidly growing demand results from the key ad-
vantages of visualization services, e.g., data can be
kept on the server side and a dedicated server har-
dware environment can be assumed for the imple-
mentation of high-end rendering techniques (Wood
et al., 2008). A dominant category represents hier-
archical visualization as tree-structured data is om-
nipresent in almost all application domains, e.g.,
demographics (Jern et al., 2009), business intelli-
gence (Roberts and Laramee, 2018), health (Chazard
et al., 2006), and software development (Vernier et al.,
2018). Within the past three decades, over 300 hierar-
chy visualization techniques and variations have been
proposed (Schulz, 2011).
In recent years, the delivery model Software-as-
a-Service (SaaS) became prevalent for most busi-
ness applications. Roughly speaking, it is based on
a well-designed separation between back-ends and
front-ends, which supports centralized data manage-
ment, supports high degree of data privacy and pro-
tection (Koller et al., 2004), and allows for service
provisioning with reduced bandwidth requirements.
Thereby, SaaS can overcome many typical limita-
tions, weaknesses, and restrictions of heavy, data-
rich applications (Mwalongo et al., 2016). Further,
SaaS facilitates continuous deployment as client users
are not concerned with installing new software versi-
ons. The SaaS approach can be applied to the ma-
nagement and provisioning of hierarchy visualizati-
ons: The server-side implementation manages tree-
structured data and its visualization, while the client-
side implementation provides interactive access based
on service requests. The key component represents
the API used for hierarchy visualization services as
it controls the communication between visualization
services and client applications. In addition, the API
should be customizable (e.g., in terms of functional
aspects such as layouts, stylization, etc.) as most ap-
plications want to customize visualization techniques
to their specific requirements.
This paper presents concepts and design of a hier-
archy visualization service based on a REST API,
called HIVISER. The API is primarily focused on
a three-tier architecture as proposed by Wood et al.:
Client Applications, Web Services, and Visualiza-
tion Components (Wood et al., 2008). HIVISER is
a resource-based Web API, i.e., all operations are
mapped to creating, modifying or deleting resources.
Using the concept of visualization pipelines (Haber
and McNabb, 1990), HIVISER defines 16 base re-
source types, representing required concepts, results,
Scheibel, W., Hartmann, J. and Döllner, J.
Design and Implementation of Web-based Hierarchy Visualization Services.
DOI: 10.5220/0007693201410152
In Proceedings of the 14th International Joint Conference on Computer Vision, Imaging and Computer Graphics Theory and Applications (VISIGRAPP 2019), pages 141-152
ISBN: 978-989-758-354-4
Copyright
c
2019 by SCITEPRESS – Science and Technology Publications, Lda. All rights reserved
141

and intermediaries. These resource types provide the
required flexibility for the API. To match the capabi-
lities of a specific visualization service, base resource
types are specialized by means of subtypes. The
route definitions of HIVISER are based on the base
resource types while specifics are integrated within
request and response bodies. Further, HIVISER re-
quires a route providing its OpenAPI specification –
the machine readable documentation of all routes and
expected request bodies.
The remainder of this paper is structured as fol-
lows: Section 2 discusses related work. Section 3
describes the HIVISER API and the underlying requi-
rement analysis. Section 4 exemplifies the usage of
the API for a treemap visualization service. Section 5
gives conclusions and outlines future work.
2 RELATED WORK
Three domains are relevant for a SaaS-based appro-
ach to hierarchy visualization: hierarchy visualization
techniques, web-based visualization approaches and
technologies, and Web APIs.
Hierarchy Visualization Techniques. A variety
of different hierarchy visualization techniques have
been created, which can be distinguished bet-
ween implicit and explicit hierarchy visualization
techniques (Schulz and Schumann, 2006). Ex-
plicit hierarchy visualization techniques visualize
the parent-child relations through explicit links bet-
ween the nodes as Tree Diagrams (Chomsky, 1965),
Cone Trees (Robertson et al., 1991), or Botanical
Trees (Kleiberg et al., 2001). In contrast, implicit
hierarchy visualization techniques indicate the rela-
tions by the arrangements of the nodes. The most
prevalent implicit visualization techniques are Ici-
cle Plots (Kruskal and Landwehr, 1983) and Tree-
maps (Johnson and Shneiderman, 1991). Most other
implicit techniques are related to one, if not both of
them (Schulz et al., 2011). Some hierarchy visua-
lization techniques also mix the concept of implicit
and explicit visualization of hierarchies, resulting in
hybrid visualization techniques like Exploded Tree-
maps (Luboschik and Schumann, 2007) or Informa-
tion Slices (Andrews and Heidegger, 1998). Other
classifications are based on dimensionality (e.g., 2D,
2.5D, and 3D) or alignment of the nodes (Schulz,
2011). The Web API of a visualization service, ho-
wever, should not be limited to a specific dimensi-
onality or the concrete layout of displayed compo-
nents as these are all implementation details encapsu-
lated by the service. Some visualizations even use a
mixture of those dimensionalities as mixed-projection
treemaps (Limberger et al., 2017).
Treemaps represent a prominent family of impli-
cit hierarchy visualization techniques using a space-
filling approach (Johnson and Shneiderman, 1991).
They compute recursively divided areas that include
the nested nodes of a given hierarchy. Rectangular
treemaps include Slice and Dice (Johnson and Shnei-
derman, 1991), Strip (Bederson et al., 2002), Squa-
rified (Bruls et al., 2000), Hilbert and Moore (Tak
and Cockburn, 2013), and Hybrid Treemap Layou-
ting (Hahn and D
¨
ollner, 2017), where the latter
one combines several different treemap layout algo-
rithms within a single treemap. Some layout algo-
rithms also use non-rectangular shapes like Voronoi
Treemaps (Balzer and Deussen, 2005) and Gosper-
Maps (Auber et al., 2013).
Visualization in the Web. The development of ap-
proaches to display visualizations – either as a sta-
tic images or a dynamic interactive application – has
been influenced by web browser technologies (Mwa-
longo et al., 2016). Browsers can display visualizati-
ons using built-in methods (e.g., the img tag (Berners-
Lee and Connolly, 1995), Scalable Vector Graphics
(SVG) (Ferraiolo et al., 2003)) or using external
plugins (Java applets or the Flash player). Further,
the HTML5 specification introduced the canvas ele-
ment in 2014
1
. This canvas can display hardware-
accelerated 2D or 3D visualizations using the Web
Graphics Library (WebGL)
2
. Similiar to SVG for 2D
content, there are approaches to describe 3D con-
tent called Declarative 3D. To date, declarative 3D
approaches like X3DOM (Behr et al., 2009) and
XML3D (Sons et al., 2010) have no native support
by any browser. A typical workaround are polyfill
layers (Sons et al., 2010).
Besides the aforementioned techniques, there are
two different approaches to display visualizations
in the Web: The imperative approach usually re-
quires a programmer to program the resulting visu-
alization, while the declarative approach creates a
visualization by means of parameter configuration
instead of programming. Examples include impe-
rative WebGL (Limberger et al., 2013) and declara-
tive 3D (Mesnage and Lanza, 2005; Limberger et al.,
2016b), respectively. Improving on the plain techni-
ques, visualization toolkits support developers by pro-
viding abstraction on data manipulation, visualization
techniques, navigation, and interaction. Examples
hereof are Prefuse (Heer et al., 2005), its successor
1
https://www.w3.org/TR/html5/semantics-scripting.html
#the-canvas-element
2
https://www.khronos.org/registry/webgl/specs/latest/2.0/
IVAPP 2019 - 10th International Conference on Information Visualization Theory and Applications
142

Flare
3
as well as Protovis (Bostock and Heer, 2009)
and its successor D3 (Bostock et al., 2011). Provi-
ding a full server-client setup, the Shiny
4
package for
the R statistics and visualization environment allows
for rapid prototyping of visualizations as a service.
Examples for declarative approaches are visualization
grammars like Vega Lite (Satyanarayan et al., 2017)
and ATOM (Park et al., 2018). Specific to hierarchy
visualization is the HiVE notation (Slingsby et al.,
2009). Ready-to-use services as TreeMappa
5
allows
to create images of treemaps from CSV data. Other
declarative approaches are charting libraries like the
SVG-based Google Visualization API
6
, the canvas-
based Chart.js library
7
, or the D3-based c3
8
. Web
APIs can also be used as a declarative approach to
visualize data. In the domain of web-based 3D geo-
data portrayal, the OGC 3D Portayal Service (Hage-
dorn et al., 2017) specifies a standardized Web API
that supports the delivery of 3D scene data and server-
side scene rendering. These service-based proces-
sing and provisioning techniques are used for image-
abstraction (Richter et al., 2018) and point clouds as
well (Discher et al., 2019).
Web APIs. An Application Programming Interface
is a specification of possible interactions with a soft-
ware component. It contains interfaces by means of
classes, objects, functions, parameters together with
their semantics and expected behavior, which allows
programmers to access specific features or data of
another application, operating system, or service. An
API that is accessed using the Hypertext Transfer Pro-
tocol (HTTP) is called a Web API.
Stylos and Myers describe three stakeholders that
interact with an API directly or indirectly: the API de-
signer, the API user and the product consumer (Stylos
and Myers, 2007). They imply that an API is created
to provide an interface for an existing implementa-
tion. Therefore, no stakeholder is included, that im-
plements a system, which uses an existing API Design
as an interface. For this purpose, we add the visuali-
zation designer stakeholder (Figure 1).
Approaches for Web APIs can be classified as
either action-based or resource-based. Former Web
APIs use an RPC-based protocol to trigger an action
on the server (Nelson, 1981). Some of these pro-
tocols encode calls with XML, e.g., the service-
oriented architecture protocol (SOAP) (Hadley et al.,
3
http://flare.prefuse.org/
4
https://shiny.rstudio.com/
5
http://www.treemappa.com/
6
https://developers.google.com/chart/
7
https://www.chartjs.org/
8
https://c3js.org/
Web-API
Visualization
Designer
API Designer
API User
Product
Consumer
Client Server
Visualization
Service
Client
Applications
extends
designs
implements
provides
uses
develops
uses
Figure 1: There are four groups of stakeholders that inte-
ract with a hierarchy visualization service. It is shaped by
the API designer and the visualization designer. The API
user develops client applications that use a hierarchy visu-
alization service to manage tree-structured data or display
depictions of the data. These client applications are used by
the product consumer.
2007) or XML-RPC
9
, while others use JSON, e.g.,
JSON-RPC
10
or define their own notation to encode
calls, like gRPC
11
or GraphQL
12
. Latter Web APIs
use the architectural style of the Representational
State Transfer (REST) for distributed hypermedia sy-
stems (Fielding, 2000). A RESTful service is defi-
ned by the following six constraints: Client-server
Architecture, Layered System, Stateless, Cacheabi-
lity, Code on Demand, and Uniform Interface. In
order to obtain a uniform interface, Fielding further
defined four architectural constraints for the uniform
interface: Identification of Resources, Manipulation
through Representations, Self-descriptive Messages,
and Hypermedia as the Engine of Application State.
Web APIs that conform to these constrains are called
RESTful APIs.
An API is usually specified using interface des-
cription languages (IDL), which describe interfaces
using programming-language-agnostic syntax and se-
mantics. As such, the Web Service Description Lan-
guage (WSDL) is an XML-based IDL that is com-
monly used to specify SOAP server interfaces. (Chin-
nici et al., 2007). In constrast, the RESTful equivalent
to WSDL is the Web Application Description Lan-
guage (WADL) (Hadley, 2006). A more recent REST-
ful API description language is OpenAPI
13
, formerly
known as Swagger Specification. Its tooling
14
sup-
ports additional languages for client libraries and IDE
integration.
9
http://xmlrpc.scripting.com/spec.html
10
https://www.jsonrpc.org/specification
11
https://grpc.io/
12
http://facebook.github.io/graphql/
13
https://www.openapis.org/
14
http://openapi.tools/
Design and Implementation of Web-based Hierarchy Visualization Services
143

Figure 2: Examples of hierarchy visualization techniques that are covered by the concepts of HIVISER. From top to bottom
and left to right: 2.5D Icicle Plot, Sunburst View, 2.5D treemap, Voronoi treemap, treemap landscape, radial layout depiction,
and a treemap using sketchiness as visual variable.
Different models have been created to evaluate an
API based on varying criteria. Stylos and Myers eva-
luate the quality of an API based on its usability and
power (Stylos and Myers, 2007). Contrarily, the Ri-
chardson Maturity Model (RMM) evaluates the matu-
rity of a Web API based on its adherence to the prin-
ciples of REST (Webber et al., 2010).
3 HIVISER API
We propose an approach for a Web API for the mana-
gement and provisioning of hierarchy visualizations
(Figure 2), named Hierarchy Visualization Service –
HIVISER. The API supports access and control to all
parts of a hierarchy visualization system: the import
and manipulation of data, mapping the data to a visua-
lization, and providing the visualization to a client via
web requests (Figure 3). The route definitions are ba-
sed on resource types that are derived from use cases
in hierarchy visualization. These routes are meant to
be general extensions points for specific hierarchy vi-
sualization services by specialization of requests and
responses, rather than adding new resources or routes
to the API.
3.1 API Requirements
The capabilities of the client depend on the use case.
Some use cases require a rich client implementation,
e.g., one that enables interactive exploration in the vi-
sualization. Other use cases only require a rendered
image or a model of the visualization. The client may
provide the visualized data and configurations about
data manipulations, the visual mapping of the data
and the output format of visualizations. Depending
on use case and capabilities of the client application,
different output formats or intermediate results must
be accessible by the client. For example, some client
applications implement their own rendering of a hier-
archy visualization to enable interactive exploration,
while others display static images of visualizations.
The API should support both and further use cases,
mostly occurring as extensions to phases of the vi-
sualization pipeline. As such, a variety of visual va-
riables is desirable (Limberger et al., 2016a). Espe-
cially a fine-grained control over the management of
data allows for sophisticated handling of time-varying
data (Tu and Shen, 2008; Scheibel et al., 2018), data
provided from different sources, hierarchies with dif-
ferent characteristics (Caudwell, 2010), and the con-
figuration of the visual mapping of subtrees (Slingsby
et al., 2008; Schulz et al., 2013).
Domain-agnostic Features. From an API design
viewpoint – and disregarding the domain of hierarchy
visualizations –, HIVISER must support the following
general requirements for efficient usage:
Adaptability and Extensibility. It must be possible
to adapt a hierarchy visualization service API to
the capabilities of the visualization service. This
adaptation is characterized by extending concepts
of the abstract hierarchy visualization service –
instead of adding new ones – so all adapted HI-
VISER APIs keep a consistent structure.
Documentation of General Specification. A hierar-
chy visualization service API must be specified
unambiguously. A client application programmer
who uses a specific hierarchy visualization service
via Web API must know how to use and adapt it.
IVAPP 2019 - 10th International Conference on Information Visualization Theory and Applications
144

Data
Derived Data
Visualization
Hierarchy Visualization Service
Data
Preparation
Mapping
Data
Provisioning
Rendering
Transformation
Provide
Provide
Provide
Provide
Control
Control
Control
Control
Provide
Model
Image
Control
Figure 3: The required features of a hierarchy visualization service are derived from an adapted visualization pipeline (Haber
and McNabb, 1990). Depending on the use case the execution of particular phases of the pipeline is distributed on server and
client. Clients require control over these phases and must be able to access final and intermediary results.
Documentation of Adapted Specification. Further,
an API user should be able to discover all routes
and understand input parameters and their mea-
ning without looking at external documentation.
A hierarchy visualization service must specify a
way to include comprehensive documentation as
part of the web service.
Core Features. Based on the model of a visualiza-
tion pipeline as service, the API has to provide the
following functionalities:
Data Provisioning. A hierarchy visualization ser-
vice, and thus, its API, must include a way to pro-
vide data for a client application.
Data Transformation. The visualization service
transforms the source data suited for visualiza-
tions (e.g., normalization, thresholding, general
transformations). A client application must be
able to manage data transformations through the
API.
Visualization Mapping. Visualization mapping des-
cribes the process of mapping characteristics of
the derived data to visual characteristics – a vir-
tual scene. This includes the selection of a vi-
sualization technique available within the visua-
lization service. A hierarchy visualization service
must include an interface for visual mapping, in-
cluding layout and visual variables (Carpendale,
2003).
Manage Rendering Process. The transformation of
a virtual scene to an image is called rendering.
The API must enable the management of the ren-
dering process within the visualization service.
This includes the ability to trigger the rendering
process and to provide options that influence the
rendering process, like image dimensions or addi-
tional effects.
Manage Model Process. Virtual scenes may also be
transformed into models, e.g., in declarative 3D
formats like XML3D and X3DOM. These models
can be archived or directly displayed within the
client application. The API enables the manage-
ment of the transformation process within the vi-
sualization service.
Request Management Configurations. The confi-
gurations for the transitional steps, which are per-
sisted within the visualization stack, need to be
made accessible to the client applications until a
request to delete them is received by the visuali-
zation stack.
Requesting Data and Derived Data. A client appli-
cation may need access to the data or the derived
data for their own implementations of a visualiza-
tion technique. A hierarchy visualization service
must provide a way to request data and derived
data from the visualization stack.
Request Images and Models. The hierarchy visua-
lization service must enable the web application
to request rendered images and models of a visu-
alization from the visualization stack.
Non-functional Requirements. In contrast to pro-
visioning of actual features, an efficient API should be
further constrained in how the features are provided.
One such requirement is the reusability by means of
re-usage of information and previously submitted or
computed results on a visualization service. This fa-
cilitates the creation of visualizations with the same
options for different data as the options do not have
to be recreated. Further, reusability of information al-
lows to use already processed information, instead of
processing the same information twice. To ensure an
efficient process, the amount of requests and the re-
quest response time should be as minimal as possible.
As a RESTful API, HIVISER should fulfill all requi-
rements to qualify as a Level 3 service in the Richard-
son Maturity Model (Webber et al., 2010). These re-
quirements are: using a different URL for every dif-
ferent resource, using at least two HTTP methods se-
mantically correct, and using hypermedia in the re-
sponse representation of resources.
Design and Implementation of Web-based Hierarchy Visualization Services
145

DataSource
Dataset
Node
Attribute
Buffer
TopologyAttribute
NumericAttribute
NominalAttribute
Layout
VisualVariable
Labeling
VisualizationOptions
BufferViewOptions
BufferView
BufferTransformations
Visualization
VisualizationModel
ModelOptions
VisualizationImage
ImageOptions
Figure 4: The base resource types of HIVISER are derived
from the standard visualization pipeline, providing access
and control to all parts of a hierarchy visualization system:
the import and manipulation of data, mapping the data to a
visualization, and providing the visualization to a client.
3.2 Resource Types
The design of HIVISER includes the definition of 16
base resource types, which represent the resources re-
quired to create an image or a model of a hierarchical
visualization of data (Figure 4). From dataset pro-
visioning to image synthesis and model creation, all
sources, intermediaries, and results are creatable, con-
figurable, and requestable. The main categories of re-
sources are source data, derived data, visualization,
images, and 3D models. Through assignment to a re-
source of a defined type, information becomes iden-
tifiable and therefore reusable. The high amount of
resource types enables the reusability of data and in-
termediate results on a high level of granularity. Alt-
hough resource types are specified by HIVISER, most
attributes are target to specification for visualization
services, as they are highly visualization-technique-
specific.
Source Data. Data is provided to a visualization
service by creating resources of type DataSource,
which includes the origin of data. A single snaps-
hot is identified through a Dataset. Thereby, a
DataSource encapsulates a tree-structured dataset in-
cluding its evolution. The API does not limit the pos-
sible types for data provisioning. Typical uses in-
clude user upload of single files (e.g., CSV files or
Excel sheets) or the configuration of an online data
source and a periodical data extraction through user-
configured scripts. An Attribute is an identifier for
data mapping later in the pipeline, including meta in-
formation about their characteristics, e.g., their type
and value ranges. Prevalent types are the topology
of a dataset to derive a layout and numeric, ordinal,
or nominal data for visual variable mapping. Especi-
ally Attribute types and meta information are sub-
ject for specialization. Per Dataset, the list of Nodes
is accessible, including their parent-child relationship
that represents the tree-structure that is used for la-
youting and hierarchical attribute processing. Measu-
red data per Dataset is organized in Buffers that are
associated with Attributes, where values are acces-
sible per attribute and node.
Derived Data. Additional, derived Attribute re-
sources can be created by transformation of attribute
values using BufferTransformations. This is the
approach to support data preprocessing and prepa-
ration. The derived Attributes are organized as
BufferViews, a subtype of Buffers, whose options
contain a list of BufferTransformations specifying
the actual transformations of the attribute values. Spe-
cific transformation operations, e.g., normalization,
combination, or filtering, are subject to specific visu-
alization services. For subsequent mapping to layout
or further visual variables, source attributes and deri-
ved attributes are used polymorphous.
Visualization. The resource type Visualization
represents the combination of a selected Dataset,
a Layout configuration and further Attributes
that are mapped to additional visual variables.
The mappings are configurable through the
VisualizationOptions. The use of Labeling
enhances the visualization by additional display of
data that is mapped as text. These resource types are
the main target for specialization by visualization
services, as the supported layout algorithms, additio-
nal visual variable mapping and further visualization
techniques are the main components of a visualiza-
tion service, while being highly use-case dependent.
The benefit of HIVISER is not a restriction on
specific features but providing guidelines on concepts
used in hierarchy visualization.
Images and Models. Final results of the API are
static images and three-dimensional models. The re-
source type VisualizationImage is used to manage
rendered images from a specific Visualization
resource. Image-related configuration is passed
through ImageOptions. Typical parameters include
the position of the virtual viewpoint, dimensions
of the image as well as the file type. Selection
of multiple renderers and their parameterization are
subject to the ImageOptions, too. In a similar
way, VisualizationModels are configured by using
ModelOptions resources.
IVAPP 2019 - 10th International Conference on Information Visualization Theory and Applications
146

Table 1: HIVISER defines routes based on its base resource types. Subtypes are addressable through their base resource types.
Therefore, no additional route definitions are added in an adaption of HIVISER. Resource types that are created without use
of the API do not have any modifying operations available.
Resource Type Route
GET
POST
PUT
PATCH
DELETE
(Root) / 3
DataSource /dataSources 3 3 3 3 3
Dataset /dataSources/:dataSourceId/datasets 3
Node /dataSources/:dataSourceId/datasets/:datasetName/nodes 3
Buffer /dataSources/:dataSourceId/datasets/:datasetName/buffers 3
BufferViewOptions /bufferViewOptions 3 3 3 3 3
BufferTransformation /bufferTransformations 3 3 3 3 3
Attribute /attributes 3
VisualizationOptions /visualizationOptions 3 3 3 3 3
VisualVariable /visualVariables 3 3 3 3 3
Layout /layouts 3 3 3 3 3
Labeling /labelings 3 3 3 3 3
Visualization /visualizations 3 3 3 3 3
ImageOptions /imageOptions 3 3 3 3 3
ModelOptions /modelOptions 3 3 3 3 3
VisualizationImages /images 3 3 3 3 3
VisualizationModel /models 3 3 3 3 3
(OpenAPI Specification) /openAPI 3
Table 2: The implication of a HTTP method depends on the request targeting a single resource or a collection of resources.
By HIVISER, POST and PUT are not defined on single resources and PATCH is not defined on collections of resources.
Operation Collection (/:type) Resource (/:type/:id)
GET Retrieve response representation of all resources of
collection
Retrieve response representation of resource
POST Creates a new collection resource –
PUT Replace entire collection –
PATCH – Updates properties of a resource
DELETE Deletes all resources of collection Deletes resource
3.3 Routes and Operations
The route definitions of HIVISER are based on the
base resource types. Specific operations executed
within the visualization service are determined based
on the route and the HTTP methods (Table 2). The
base resource types enable the provisioning of data to
the visualization service, manipulating the data and
accessing the derived data, mapping characteristics of
the data to visual attributes of a hierarchy visualiza-
tion, and rendering an image or creating a model of
the visualization. HIVISER defines routes based on
the base resource types, therefore a visualization de-
signer does not need to extend a visualization servi-
ces’ API with additional route definitions. The defi-
ned subtypes influence only the request and response
contents and formats.
Mapping of Resources to Routes. The base re-
source types are available as routes (Table 1), alt-
hough subtypes are excluded as they are addressable
through their base type route. For a full level 3 RE-
STful API, multiple HTTP methods has to be used se-
mantically correct. HIVISER uses the methods GET,
POST, PUT, PATCH, and DELETE according to their
common semantics (Table 2). For compatability with
transmission formats as JSON – a format with no in-
herent way of determining an object type –, the gene-
ral property type on a resource is used to determine
the subtype association. To fulfill the documentation
requirements, HIVISER requires the provisioning of
a complete OpenAPI specification through a route of
the API. This enables a client application to automa-
tically adapt to different visualization services using
HIVISER API as interface, e.g., by adapting their
graphical user interface. For the sake of simplicity,
this route is specified to be /openAPI.
API Adaptions. HIVISER is designed to support
various hierarchy visualization techniques and imple-
mentations. Therefore, the API designer should be
able to adapt the API to the capabilities of the visu-
Design and Implementation of Web-based Hierarchy Visualization Services
147

alization service – at best, without structural changes
to the API. This is accomplished as the API desig-
ner does not need to create new base resource type
related to the creation of an image or a model of a
visualization. Instead, the base resource types have
to be extended, i.e., subtypes have to be created. Ty-
pically, this adaption is done continuously within the
development of the visualization service.
4 TREEMAPS AS A SERVICE
To demonstrate HIVISER, we show the treemap visu-
alization service https://hiviser.treemap.de. The ser-
vice provides data management for tree-structured
data as well as configuration and provisioning of
treemap-based data visualization. It is accessible via
HIVISER API for custom clients and a prototypical
Web frontend. To access the service via HIVISER,
the API has to be specialized by means of sub-types
towards the capabilities of the service.
4.1 Service and Client Features
The service provides all concepts and routes as pro-
posed by HIVISER (example request in Listing 1).
Regarding source data, an end user can create own
datasets via DataSources and upload data as CSV.
In addition to the visualization-specific parts, the tree-
map service uses user management to isolate different
users and their datasets from each other
15
. The imple-
mentation specifics of the service are as follows:
Data and Preprocessing. The first column of the
CSV file is expected to be the node identifier with
slashes as delimiters to encode the parent path of no-
des (e.g., a file path). The parts of the node identifier
are used as a nominal attribute for node labeling (for
both inner and leaf nodes). The other columns of the
CSV are used as further numeric attributes that are re-
gistered within the service and exposed via the API.
Derived data is provided by means of attribute value
normalization and simple transformations.
Layouting and Mapping. The service provides
rectangular treemap layouting algorithms, node off-
sets for hierarchical structure depiction, and the furt-
her visual variables color and height – allowing the
creation of 2.5D treemaps. Labeling is supported
through use of OpenLL (Limberger et al., 2018).
15
As prototypical service, it provides functionality, but
neither safety nor security.
Rendering and Provisioning. The treemap images
are rendered using progressive rendering (Limberger
and D
¨
ollner, 2016), allowing for both basic 2D de-
pictions of treemaps and sophisticated graphical ef-
fects for virtual 3D environments (Figure 5). In addi-
tion to images, the service provides three-dimensional
models for client-side embedding and rendering. For
use within rich clients, the treemap service provides
extracted and derived data by means of tree-structured
data, attribute values, and layouts as data buffers.
Client. The thin client is a Web page to manage
tree-structured data and configure treemap visua-
lizations. It embeds rendered images and three-
dimensional models, whereby models are rendered
using polyfill layers (Figure 6).
1 { "visualization": {
2 "name": "Tierpark2014",
3 "dataSource": "tierpark",
4 "dataset": [ "Tierbestand2014" ],
5 "options": {
6 "name": "2.5D Population Count Map",
7 "type": "2.5d-treemap",
8 "layout": {
9 "weight": {
10 "name": "count-normalized",
11 "source": "count",
12 "transformations": [
13 {
14 "type": "normalization",
15 "min": 0,
16 "max": "source"
17 }
18 ]
19 },
20 "algorithm": "Strip",
21 "parentPadding": 0.01,
22 "siblingMargin": 0.03
23 },
24 "labeling": {
25 "labels": "names"
26 },
27 "visualVariables": {
28 "color": {
29 "attribute": ...,
30 "parentGradient": "white",
31 "leafGradient": "colorbrewer-3-OrRd"
32 },
33 "height": {
34 "attribute": ...
35 }
36 }
37 }
38 },
39 "options": {
40 "width": 1920,
41 "height": 1080,
42 "eye": [ 0.0, 1.2, 0.8 ],
43 "center": [ 0.0, 0.0, 0.0 ],
44 "up": [ 0.0, 1.0, 0.0 ]
45 } }
Listing 1: Example request JSON for a treemap image
at the route /images. Repetitive sub-objects are omitted
for brevity.
IVAPP 2019 - 10th International Conference on Information Visualization Theory and Applications
148
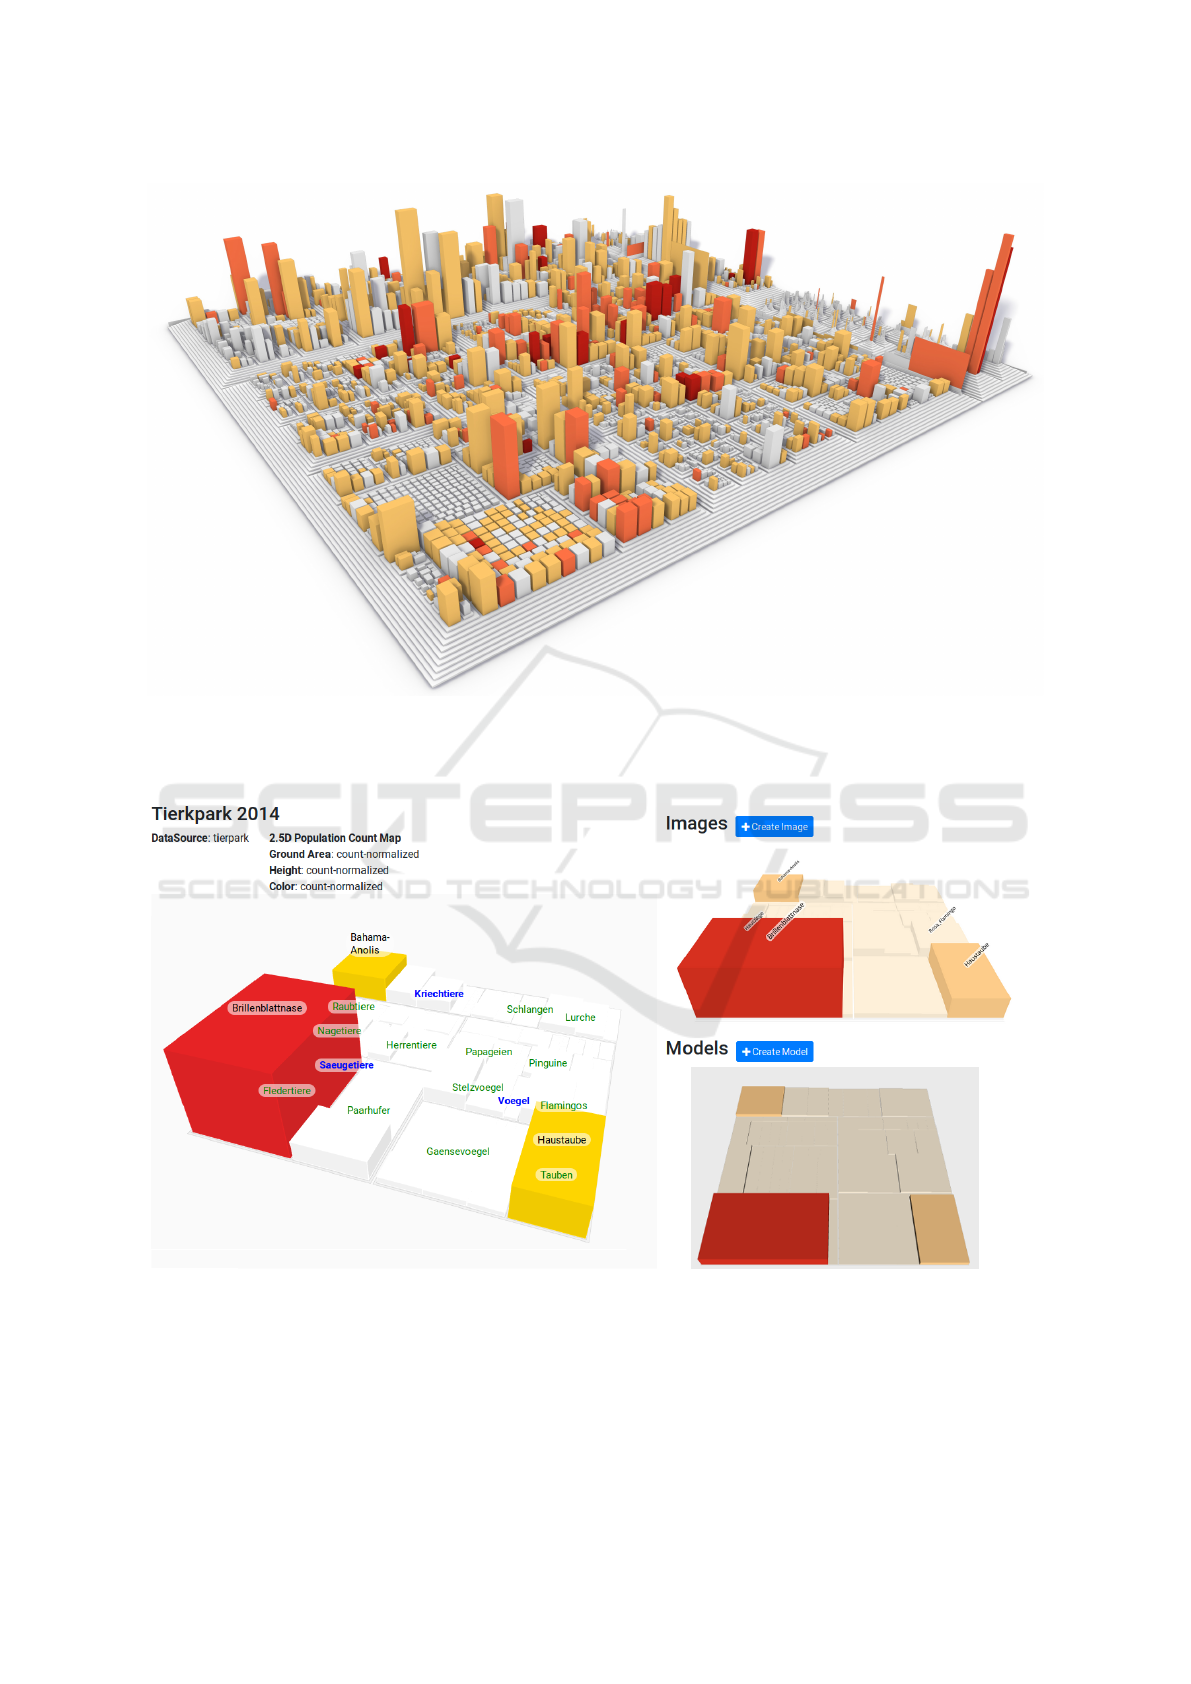
Figure 5: A rendered image as provided by the treemap service. The depicted dataset is a manually measured software system
by means of software metrics of the Open Source project ElasticSearch. The weight of a node is derived from the Lines-of-
Code of a source code file, the height is mapped from the percentage of code within deep nesting (NL) and the cyclomatic
complexity is mapped to color using a sequential scheme.
Figure 6: The detail page of the thin client displays in interactive visualization (left) and already created images and models
(right). The configuration for all depictions is derived from the request of Listing 1. Please note that the interactive client does
not use the same color scheme as the service.
Design and Implementation of Web-based Hierarchy Visualization Services
149

4.2 Adaptations of HIVISER
To expose all capabilities of the treemap service, the
HIVISER API is specialized. During the adaptation
process, subtypes of the following base resource types
had to be defined.
DataSource. Regarding the data management, the
standard concepts suffice. However, the service au-
tomatically process newly uploaded data and parses
the nodes, attributes, and all values for subsequent
provisioning via the API. As additional properties, a
human-readable identifier to identify a dataset for se-
lection in a user interface is supported. The Dataset
is subtyped to allow for a measurement timestamp and
a human-readable identifier, too.
BufferTransformations. The standard type
for transformation has to be subtyped to sup-
port specialized parameters for different types of
BufferTransformations. For example, the nor-
malization of data is configured by user-specified or
data-derived minimum and maximum values.
Layout and Layout Buffer. The treemap service
allows for the creation of 2D and 2.5D rectangular
treemaps with additional color mapping. This has to
be reflected in a subtype of the Layout that is ex-
tended by a property to map a numeric attribute to
the ground area weight and the property to specify a
treemap layout algorithm. Additional properties are
a numeric attribute for the sorting of the nodes, as
well as padding and margin between the nodes for
nested depiction. In order to provide the intermedi-
ate layout as response, a subtype of an Attribute,
the RectangularTreemapLayoutAttribute, is ad-
ded. The associated geometry data to a layout for a
specific dataset is contained in the subtype of Buffer
named RectangularTreemapLayoutBuffer.
VisualVariables. The provided treemap has two ad-
ditional visual variables to which attributes are map-
ped: color and height. To represent these visual
variables two subtypes of VisualVariable have to
be created: ColorVariable and HeightVariable.
ColorVariable adds additional properties to select a
color schemes for both non-leaf nodes and leaf nodes.
HeightVariable introduces a global scaling factor.
VisualizationOptions. The TreemapOptions as
subtype of VisualizationOptions represent a spe-
cific map theme. Thereby, they add a name
property, providing a human-readable identifier.
TreemapOptions restrict the subtype of a Layout re-
ferenced in the layout property to TreemapLayout.
The map for the value of the visual variables
properties contains the keys color and height,
which are limited to refer to ColorVariable and
HeightVariable, respectively. For labeling, no spe-
cialized subtype is defined. Therefore, labeling refers
to the base resource type Labeling, containing only
a mapping of the labels to a NominalAttribute.
Visualization. A new subtype of Visualization
named Treemap is added. It restricts the options to
TreemapOptions and restricts the amount of referen-
ced Datasets to exactly one as this service can only
visualize one Dataset at a time.
VisualizationImage and ImageOptions. Images
of a treemap are created in a three-dimensional
space, therefore the position of the virtual camera
and the view direction are important. A subtype of
ImageOptions for is added to the adaption of HIVI-
SER, named 3DImageOptions. It adds the additio-
nal properties for eye, center and up vectors to adjust
the virtual camera. For the actual image of a tree-
map the subtype TreemapImage of Image is added. It
restricts Visualization to Treemap and options to
3DImageOptions. In addition to provisioning of the
visualizations’ rendering as color image, technical de-
piction as id buffers and normal buffers by means of
false-color images can be requested, too.
5 CONCLUSIONS
This paper presents concepts, implementation, and
use cases for the HIVISER API, providing a blue-
print of a Web API for hierarchy visualization. The
API covers the communication between client ap-
plications and hierarchy visualization services for
tree-structured data. Thereby, HIVISER defines
base resource types derived from standard visua-
lization pipelines and shared aspects of hierarchy
visualization techniques. As an example of its
applicability, the open hierarchy visualization ser-
vice https://hiviser.treemap.de is accessible via HIVI-
SER API to provide treemap visualization as a ser-
vice. The service can be used with own clients or the
accompanying thin client.
HIVISER facilitates the adjustment of client ap-
plications to visualization services, by making it fas-
ter, cheaper and less error-prone. A route exposing
its OpenAPI specification, i.e., the machine-readable
specification of all routes, parameters, and request
IVAPP 2019 - 10th International Conference on Information Visualization Theory and Applications
150

and response definitions, further improves the adjus-
tment processes. Additionally, it enables for fine-
grained communication, data management and pri-
vacy aspects. Although the API is designed to be
accessible by client applications, the use of HIVISER
within a microservice architecture is possible, too.
Future work could include combinations of visu-
alizations (Scheibel et al., 2016), superimposed rela-
tions (Holten, 2006) as well as more complex dataset
formats where the topology is part of the paramete-
rization (Slingsby et al., 2009). Further, it could be
evaluated if the scope of HIVISER can be extended
towards non-tree-structured data.
ACKNOWLEDGEMENTS
We want to thank the anonymous reviewers for their
valuable comments and suggestions to improve this
paper. This work was partially funded by the German
Federal Ministry of Education and Research (BMBF,
KMUi) within the project “BIMAP” (www.bimap-
project.de) and the German Federal Ministry for Eco-
nomic Affairs and Energy (BMWi, ZIM) within the
project “ScaSoMaps”.
REFERENCES
Andrews, K. and Heidegger, H. (1998). Information sli-
ces: Visualising and exploring large hierarchies using
cascading, semi-circular discs. In Proc. IEEE InfoVis,
pages 9–12.
Auber, D., Huet, C., Lambert, A., Renoust, B., Sallaberry,
A., and Saulnier, A. (2013). Gospermap: Using a
gosper curve for laying out hierarchical data. IEEE
TVCG, 19(11):1820–1832.
Balzer, M. and Deussen, O. (2005). Voronoi treemaps. In
Proc. IEEE InfoVis, pages 49–56.
Bederson, B. B., Shneiderman, B., and Wattenberg, M.
(2002). Ordered and quantum treemaps: Making ef-
fective use of 2d space to display hierarchies. ACM
ToG, 21(4):833–854.
Behr, J., Eschler, P., Jung, Y., and Z
¨
ollner, M. (2009).
X3DOM - A DOM-based HTML5/ X3D Integration
Model. In Proc. ACM Web3D, pages 127–135.
Berners-Lee, T. and Connolly, D. (1995). Hypertext markup
language – 2.0. Technical Report 1866, RFC Editor.
https://rfc-editor.org/rfc/rfc1866.txt.
Bostock, M. and Heer, J. (2009). Protovis: A graphical
toolkit for visualization. IEEE TVCG, 15(6):1121–
1128.
Bostock, M., Ogievetsky, V., and Heer, J. (2011). D3 data-
driven documents. IEEE TVCG, 17(12):2301–2309.
Bruls, M., Huizing, K., and van Wijk, J. (2000). Squarified
Treemaps. In Proc. EG Data Visualization, pages 33–
42.
Carpendale, M. S. T. (2003). Considering visual variables
as a basis for information visualization. Technical re-
port, University of Calgary, Canada. Nr. 2001-693-14.
Caudwell, A. H. (2010). Gource: Visualizing software ver-
sion control history. In Proc. ACM OOPSLA, pages
73–74.
Chazard, E., Puech, P., Gregoire, M., and Beuscart, R.
(2006). Using Treemaps to represent medical data.
IOS Studies in Health Technology and Informatics,
124:522–527.
Chinnici, R., Moreau, J.-J., Ryman, A., and Weerawa-
rana, S. (2007). Web Services Description Lan-
guage (WSDL) Version 2.0 Part 1: Core Language.
http://www.w3.org/TR/2007/REC-wsdl20-20070626.
Chomsky, N. (1965). Aspects of the Theory of Syntax. The
MIT Press.
Discher, S., Richter, R., Trapp, M., and D
¨
ollner, J. (2019).
Service-Oriented Mapping, chapter Service-Oriented
Processing and Analysis of Massive Point Clouds in
Geoinformation Management, pages 43–61. Springer
International Publishing.
Ferraiolo, J., Jackson, D., and Fujisawa, J. (2003). Scala-
ble Vector Graphics (SVG) 1.1 Specification. Techni-
cal report, W3C. http://www.w3.org/TR/2003/REC-
SVG11-20030114/.
Fielding, R. T. (2000). REST: Architectural Styles and
the Design of Network-based Software Architectures.
PhD thesis, University of California, Irvine.
Haber, R. B. and McNabb, D. A. (1990). Visualization Idi-
oms: A Conceptual Model for Scientific Visualization
Systems. IEEE Computer Society Press.
Hadley, M., Gudgin, M., Karmarkar, A., Mendelsohn,
N., Nielsen, H. F., Lafon, Y., and Moreau, J.-
J. (2007). SOAP version 1.2 part 1: Messa-
ging framework (second edition). Technical report,
W3C. http://www.w3.org/TR/2007/REC-soap12-
part1-20070427/.
Hadley, M. J. (2006). Web application description language
(WADL). Technical report, Sun Microsystems Inc.
Hagedorn, B., Coors, V., and Thum, S. (2017).
OGC 3D portrayal service standard. Techni-
cal report, Open Geospatial Consortium.
http://docs.opengeospatial.org/is/15-001r4/15-
001r4.html.
Hahn, S. and D
¨
ollner, J. (2017). Hybrid-Treemap layouting.
In Proc. EG EuroVis, pages 79–83.
Heer, J., Card, S. K., and Landay, J. A. (2005). Prefuse:
A toolkit for interactive information visualization. In
Proc. ACM CHI, pages 421–430.
Holten, D. (2006). Hierarchical edge bundles: Visualiza-
tion of adjacency relations in hierarchical data. IEEE
TVCG, 12(5):741–748.
Jern, M., Rogstadius, J., and
˚
Astr
¨
om, T. (2009). Treemaps
and choropleth maps applied to regional hierarchical
statistical data. In Proc. IEEE iV, pages 403–410.
Design and Implementation of Web-based Hierarchy Visualization Services
151

Johnson, B. and Shneiderman, B. (1991). Tree-maps: A
space-filling approach to the visualization of hierar-
chical information structures. In Proc. IEEE Visuali-
zation, pages 284–291.
Kleiberg, E., van de Wetering, H., and van Wijk, J. J.
(2001). Botanical visualization of huge hierarchies.
In Proc. IEEE InfoVis, pages 87–94.
Koller, D., Turitzin, M., Levoy, M., Tarini, M., Croccia, G.,
Cignoni, P., and Scopigno, R. (2004). Protected inte-
ractive 3d graphics via remote rendering. ACM ToG,
23(3):695–703.
Kruskal, J. B. and Landwehr, J. M. (1983). Icicle plots: Bet-
ter displays for hierarchical clustering. The American
Statistician, 37(2):162–168.
Limberger, D. and D
¨
ollner, J. (2016). Real-time rendering
of high-quality effects using multi-frame sampling. In
ACM SIGGRAPH Posters, page 79. ACM.
Limberger, D., Fiedler, C., Hahn, S., Trapp, M., and
D
¨
ollner, J. (2016a). Evaluation of sketchiness as a
visual variable for 2.5d treemaps. In Proc. IEEE iV,
pages 183–189.
Limberger, D., Gropler, A., Buschmann, S., D
¨
ollner, J., and
Wasty, B. (2018). OpenLL: an API for dynamic 2d
and 3d labeling. In Proc. IEEE iV, pages 175–181.
Limberger, D., Scheibel, W., Lemme, S., and D
¨
ollner, J.
(2016b). Dynamic 2.5d treemaps using declarative 3d
on the web. In Proc. ACM Web3D, pages 33–36.
Limberger, D., Scheibel, W., Trapp, M., and D
¨
ollner, J.
(2017). Mixed-projection treemaps: A novel per-
spective on treemaps. In Proc. IEEE iV, pages 164–
169.
Limberger, D., Wasty, B., Tr
¨
umper, J., and D
¨
ollner, J.
(2013). Interactive software maps for web-based
source code analysis. In Proc. ACM Web3D, pages
91–98.
Luboschik, M. and Schumann, H. (2007). Explode to ex-
plain – illustrative information visualization. In Proc.
IEEE iV, pages 301–307.
Mesnage, C. and Lanza, M. (2005). White coats: Web-
visualization of evolving software in 3d. In Proc.
IEEE VISSOFT, pages 1–6.
Mwalongo, F., Krone, M., Reina, G., and Ertl, T. (2016).
State-of-the-art report in web-based visualization. EG
CGF, 35(3):553–575.
Nelson, B. J. (1981). Remote Procedure Call. PhD thesis,
Carnegie Mellon University.
Park, D., Drucker, S. M., Fernandez, R., and Niklas, E.
(2018). ATOM: A grammar for unit visualizations.
IEEE TVCG, 24(12):3032–3043.
Richter, M., S
¨
ochting, M., Semmo, A., D
¨
ollner, J., and
Trapp, M. (2018). Service-based Processing and Pro-
visioning of Image-Abstraction Techniques. In Proc.
WCSG, pages 79–106.
Roberts, R. C. and Laramee, R. S. (2018). Visualising busi-
ness data: A survey. MDPI Information, 9(11):285;1–
54.
Robertson, G. G., Mackinlay, J. D., and Card, S. K. (1991).
Cone trees: Animated 3d visualizations of hierarchi-
cal information. In Proc. ACM CHI, pages 189–194.
Satyanarayan, A., Moritz, D., Wongsuphasawat, K., and
Heer, J. (2017). Vega-Lite: A grammar of interactive
graphics. IEEE TVCG, 23(1):341–350.
Scheibel, W., Trapp, M., and D
¨
ollner, J. (2016). Interactive
revision exploration using small multiples of software
maps. In Proc. ScitePress IVAPP, pages 131–138.
Scheibel, W., Weyand, C., and D
¨
ollner, J. (2018). EvoCells
– a treemap layout algorithm for evolving tree data. In
Proc. ScitePress IVAPP, pages 273–280.
Schulz, H.-J. (2011). Treevis.net: A tree visualization refe-
rence. IEEE CG&A, 31(6):11–15.
Schulz, H.-J., Akbar, Z., and Maurer, F. (2013). A genera-
tive layout approach for rooted tree drawings. In Proc.
IEEE PacificVIS, pages 225–232.
Schulz, H.-J., Hadlak, S., and Schumann, H. (2011). The
design space of implicit hierarchy visualization: A
survey. IEEE TVCG, 17(4):393–411.
Schulz, H.-J. and Schumann, H. (2006). Visualizing graphs
– a generalized view. In Proc. IEEE iV, pages 166–
173.
Slingsby, A., Dykes, J., and Wood, J. (2008). Using tree-
maps for variable selection in spatio-temporal visuali-
sation. Palgrave IVS, 7(3):210–224.
Slingsby, A., Dykes, J., and Wood, J. (2009). Configu-
ring hierarchical layouts to address research questi-
ons. IEEE TVCG, 15(6):977–984.
Sons, K., Klein, F., Rubinstein, D., Byelozyorov, S., and
Slusallek, P. (2010). Xml3d: Interactive 3d graphics
for the web. In Proc. ACM Web3D, pages 175–184.
Stylos, J. and Myers, B. (2007). Mapping the space of api
design decisions. In Proc. IEEE VL/HCC, pages 50–
60.
Tak, S. and Cockburn, A. (2013). Enhanced spatial stabi-
lity with hilbert and moore treemaps. IEEE TVCG,
19(1):141–148.
Tu, Y. and Shen, H. (2008). Visualizing changes of hierar-
chical data using treemaps. IEEE TVCG, 13(6):1286–
1293.
Vernier, E. F., Telea, A. C., and Comba, J. (2018). Quan-
titative comparison of dynamic treemaps for software
evolution visualization. In Proc. IEEE VISSOFT, pa-
ges 96–106.
Webber, J., Parastatidis, S., and Robinson, I. (2010). REST
in Practice: Hypermedia and Systems Architecture.
O’Reilly Media, 1st edition.
Wood, J., Brodlie, K., Seo, J., Duke, D., and Walton, J.
(2008). A web services architecture for visualization.
In Proc. IEEE eScience, pages 1–7.
IVAPP 2019 - 10th International Conference on Information Visualization Theory and Applications
152
