
Case Study of Interrelation between Brain-Computer Interface based
Multimodal Metric and Heart Rate Variability
V. S. Vasilyev, V. I. Borisov, A. M. Syskov and V. S. Kublanov
Research Medical and Biological Engineering Centre of High Technologies, Ural Federal University,
Mira Str., 32, Yekaterinburg, 620002, Russia
Keywords: Brain-Computer Interface, Heart Rate Variability, Multimodal Metric, Vestibular Apparatus.
Abstract: The Brain-Computer Interface (BCI) can be used for evaluation of the state of individuals during everyday
routines. As shown in previous works, there is a relationship between the BCI multimodal metric with
functional states of human. We have used power of Theta, Alpha, Beta low and Beta high
electroencephalography rhythms and head motion data signals for multimodal metric. Heart Rate Variability
(HRV) is common medical method for functional state assessment. In this paper the results of interrelation
estimation between multimodal metric and HRV are shown. We used Pearson correlation coefficient (PCC)
for estimates of interrelation between multimodal metric and HRV. It was found, the best results for estimates
of parasympathetic part of the autonomic nervous system and suprasegmental regulation HRV have value of
PCC more then critical value for Pearson correlation.
1 INTRODUCTION
Human body is a phenomenally complex system.
Interwoven with a multitude of physiological and
mental processes, that overlap and influence one
another in many different ways, it is similar in its
nature to the Indra’s net – each vertex is beaded with
many multifaceted jewels, and each jewel is reflected
in all of the other jewels (Robertson, 2014).
Given such fractal-like, interconnected structure
of our organisms, it would be fair to say that
assessment of subject’s functional state and mental
status is a non-trivial task (Kublanov et al., 2015).
Examined signals differs one from another both in
their characteristics and origins, and, more often than
not, are contaminated with unwanted noise and
artefacts. In turn, extracted signal’s features, that
contain useful insights and information, require usage
of sophisticated statistical and mathematical
apparatus in order to be properly interpreted
(Kublanov et al., 2016).
Despite such associated difficulties, there’s a
common need in assessment of mental and functional
state of a subject, in real-life conditions for healthcare
and telemedicine application (Syskov et al., 2017).
Widely accepted methodologies used for that are
electroencephalography (EEG) and electrocardio-
graphy (ECG), which, while recording signals from
different organs (brain and heart, respectively), deal
with the same underlying physiological phenomena –
electrical activity of our bodies.
Another very common modality used in that
setting is the motion activity. In the constant presence
of the gravitational force, our bodies maintain
continuous state of three-dimensional equilibrium.
This self-balancing process produces various bio-
mechanical oscillations (for example tremors,
clonuses and fasciculations) and shapes our posture –
all are indicators of subject’s state. “Movement is
life” indeed (Borisov et al., 2017). In (Borisov et al.,
2018) integrated feature space EEG and motion
activity for multimodal metric calculation are used.
Statistically significant changes in the assessment of
the athlete's functional state for the stages are shown.
In this research, we are testing the hypothesis of
existence of common factor between heart rate
variability (HRV) and multimodal metric in real-time
conditions. To test this hypothesis, we conducted a set
of small experiments, whose details, methodologies
and final results are described as follows.
532
Vasilyev, V., Borisov, V., Syskov, A. and Kublanov, V.
Case Study of Interrelation between Brain-Computer Interface based Multimodal Metric and Heart Rate Variability.
DOI: 10.5220/0007694505320538
In Proceedings of the 12th International Joint Conference on Biomedical Engineering Systems and Technologies (BIOSTEC 2019), pages 532-538
ISBN: 978-989-758-353-7
Copyright
c
2019 by SCITEPRESS – Science and Technology Publications, Lda. All rights reserved
2 MATERIALS AND METHODS
In this research, widespread wireless Emotiv EPOC+
headset was used for EEG and motion data
acquisition (Borisov et al., 2017). Its technical
specifications are presented in Table 1.
Table 1: Emotiv EPOC+ technical specifications.
Number of channels
14 (CMS/DRL references, P3/P4
locations
)
Channel names (International 10-
20 scheme
)
AF3, F7, F3, FC5, T7, P7, O1, O2,
P8, T8, FC6, F4, F8, AF4
Sam
p
lin
g
metho
d
Se
q
uential sam
p
lin
g
, sin
g
le ADC
Sam
p
lin
g
rate 128 SPS
(
2048 Hz internal
)
Resolution
14 bits 1 LSB = 0.51 μV (16 bit ADC,
2 bits instrumental noise floor
discarded
)
Bandwidth
0.2 - 45Hz, digital notch filters at
50Hz and 60Hz
Filtering Built in digital 5th order Sinc filte
r
D
y
namic ran
g
e 8400
μ
V
(pp)
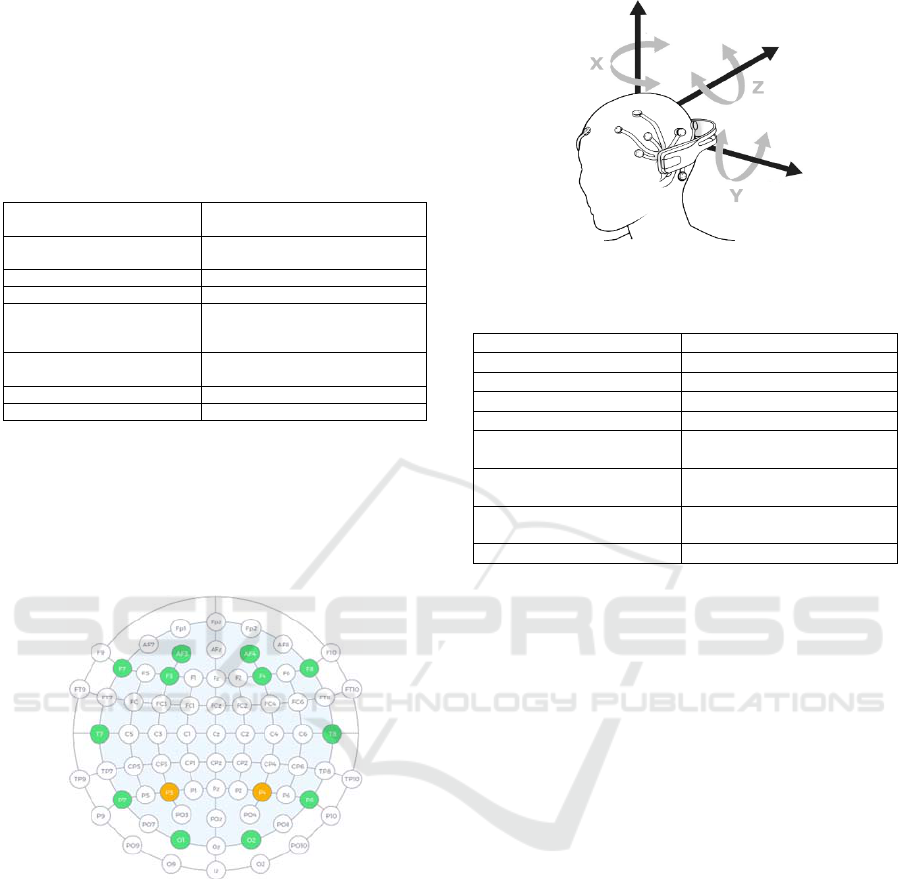
EPOC+ headset provides information about the
induced electrical activity of the brain from 14
channels. This information contains the voltage value
for each electrode with a sampling frequency of 128
Hz. Electrode placement locations are shown in
Figure 1.
Figure 1: Emotiv EPOC+ electrode locations in standard
10-20 montage scheme.
In addition to that, headset also provides data from
a three-axis accelerometer, which allows assessment
of the movement of the headset in space during the
experiment.
Recorded signal contains the values of the
acceleration for each axis and the data recording time.
The scheme of the accelerometer axes is shown in
Figure 2.
Psycho-physiological telemetric system "Rehacor”
(made by Medicom MTD, Ltd., Russia, see technical
specifications in Table 2) with a set of cardiograph
electrode terminals was used for ECG signal
acquisition.
Figure 2: Scheme of accelerometer axes.
Table 2: “Rehacor” technical specifications.
Number of channels 4
Sampling rate 250 Hz
Resolution 24 bits
Dynamic range 5 - 8000 μV (pp)
ECG channel noise ≤ 2 μV (pp)
Low-pass filter cutoff
frequencies
30; 40; 100 Hz
High-pass filter cutoff
frequencies
0.05; 0.16; 0.5; 1.6; 5; 16 Hz
Callibration signal
5 Hz sine wave; 1 μV
amplitude
HRV calculation range 45 - 240 bp
m
2.1 Experiment Setup
A series of experiments with the equipment described
above was carried out on 9 healthy subjects in the age
group of 23±3 years, to study parameters which
would describe different functional and mental states
of a subject. Each experiment contained five stages as
described further.
At the stage of functional rest (RS), the subject sits
opposite the monitor of the personal computer and
looks at the black screen.
Stage of TOVA test (Test of Variables of
Attention) is an intellectual test for the variability of
attention (T1 and T2). It is a mental test to evaluate
the function of active attention and control reactions.
The Pebl software was used for the test procedure.
During the test, squares and circles appears
alternately at the top and bottom of the computer
screen. The task of the subject is to press a space on
the keyboard when a square appears at the top of the
screen.
At the stage of hyperventilation (HL), the subject
frequently breathes, imitating breathing during heavy
physical load. The final stage is aftereffect period
(AE). The time-line of the experiment is shown in
Figure 3.
Raw EEG, HRV and movement data were
recorded and collected during the experiments, before
being processed as described in the next sections.
Case Study of Interrelation between Brain-Computer Interface based Multimodal Metric and Heart Rate Variability
533
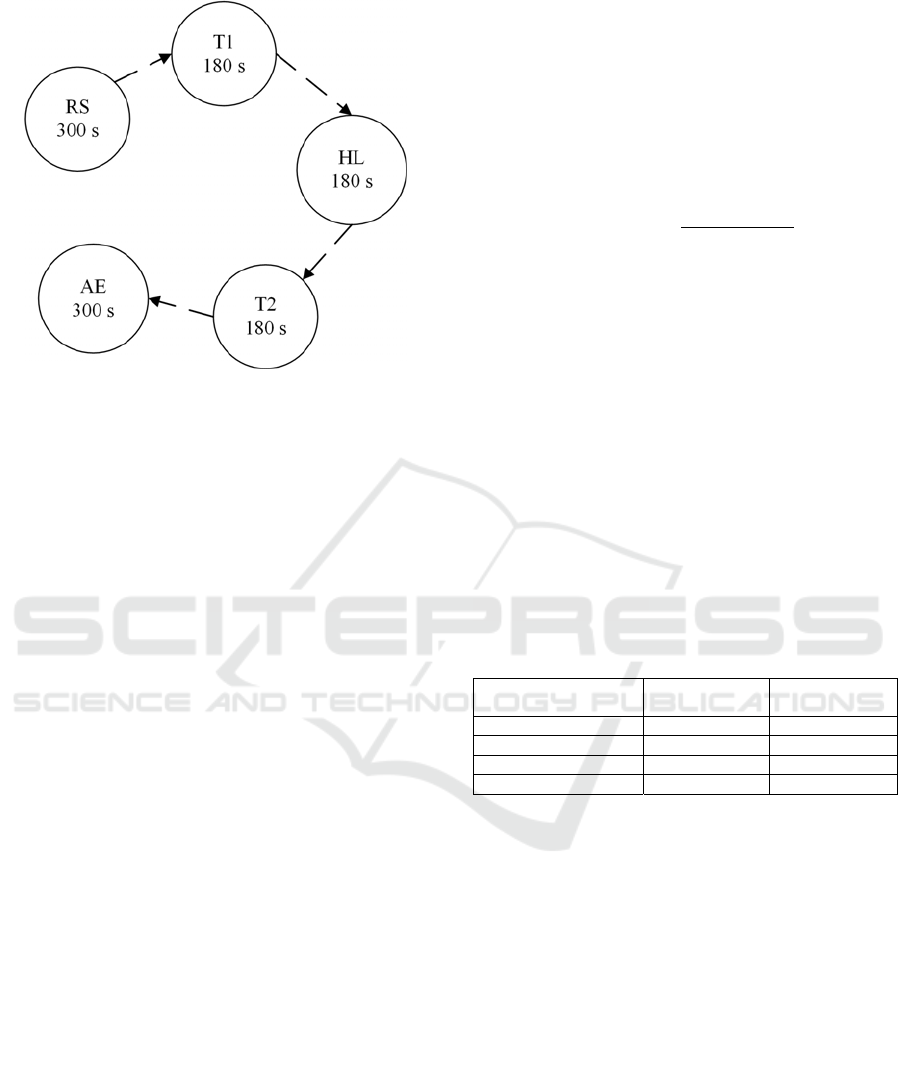
Figure 3: Time-line of the experiment.
2.2 Motion Data Processing
The three-axis accelerometer provides information on
the magnitude of the acting accelerations along the
three axes, respectively. The acceleration value for
each axis is registered through equal time intervals.
The signal measured by the accelerometer is a linear
sum of three components (Borisov et al., 2018):
Body Acceleration Component (BA) is
acceleration resulting from body movement;
Gravitation Acceleration Component (GA) is
acceleration resulting from gravity;
Noise inherent to the measuring system.
GA provides information about the spatial orientation
of the device, and the BA provides information about
the movement of the device and subject’s head
movement.
The frequency spectrum of accelerations caused
by human motion is located in the range from 0 to 20
Hz. The gravitational component is located in the
range from 0 to 0.3 Hz. The component containing
instrumental noise is located generally in the range
above 20 Hz.
To isolate the motion component from the signal,
a second-order Butterworth window filter with
frequencies from 0.3 to 20 Hz was used.
The most relevant motion data (MD) features of
the accelerometer signal are (Borisov et al., 2018):
Maximum and minimum values of acceleration;
Average value of acceleration at a given time
interval;
Standard deviation (STD);
Zero cross rate (ZCR);
Mean ZCR;
Mean energy for a current stage;
Activity (in the equation below);
Average activity time.
Because of the discrete nature of the accelerometer
signal, ZCR was calculated as the number of sections
where the previous sign differs from the current sign.
Activity, the value characterizing the change in the
signal over time, was calculated by the following
formula (1):
,
(1)
where
.
The average activity time is the ratio of the total
activity time, which exceeds the average level by 10%,
to the number of stages not exceeding this level.
2.3 HRV Signal Processing
Frequency-domain analysis method was applied to
ECG signal and HRV indexes were calculated.
Artifact removal was carried out using 3-sigma
rule and moving window algorithm. Mean window
value was used for value restoring. Spectral
characteristics of frequency ranges, depicted in Table
3, were used for subject's functional state assessment
(Borisov et al., 2017).
Table 3: HRV frequency ranges.
Title Abbreviation
Frequency
range (Hz)
High frequency HF 0.4
–
0.15
Low frequency LF 0.15
–
0.04
Very low frequency VLF 0.04
–
0.003
Ultra low frequency ULF < 0.003
ULF range is not used in analysis of short-term
recordings (3 - 5 minutes in our case). Total spectrum
power (TP) is defined a sum of powers in HF, LF and
VLF frequency ranges.
Normalized power values in each frequency range
(that is HF/TP, LF/TP and VLF/TP) are defined as a
percentage ratio of the total power of the spectrum to
TP value.
The activity of the parasympathetic link of the
autonomic nervous system and the activity of the
autonomous regulation loop are characterized by the
power of HF/TP index. LF/TP index characterizes the
state of the sympathetic center of vascular tone
regulation. VLF/TP index is caused by the influence
on the rhythm of the heart of the supra-segmental
regulation level since the amplitude of these waves is
closely related to the mental stress and the functional
state of the cerebral cortex.
RAIDERS 2019 - Special Session on Real-world Assessment of Individuals During Everyday Routines
534
On all stages of our experiment, sliding window
with 100 seconds size was used for assessment of
HF/TP, LF/TP and VLF/TP parameters.
2.4 EEG Signal Processing
At the first stage of EEG signal processing, all data
were transformed to the frequency domain. To
separate EEG rhythms (see Table 4) from the signal,
a second-order Butterworth bandpass filter was
applied.
Table 4: EEG frequency ranges.
Title Frequency range (Hz)
θ 4
–
7
α 7
–
15
β
lo
w
15
–
25
β
hi
g
h
25
–
31
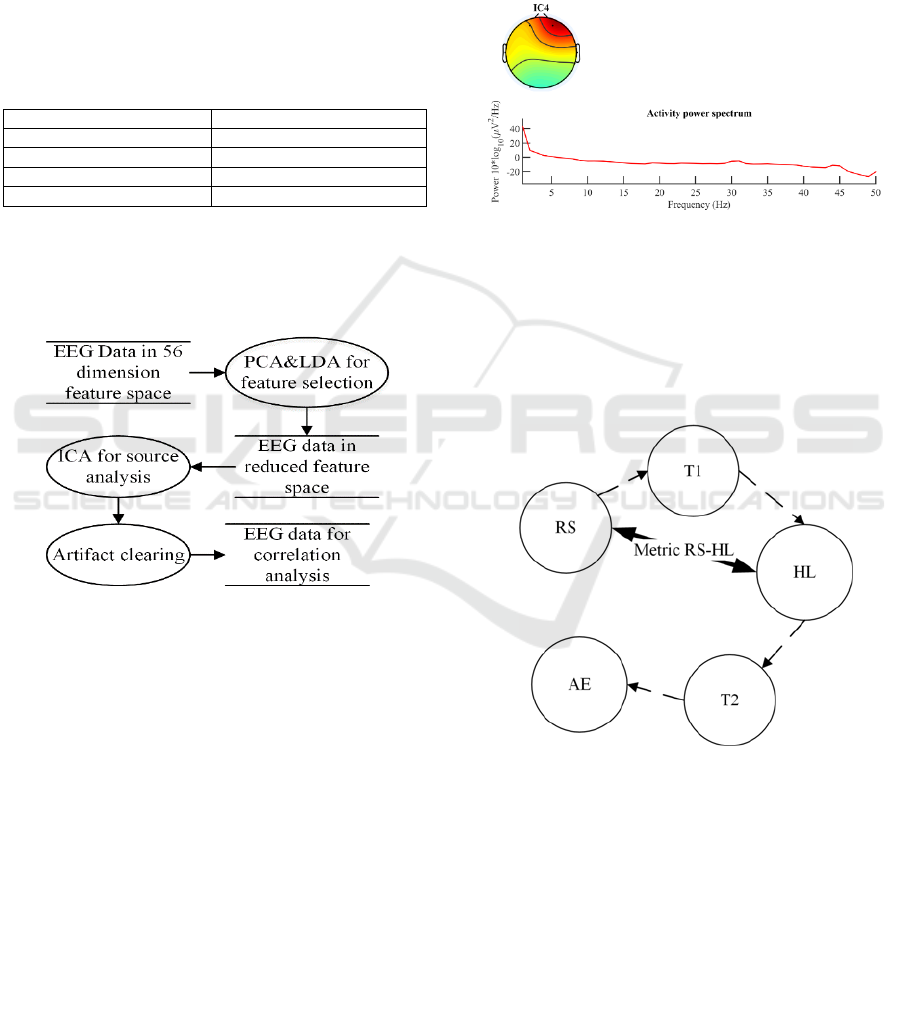
EEG data in frequency domain is described as 56-
dimension (14 channels, 4 frequency ranges each)
feature space. This data was passed through EEG
signal processing pipeline, as depicted in Figure 4.
Figure 4: EEG signal processing.
Initially, Principal Component Analysis (PCA)
and Linear Discriminant Analysis (LDA) methods
were used for dimensionality reduction and extraction
of informative signal (Jolliffe, 2014) and
(McLachlan,1992) from the input data.
As a result of PCA and LDA application (covered
in more detail in (Islam, 2010)) EEG feature vector
was reduced to 10 components, namely AF3, T7, O1,
T8, AF4 channels with Theta and Alpha frequency
bands.After dimensionality reduction and feature
selection step, Independent Component Analysis
(ICA) was used for separation of EEG signal from
background and inherit system noise. EEGlab
scientific package, in addition with supplied
guidelines (SCCN: Independent Component
Labeling), was used for this task.
Based on spectral analysis of extracted
components, frequency bands most likely containing
artifacts were selected, on each stage of experiment.
All frequency spectra then were analyzed for
presence of eye-movement overshoots, with 1 second
size window using 3-sigma method. Signal was
filtered in case of overshoot presence. Example of eye
movement artifact component is shown in Figure 5.
Figure 5: Eye component of EEG.
2.5 Creation of Multimodal Metric
By “metric”, we mean a measure that gives a scalar
estimate of “human proximity” to one of the two
states, in real time. In this work metric for RS and HL
stages are calculated (as shown on Figure 6).
Figure 6: Metric RS-HL definition.
Integrated feature vector is created by
concatenation of motion modalities and bio-electrical
activity vectors. The model of integrated feature
vector is depicted in Figure 7.
After construction, 32 component vector was
weighted with coefficients of hyperplane PD
separating resting (RS) and hyperventilation stages
(HV) for calculating scalar value for each time point,
using machine learning as described in (Borisov et al.,
2018).
Case Study of Interrelation between Brain-Computer Interface based Multimodal Metric and Heart Rate Variability
535
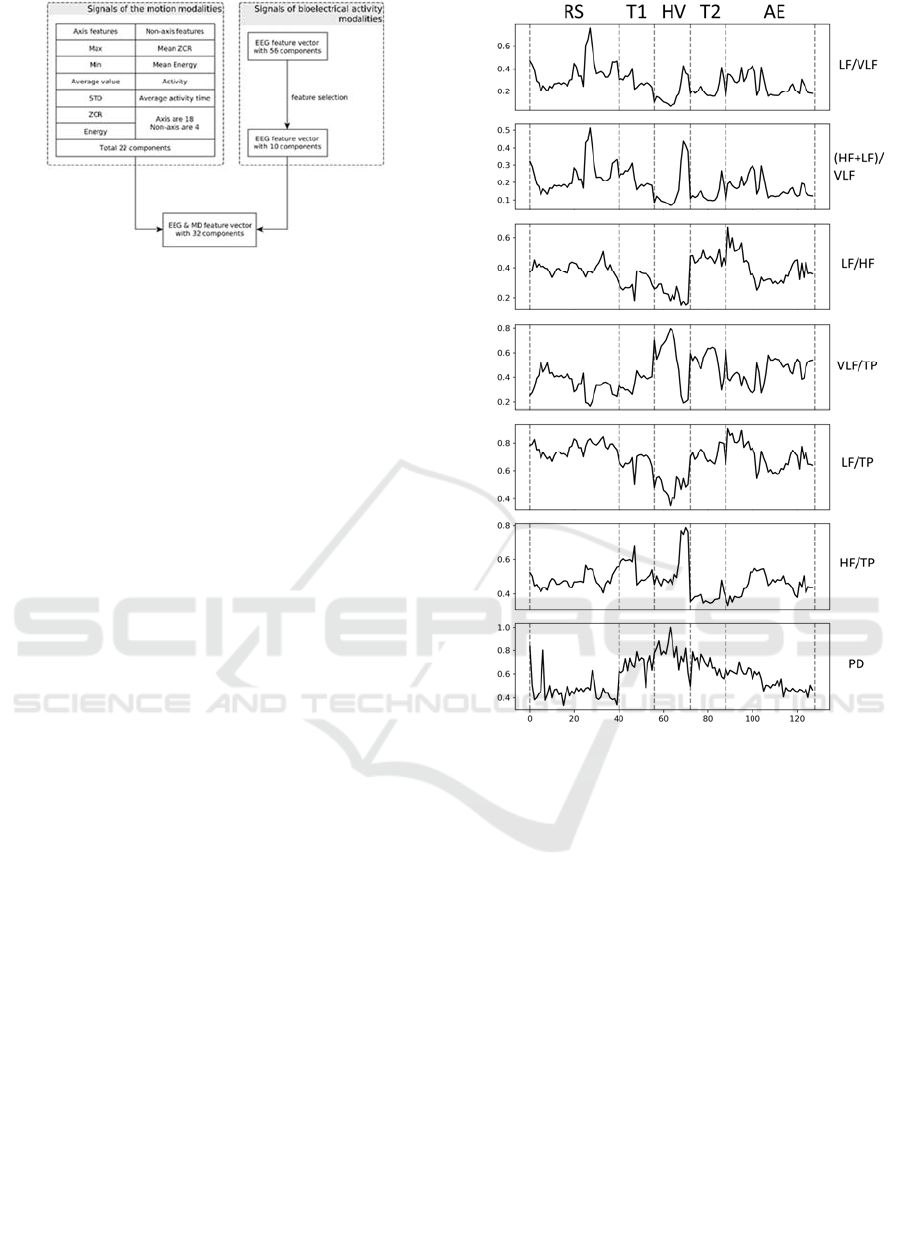
Figure 7: Model of integrated feature vector.
3 RESULTS AND DISCUSSION
Both coefficients of multimodal metric and HRV
indexes were calculated using sliding window with
100 seconds size and 5 seconds step. As a result of
data processing pipeline, time series with the
following structure were obtained:
3 minute stages (T1, HV and T2) –
16 data points;
5 minute stages (RS and AE) –
40 data points;
Total record of all stages contains 128
(40 × 2 + 16 × 3) data points;
For each subject, a total of 8 vectors (7 HRV
indexes and 1 PD coefficient) were calculated.
Examples of plotted HRV indexes and normalized
coefficient of multimodal metric PD are shown on
Figure 8.
Visual analysis of plotted data indicates that there
exists a dynamic that reflects changes in the
functional state of a subject during the experiment,
both in multimodal metric and in calculated HRV
indexes.
To test our initial hypothesis of existence of
common factor between heart-rate variability signal
and time-series of multi-modal metric, Pearson
correlation coefficients (PCC) were calculated for RS
and HV time-series.
Statistical significance of correlation coefficients
was evaluated. Based on table values from (Förster
and Rönz, 1979) for p=0.05:
Sample size N is 112 (56 × 2);
Number of degrees of freedom DF is 110
(N – 2);
For given value of DF, critical value of correlation
coefficient is 0.2.
Figure 8: HRV indexes and multimodal metric (PD).
Upon evaluation of PCC correlation coefficients,
it was found that data series, consisted of
concatenated RS and HV intervals, has a statistically
significant Pearson’s correlation value. Results are
shown on the graphical plot below (see Figure 9),
with absolute correlation values on horizontal axis
and calculated HRV indexes on vertical axis; each
subject is depicted with unique color point on each
stage.
The presence of a significant correlation allows us
to formulate a hypothesis about the presence of
factors that are common to the parameters of the
functioning of the central nervous system, the
autonomic nervous system and the vestibular
apparatus, which can be identified using the proposed
multimodal metric.
The explanation of such factors may be based on
the following phenomena identified during the
research: the spectral components of the HRV signal
in the VLF frequency band changed significantly,
RAIDERS 2019 - Special Session on Real-world Assessment of Individuals During Everyday Routines
536

Figure 9: Correlation of vector of concatenated RS and HV intervals with HRV indexes.
which can be explained by the influence of the
supersegmental control of the autonomic nervous
system on the heart rate.
4 CONCLUSION
In this paper, we verified a multimodal metric of
Brain-Computer Interface. For verification, the
assessment of the functional state was carried out
using the parameters of HRV. Integrated feature
space for accelerometer and EEG allows to get more
accuracy and accessibility for different function states.
Multimodal metric based on this feature space useful
for assets “human proximity” to desired function
level during training or rehabilitation.
We used PCC for estimates of interrelation
between multimodal metric and HRV. The common
correlation factor develops itself individually in each
subject. Thus, it may serve as a diagnosis feature for
functional processes that occur in subject’s body. It’s
tightly bound to the sustenance of the homeostatic
state of individuals (Yee and Rabinstein, 2010).
Since the study was conducted on relatively
healthy people, such a factor may be the state of
human health. Further studies involving people with
different nosologies and neurophysiological states.
There are should allow for the identification of
additional of physiological patterns. For example, the
above results can be developed in the development of
methods for assessing changes in the functional state
of a person with sympathetic correction for patients
with depression and disorders of the function of the
vestibular apparatus (Kublanov et al., 2018).
Further investigations need to be carried out in
order to pinpoint the nature and origins of this factor
for real world assessment of humans.
ACKNOWLEDGMENT
The work was supported by Act 211 Government of
the Russian Federation, contract № 02.A03.21.0006.
REFERENCES
Borisov, V., Syskov, A., Kublanov, V., 2018. Functional
state assessment of an athlete by means of the brain-
computer interface multimodal metrics. In IFMBE
Proceedings, vol. 68(3), pp. 71-75.
Borisov, V., Syskov, A., Tetervak, V., Kublanov, V. 2017.
Mobile brain-computer interface application for mental
status evaluation. In Proceedings of 2017 International
Multi-Conference on Engineering, Computer and
Information Sciences, SIBIRCON, pp. 550–555.
Förster, E., Rönz, B. 1979. Methods of Correlation and
Regression Analysis, Verlag Die Wirtschaft, Berlin.
Islam, M. K., Rastegarnia, A., Yang, Z., 2016. Methods for
artifact detection and removal from scalp EEG: A
review. Neurophysiol. Clin. Neurophysiol., vol. 46, no.
4, pp. 287–305.
Jolliffe, I., 2014. Principal Component Analysis, in Wiley
StatsRef: Statistics Reference Online, John Wiley &
Sons, Ltd.
Kublanov, V.S., Babich, M.V., Petrenko, T.S., 2018. New
Principles for the Organization of Neurorehabilitation.
Biomed. Eng., vol. 52, no. 1, pp. 9–13.
Kublanov, V.S., Borisov, V.I., Dolganov, A.Y., 2015. The
interface between the brain microwave radiation and
autonomic nervous system. In 2015 7th International
IEEE/EMBS Conference on Neural Engineering (NER),
pp. 922–925.
Kublanov, V.S., Borisov, V.I., Dolganov, A.Y., 2016.
Application of Multifractal Formalism in Study of the
Role of Autonomic Regulation in Formation of Intrinsic
Electromagnetic Radiation of the Brain, Biomed. Eng.,
vol. 50, no. 1, pp. 30–34.
McLachlan, G.J., 1992. Discriminant Analysis and
Statistical Pattern Recognition: McLachlan/
Case Study of Interrelation between Brain-Computer Interface based Multimodal Metric and Heart Rate Variability
537

Discriminant Analysis & Pattern Recog. Hoboken, NJ,
USA: John Wiley & Sons, Inc.
Robertson, R., 2014. As Above, So Below. Psychol.
Perspect., vol. 57, no. 4, pp. 403–425.
SCCN: Independent Component Labeling. [Online].
Available: https://labeling.ucsd.edu/tutorial/labels.
[Accessed: 14-Oct-2018].
Syskov, A., Borisov, V., Tetervak, V., Kublanov, V, 2018.
Feature Extraction and Selection for EEG and Motion
Data in Tasks of the Mental Status Assessing. In
Proceedings of BIOSTEC 2018: 11th International
Joint Conference on Biomedical Engineering Systems
and Technologies, pp. 164–172.
Syskov, A.M., Borisov, V.I., Kublanov, V.S., 2017.
Intelligent Multimodal User Interface for Telemedicine
Application. In Proceedings of 2017 25TH
Telecommunication Forum (TELFOR), pp. 689-692.
Yee, A.H., Rabinstein, A.A., 2010. Neurologic
presentations of acid-base imbalance, electrolyte
abnormalities, and endocrine emergencies. Neur. Clin.,
vol. 28 (1) pp. 1–16.
RAIDERS 2019 - Special Session on Real-world Assessment of Individuals During Everyday Routines
538
