
Processing the Results of Electroencephalography for Patients
Suffering from Depression after Neuro-electrostimulation Course:
Case Study
Vladimir Kublanov and Anton Dolganov
Research Medical and Biological Engineering Centre of High Technologies, Ural Federal University,
Mira 19, 620002, Yekaterinburg, Russian Federation
Keywords: Neuro-electrostimulation, Neurovisualisation, Electroencephalography, Case Study.
Abstract: The article presented the results of electroencephalography (EEG) signal processing in a case study of
neuro-electrostimulation application for patients suffering from depression. Neuro-electrostimulation was
performed by the SYMPATHOCOR-01 device in two modes - multichannel and single-channel stimulation.
The analysis of changes in the EEG activity maps during neuro-electrostimulation course was carried out.
The common conclusion for all patients is an increase in the homogeneity for the distribution of spectral
power density for EEG signals. A quantitative method for estimating the level of the brain zones activation
was proposed. For patients from the multichannel stimulation group, an increase in the activation level was
observed. It was noted that for patients from the single-channel stimulation group there were zones in which
a significant decrease in the level of activation was observed.
1 INTRODUCTION
The depressive disorder is rapidly spreading of
among the able-bodied population in the developed
countries. This determines the relevance for search
of an effective ways of treatment and rehabilitation
approaches to mitigate this disease. Unfortunetley
the depressive disorder can occur at any age,
resulting in sharp limitation of a person’s adaptation
to constantly changing environmental conditions
(Culpepper et al., 2015).
The problem of depression is primarily
determined by the lack of knowledge about the
pathophysiological mechanisms of this disease.
Recently, in developed countries, number work has
emerged on the use of neuroimaging techniques to
solve this problem. For example, when analyzing
brain activity using fMRI, it was found that,
compared with practically healthy patients, patients
with depression experience different patterns of
impairment of the cerebral cortex during the patient's
life (Schmaal et al., 2017).
The most common approach to normalize and
strengthen the physiological activity of brain tissue
is neuroprotective therapy (Kupfer et al., 2012). This
therapy is mainly implies application of drugs. The
use of drugs does not always exclude side effects.
To a lesser extent, this refers to physiotherapeutic
methods, especially methods that use low-intensity
electric current for stimulation (Cook et al., 2016).
Promising for solving the problems of
neurorehabilitation are technologies in which multi-
electrode stimulation systems are used. This
direction is actively developed in the works of
research teams headed by Y. Danilov and V.S.
Kublanov. There, for neurorehabilitation, a spatially
distributed field of monopolar low-frequency current
pulses is used, the characteristics of which are
similar to endogenous processes in neural networks.
In the known technical implementations of such
devices, either branches of the cranial nerves (PoNS
device (Danilov et al., 2015)) or cervical ganglia of
the sympathetic nervous system (SYMPATHOCOR-
01 device (Kublanov et al., 2017)) are used as
targets for stimulation.
The SYMPATHOCOR -01 device implements
the technology of multichannel neuro-
electrostimulation. This technology allows physician
to manage the activities of conductive formations
and performs the process of neuromodulation.
Medical use of the device SYMPATHOCOR -01 is
implemented as a method of DCASNS - a dynamic
Kublanov, V. and Dolganov, A.
Processing the Results of Electroencephalography for Patients Suffering from Depression after Neuro-electrostimulation Course: Case Study.
DOI: 10.5220/0007695605770582
In Proceedings of the 12th International Joint Conference on Biomedical Engineering Systems and Technologies (BIOSTEC 2019), pages 577-582
ISBN: 978-989-758-353-7
Copyright
c
2019 by SCITEPRESS – Science and Technology Publications, Lda. All rights reserved
577
correction of the activity of the sympathetic nervous
system. The DCASNS method provides correction
of autonomic balance, determined by the ratio
between the activity of the parasympathetic and
sympathetic divisions of the autonomic nervous
system (Petrenko et al., 2015).
The purpose of this work is to process the results
of electroencephalography (EEG) in assessing the
effectiveness of electrical neurostimulation device
SYMPATHOCOR-01 for patients suffering from
depression.
2 MATERIALS AND METHODS
2.1 Case Study Group
The case study involved 6 subjects diagnosed with a
depression. The study was approved by the ethical
committee of the State Scientific-Research Institute
of Physiology & Basic Medicine (Protocol No. 13 of
November 16, 2017).
The subjects were divided into two groups. In the
first group, the neuro-electrostimulation device
SYMPATHOCOR -01 was used in the multichannel
stimulation mode. The upper and middle ganglia of
the sympathetic nervous system were selected as
targets.
In the second group, a neuro-electrostimulator
was used in the single-channel stimulation mode;
descending nerve fibers to the stellate ganglion were
selected as targets.
Table 1 summarize data on the case study group.
Table 1: Case study group data.
Case history Mode
794 multichannel
798 single-channel
864 single-channel
862 multichannel
863 single-channel
865 multichannel
2.2 Study Description
The study used a 126-channel EEG recording
system. The sampling rate was 1000 Hz.
Registration of EEG took place simultaneously with
fMRI studies (Sokolov et al., 2017). During the
study, the subjects lay at rest (Rest State). In the
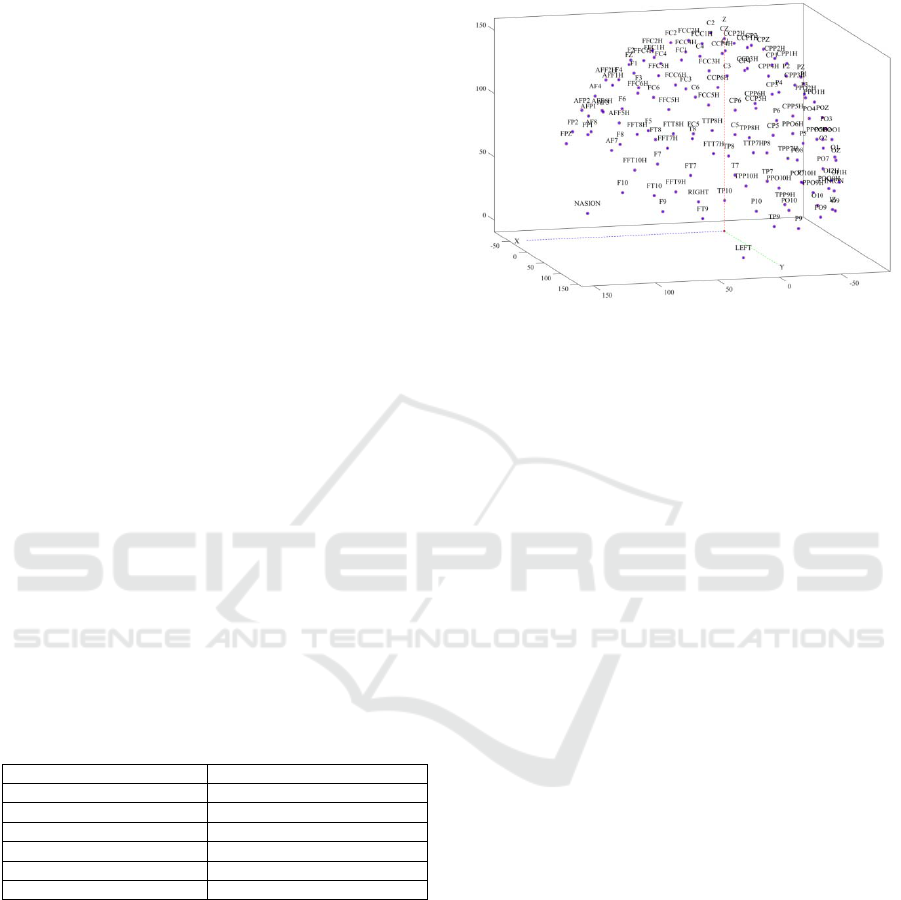
study the electrode location system 10–5, which is a
more dense version of the system 10–20 (Oostenveld
and Praamstra, 2001). An example of the location of
the electrodes in three-dimensional space is
presented in Figure 1.
Figure 1: 3-D representation of the electrode location.
In the present work, the features of EEG signals
recorded during primary studies (prior to the neuro-
electrostimulation course) and after stimulation
procedures.
The time of registration of EEG signals was
about 10 minutes. The first and last minute of the
EEG signals were excluded from the analysis due to
the presence of motion artifacts.
2.3 Data Analysis Methods
To process the EEG signals, is an open source
software toolkit for MATLAB – EEGLAB – was
used. This toolkit is a practical implementation of
the functions and graphic interface used in the
processing and visualization of electrophysiological
signals (Delorme and Makeig, 2004).
After importing the “raw” EEG signals, spectral
powers were evaluated. In this wour, we investigated
four spectral ranges:
• Delta rhythm - from 3 to 4 Hz;
• Theta rhythm - from 4 to 7 Hz;
• Alpha rhythm - from 8 to 15 Hz;
• Beta rhythm - from 16 to 31 Hz;
It should be noted that in the delta rhythm
frequencies below 3 Hz were not analyzed, due to
the presence of noise.
Evaluation of the spectral components in the
EEGLAB is carried out using the function
pop_spectopo(EEG, TIME), where the EEG variable
is a matrix of EEG signals from time for each of 126
channels. The TIME variable contains information
about the beginning and end of the time interval,
within which the spectral component is assessed. In
the present work, the evaluation of the spectral
NNSNT 2019 - Special Session on Non-invaisive Neuro-stimulation in Neurorehabilitation Tasks
578
components was carried out in 10-second windows,
with an overlap of 5 seconds. In total, spectral
indices were obtained for each subject in 80 epochs.
The result of using the pop_spectopo function is the
Spectral Power Density, estimated by the Welch
method, for each channel for all frequencies. The
spectral power estimates are presented on a
logarithmic scale (Welch, 1967).
The power estimation in the studied frequency
ranges was carried out by summation over the
corresponding frequencies. Thus, for each channel,
for each subject, four spectrograms were obtained,
describing the change in spectral power densities by
epochs.
For evaluation of the localization in different
activation zones, it was proposed to group 126 EEG
channels into 11 zones - frontal (left and right - F_L,
F_R), temporal (left and right - T_L, T_R), central
(left and right - C_L, C_R), occipital (left and right -
P_L, P_R), parietal (left and right - O_L, O_R).
Separately zone Z was considered, which took into
account the channels located on the central axis. The
division of the EEG channels into zones is presented
in Table 2.
Table 2: Distribution of channels by zones.
Zone EEG channel
Z 'FPZ' 'FZ' 'CPZ' 'CZ' 'IZ' 'PZ' 'OZ' 'POZ'
F_R
'AF3' 'AF7' 'AFF1H' 'AFF5H' 'AFP1' 'F1' 'F3' 'F5' 'F7'
'F9' 'FFC1H' 'FFC3H' 'FFC5H' 'FP1'
F_L
'AF4' 'AF8' 'AFF2H' 'AFF6H' 'AFP2' 'F10' 'F2' 'F4' 'F6'
'F8' 'FFC2H' 'FFC4H' 'FFC6H' 'FP2'
T_R
'FFT7H' 'FFT9H' 'FT7' 'FT9' 'FTT7H' 'T7' 'TP7' 'TP9'
'TPP7H' 'TPP9H' 'TTP7H'
T_L
'FFT10H' 'FFT8H' 'FT10' 'FT8' 'FTT8H' 'T8' 'TP10'
'TP8' 'TPP10H' 'TPP8H' 'TTP8H'
C_R
'FC1' 'FC3' 'FC5' 'FCC1H' 'FCC3H' 'FCC5H' 'C1' 'C3'
'C5' 'CCP1H' 'CCP3H' 'CCP5H' 'CP1' 'CP3' 'CP5'
C_L
'FC2' 'FC4' 'FC6' 'FCC2H' 'FCC4H' 'FCC6H' 'C2' 'C4'
'C6' 'CCP2H' 'CCP4H' 'CCP6H' 'CP2' 'CP4' 'CP6'
P_R
'CPP1H' 'CPP3H' 'CPP5H' 'P1' 'P3' 'P5' 'P7' 'P9'
'PPO1H' 'PPO5H' 'PPO9H'
P_L
'CPP2H' 'CPP4H' 'CPP6H' 'P10' 'P2' 'P4' 'P6' 'P8'
'PPO10H' 'PPO2H' 'PPO6H'
O_R 'O1' 'O9' 'OI1H' 'PO3' 'PO7' 'PO9' 'POO1' 'POO9H'
O_L 'O10' 'O2' 'OI2H' 'PO10' 'PO4' 'PO8' 'POO10H' 'POO2'
The estimation of changes in the level of
activation in the zone is proposed. Initial data were
used to estimate the average level of the spectrogram
value in the zone over the entire time interval for all
channels (activation threshold). Then, for each time
epoch, the proportion of channels that exceed the
activation threshold was estimated. The same
activation threshold was used in the analysis of
signals recorded after neuroelectrostimulation
procedures.
3 RESULTS
3.1 Power Spectral Density
Visualization
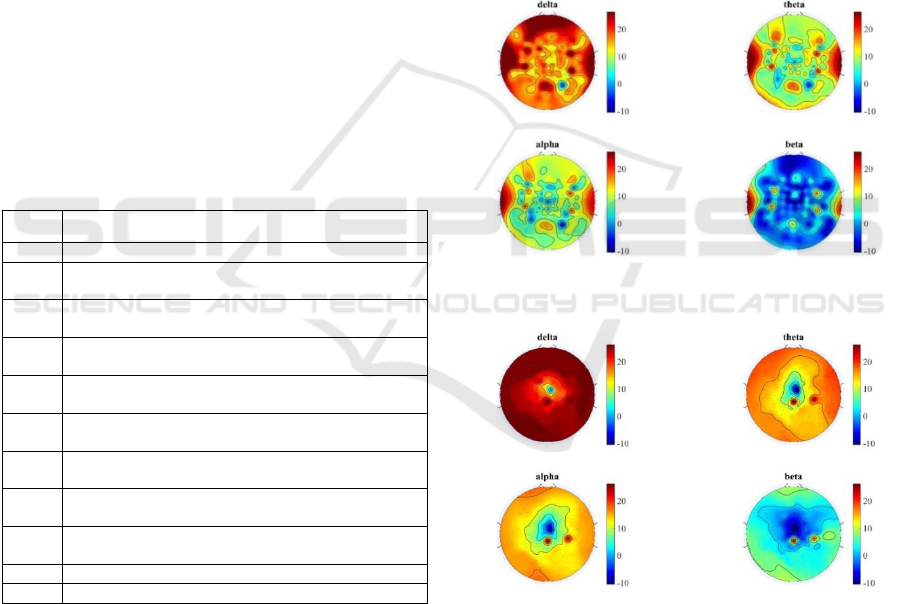
Figures 2-3 show the visualization of the spectral
power density of EEG signals before and after
neuro-electrostimulation for a patient CH794.After
the procedures of neuro-electrostimulation for
patient CH794, normalization of activity is observed
— after the stimulation procedures, the distribution
of spectral power is more uniform. At the same time,
it is worth noting a statistically significant increase
in the power level in the frontal and occipital zones
by more than 10 dB, for delta and beta rhythms, and
by 7 dB for theta and alpha rhythms.
Figure 2: Visualization of power density for patient
CH794 before stimulation.
Figure 3: Visualization of power density for patient
CH794 after stimulation.
Data for patient CH862 indicate a slight change
in the activity of spectral powers. It is worth noting
the decrease in power of EEG signals for all four
rhythms by 10 dB in the central zone of the brain
(electrodes Cz, C1, C2, FCZ, CPZ).
The most significant changes for patient CH865
are observed for the beta rhythm in the right
occipital region (about 7 dB). It is worth noting the
Processing the Results of Electroencephalography for Patients Suffering from Depression after Neuro-electrostimulation Course: Case Study
579
decrease in EEG activity in the central zone for the
delta, theta and alpha rhythms (8 dB), the increase in
the activity of the theta rhythm in the frontal zone (4
dB), as well as the increase in the activity of the
delta rhythm in the right temporal zone (6 dB).
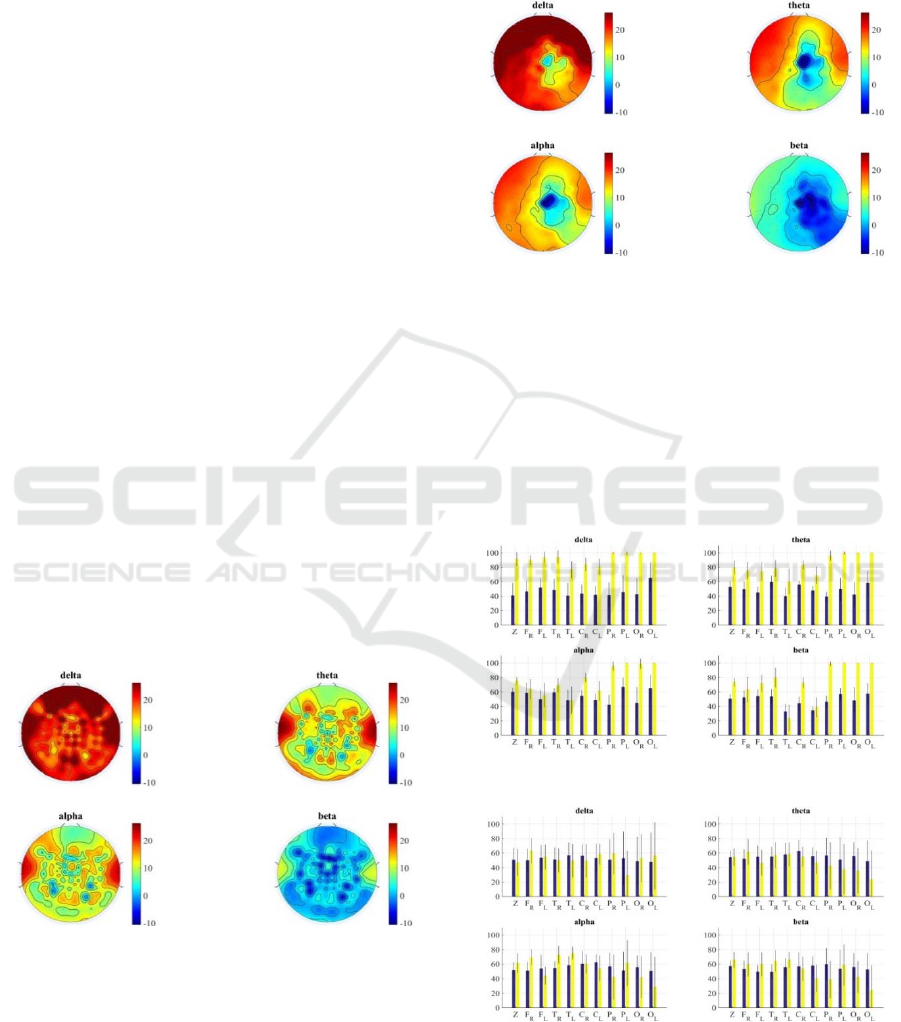
Figures 4-5 show the visualization of the power
spectral density of EEG signals before and after
neuro-electrostimulation for patient CH798.Data for
patient CH798 indicates that the changes are
asymmetrical: for the left side (electrodes F5, F3,
FC5, FC3, C5, C3, CP5, Cp3, P5, P3), an increase in
the EEG power for theta and alpha rhythms by 8 dB
is observed, for delta and beta, the spectral power
increase by 4 dB. At the same time, for the right side
(electrodes F4, F2, FC4, FC2, C4, C2, CP4, CP2,
P4, P2), in delta, theta and alpha rhythms, a decrease
in EEG power is observed by 8 dB and by 6 dB in
the beta rhythm.
Analysis of the results for patient CH863,
indicates a local change in the power of the EEG.
For the delta, theta, and alpha rhythms, an increase
in the spectral power is observed by 7 dB in the
region of the T8, FC6, FC4, FC2, and FC1
electrodes. For the beta rhythm, there is a decrease
in EEG power by 8 dB in the area of the electrodes
FCZ, Cz and CPZ. It should be noted that after the
neuro-electrostimulation procedures, the activity of
the EEG rhythms became more homogeneous - local
heterogeneities in the center disappeared.
For patient CH864, it is worth noting the
decrease in EEG activity for all rhythms in the area
of the Cz electrode. At the same time, there is a
slight increase in the power of the left half of the
brain for the delta and theta rhythms by 4 dB.
Figure 4: Visualization of power density for patient
CH798 before stimulation.
Summarizing the analysis of visualization of the
spectral power density of EEG signals, it can be
concluded that the most significant changes are
observed for patients CH794 and CH798. At the
same time, changes for patient CH794 (from the
group of multichannel stimulation) were more
pronounced, while for patient CH798 (from the
group of single-channel stimulation) the changes
were asymmetric. In general, for all patients, an
increase in spectral power uniformity is observed.
Figure 5: Visualization of power density for patient
CH798 after stimulation.
3.2 Evaluation of the Activation Level
Figures 6-8 show the bar graphs of the level of
activation of the EEG channels for 11 zones, before
(blue) and after stimulation (yellow) for the
multichannel stimulation group. Activation of 100%
is obtained when spectral power of all channels in
zone is higher than threshold.
Figure 6: CH794; estimation of activation level, %.
Figure 7: CH862; estimation of activation level, %.
According to Figure 6, it can be concluded that
the activation level increases for all EEG rhythms
NNSNT 2019 - Special Session on Non-invaisive Neuro-stimulation in Neurorehabilitation Tasks
580
for patient CH794. The most significant changes are
in all zones for the delta rhythm, as well as the
occipital zones (P and O) for theta, alpha and beta
rhythms. It should be noted that the level of
activation varies slightly during the study.
Figure 8: CH865; estimation of activation level, %.
According to Figure 7 for the patient CH862, the
level of activation basically remained the same. The
increase in activation in the temporal zones (T_R
and T_L) for the alpha rhythm is statistically
significant. At the same time, it is worth noting the
increase in the degree of scatter of the level of
activation during the study after the neuro-
electrostimulation procedures.
Based on the data of Figure 8, it can be
concluded that for patient CH865 is the most
significant increase in the level of activation in the
occipital zones (O_R and O_L) for alpha and beta
rhythms. At the same time, it is worth noting the
increase in the activation level for theta, alpha and
beta rhythms for the right frontal zone (F_R).
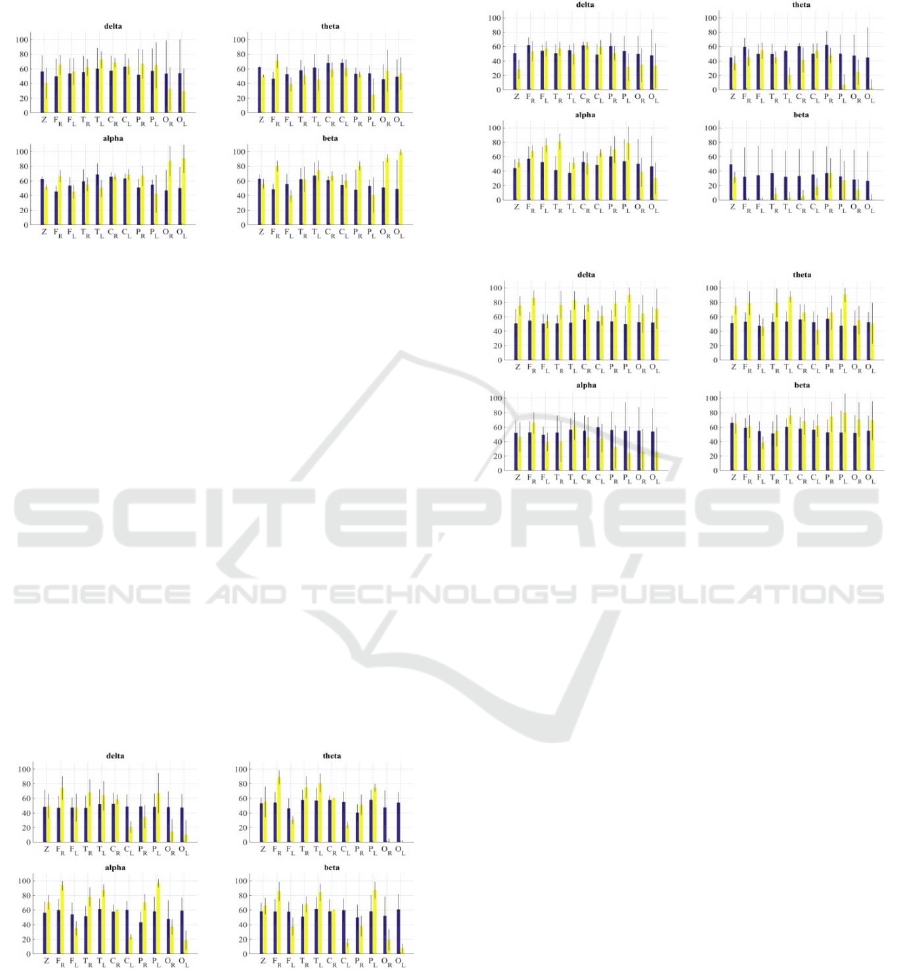
Figures 9-11 show the bar graphs of the level of
activation of the EEG channels for 11 zones, before
(blue) and after stimulation (yellow) for a single-
channel stimulation group.
Figure 9: CH798; estimation of activation level, %.
The data on Figure 9 indicate the diversified
nature of changes in the level of activation in patient
CH798. For all rhythms, an increase in the level of
activation is observed for the right frontal zone, as
well as a decrease in the level of activation for the
occipital zone and the left central zone. For theta,
alpha and beta rhythms it is worth noting a
significant increase in the level of activation in the
temporal zones, as well as in the left parietal zone.
Figure 10: CH863; estimation of activation level, %.
Figure 11: CH864; estimation of activation level, %.
Based on the graphs shown in Figure 10, it can
be concluded that for patient CH863, there is a
decrease in the level of activation for theta and beta
rhythms. For the alpha rhythm, an increase in the
activation level is observed for the left frontal, right
temporal and left parietal.
The bar graphs shown in Figure 11 indicate that
patient CH864 experienced an increase in the
activation level for most zones in the delta and theta
rhythm. For the alpha rhythm, a decrease in the level
of activation in the parietal and occipital zones is
observed.
Summing up the evaluation of the brain areas
activation level, it can be concluded that an increase
in the level of activation is observed for patients
from the group of multichannel stimulation, this is
especially pronounced for patient CH794. It is noted
that for patients from the single-channel stimulation
group there were zones in which a significant
decrease in the level of activation is observed.
4 CONCLUSIONS
The article has presented the results of EEG signal
processing in a case study of neuro-
Processing the Results of Electroencephalography for Patients Suffering from Depression after Neuro-electrostimulation Course: Case Study
581

electrostimulation therapy application for patients
suffering from depression. The neuro-
electrostimulation procedures were tested in two
modes – multichannel and single-channel
stimulation.
Summarizing the analysis of visualization of the
spectral power density of EEG, it can be concluded
that the most significant changes have been observed
for patients CH794 and CH798. At the same time,
changes for patient CH794 (from the group of
multichannel stimulation) had been more
pronounced, while for patient CH798 (from the
group of single-channel stimulation), the changes
had been asymmetric. In general, for all patients, an
increase in EEG power uniformity has been
observed.
A quantitative method for estimating the level of
activation of brain zones has been proposed. Initial
data (prior to the neuro-electrostimulation
procedures application) were used to estimate the
average level of the EEG spectrogram value in the
zone over the entire time interval for all channels
(activation threshold). Then, for each time epoch,
the proportion of channels that exceed the activation
threshold was estimated. The same activation
threshold was used in the analysis of signals
recorded after neuro-electrostimulation procedures.
Considering the evaluation of the brain areas
activation level, it could be concluded that an
increase in the level of activation was observed for
patients from the group of multichannel stimulation,
this is especially pronounced for patient CH794. It
was noted that for patients from the single-channel
stimulation group there were zones in which a
significant decrease in the level of activation was
observed.
ACKNOWLEDGEMENTS
The EEG signals data acquisition within the study
(Chapter 2) was supported by the Act 211 of the
Government of the Russian Federation (contract no.
02.A03.21.0006). The EEG signals data processing
(Chapter 3) was funded by RFBR (project no, 18-29-
02052).
REFERENCES
Cook, I.A., Abrams, M., and Leuchter, A.F., 2016.
Trigeminal nerve stimulation for comorbid
posttraumatic stress disorder and major depressive
disorder. Neuromodulation: Technology at the Neural
Interface, 19 (3), 299–305.
Culpepper, L., Muskin, P.R., and Stahl, S.M., 2015. Major
depressive disorder: understanding the significance of
residual symptoms and balancing efficacy with
tolerability. The American journal of medicine, 128
(9), S1–S15.
Danilov, Y., Kaczmarek, K., Skinner, K., and Tyler, M.,
2015. Cranial Nerve Noninvasive Neuromodulation:
New Approach to Neurorehabilitation. In: F.H.
Kobeissy, ed. Brain Neurotrauma: Molecular,
Neuropsychological, and Rehabilitation Aspects. Boca
Raton (FL): CRC Press/Taylor & Francis.
Delorme, A. and Makeig, S., 2004. EEGLAB: an open
source toolbox for analysis of single-trial EEG
dynamics including independent component analysis.
Journal of neuroscience methods, 134 (1), 9–21.
Kublanov, V., Babich, M., and Dolganov, A., 2017.
Principles of Organization and Control of the New
Implementation of the “SYMPATHOCOR-01” Neuro-
electrostimulation Device. Presented at the Special
Session on Neuro-electrostimulation in
Neurorehabilitation Tasks, 276–282.
Kupfer, D.J., Frank, E., and Phillips, M.L., 2012. Major
depressive disorder: new clinical, neurobiological, and
treatment perspectives. The Lancet, 379 (9820), 1045–
1055.
Oostenveld, R. and Praamstra, P., 2001. The five percent
electrode system for high-resolution EEG and ERP
measurements. Clinical neurophysiology, 112 (4),
713–719.
Petrenko, T.S., Kublanov, V.S., and Retiunskiy, K.Y.,
2015. Dynamic Correction of the Activity Sympathetic
Nervous System (Dcasns) to Restore Cognitive
Functions. European Psychiatry, 30, 843.
Schmaal, L., Hibar, D.P., Sämann, P.G., Hall, G.B.,
Baune, B.T., Jahanshad, N., Cheung, J.W., van Erp,
T.G.M., Bos, D., and Ikram, M.A., 2017. Cortical
abnormalities in adults and adolescents with major
depression based on brain scans from 20 cohorts
worldwide in the ENIGMA Major Depressive
Disorder Working Group. Molecular psychiatry, 22
(6), 900–909.
Sokolov, A.V., Vorobyev, S.V., Efimtcev, A.Y., Dekan,
V.S., Trufanov, G.E., Lobzin, V.Y., and Fokin, V.A.,
2017. fMRI and Voxel-based Morphometry in
Detection of Early Stages of Alzheimer’s Disease: In:
Proceedings of the 10th International Joint
Conference on Biomedical Engineering Systems and
Technologies. Presented at the 4th International
Conference on Bioimaging, Porto, Portugal:
SCITEPRESS - Science and Technology Publications,
67–71.
Welch, P., 1967. The use of fast Fourier transform for the
estimation of power spectra: a method based on time
averaging over short, modified periodograms. IEEE
Transactions on audio and electroacoustics, 15 (2),
70–73.
NNSNT 2019 - Special Session on Non-invaisive Neuro-stimulation in Neurorehabilitation Tasks
582
