
Deep Neural Network for Fuzzy Automatic Melanoma Diagnosis
Wiem Abbes and Dorra Sellami
CEM Laboratory, National Engineering School of Sfax, Sfax University, Soukra Street, Sfax 3038, Tunisia
Keywords:
Melanoma, Bag of Words, CAD System, Feature Extraction, Fuzzy C-Means, Deep N eural Network Classifier.
Abstract:
Melanoma is the most serious type of skin cancer. We consider in this paper diagnosing melanoma based on
skin lesion images obtained by common optical cameras. Given the lower quality of such images, we should
cope with the imprecision of image data. This paper proposes a CAD system for decision making about the
skin lesion severity. We fi r st define the fuzzy modeling of the Bag-of-Words (BoW) of the lesion. Indeed,
features are extracted from t he skin lesion image related to four criteria inspired by the ABCD rule (A sym-
metry, Border, Color, and Differential structures). Based on Fuzzy C-Means (FCM), membership degrees are
determined for each BoW. Then, a deep neural network classifier is used for decision making. Based on a pu-
blic database of 206 lesion images, experimental results demonstrate that the fuzzification of feature modeling
presents good results in term of sensitivity (90.1%) and of accuracy (87.5%). A comparative study illustrates
that our approach offers the best accuracy and sensitivity.
1 INTRODUCTION
Melanoma presents the most serious form of skin can-
cer. It is the most speedily developing cancer in the
world (Bickers et al., 2006). The melanoma incidence
continues to increase significantly, at a rate rapidly
than that of any of the seven most common cancers
(Ries et al., 2006). Nearly 178,560 melanoma cases
will be diagnosed in 201 8, with approximately 9,320
cases of death (One person dies o f melanoma every
hour) (Facts and Figures, 2018). There are th ree main
types of skin cancer: Basal cell carcinoma, Squamous
cell ca rcinoma, and Melanoma which r e presents only
4% of skin cancers but it is respon sible for 75% of
deaths from skin cancer (Haralick et al., 1973; Ferlay
et al. , 2010).
A diagnosis of skin lesions is performed b y a two-
step procedure. The first step is to differentiate be-
tween melanocytic and nonmelanocytic skin lesions
and the second step is to identify b e nign melanocy-
tic lesions from melanoma ba sed on derm oscopy ru-
les. Many de rmoscopy rules are adopted by derma-
tologists : ABCD rule (Asymmetry, Border, Colors,
and Differential struc tures) (Stolz, 1994), seven-point
checklist (Argenziano et al., 1998), Menzies meth od
(Menzies et al., 1996) and CASH algorithm (H e nning
et a l., 2007). These dermoscopy rules allow making
the diagnosis more reproduc ible an d reliable. Despite
using these rules, clinical analysis of ma lignant mela-
noma is still challenging.
In the last decade, various Computer-Aided Diag-
nosis (CAD) systems have be en developed to solve
this problem such as (Celebi a nd Zornberg, 2014; Co-
della et al., 2017; Lopez e t al., 2017; Yu e t al., 2017;
Quang et al., 2017). These existing CAD systems
achieve good results in term of specificity and of accu-
racy, but they are not satisfactory in ter m of sensiti-
vity. Therefore, the automatic diagnostic process is
still an open problem .
Several previous works are based on dermoscopy
images. Indeed , a dermatoscope is an optical de-
vice that ma nipulates light features to elucidate sub-
surface information. This device is used by derma-
tologists to ob tain an excellent qu ality o f an image.
Therefore, it allows identifying benign and malignant
lesions. Unfortu nately, the use o f dermatoscopes is
limited in Taiwan, USA, and India. Ac cording to r e -
cent survey reporting, only nearly half of dermato-
logists use dermatoscope in these countries (Engas-
ser and Warshaw, 2010; Kuo et al., 2015; Kaliyadan
et al., 2018). In fact, a dermato scope presents an ex-
pensive solution in comparison with optical standa rd
cameras. Accordingly, we consider, in this study, di-
agnosing melanoma based only on skin lesion images
obtained by optical c a meras. Therefore, these images
have poor co ntrast and less saturated colors, adding a
vagueness of image data knowledge.
In the field of medical image analysis, fuzzy mo-
deling is adopted to manage the imprecision of ana-
lyzed data. In fact, the fuzzy logic theory is able to
Abbes, W. and Sellami, D.
Deep Neural Network for Fuzzy Automatic Melanoma Diagnosis.
DOI: 10.5220/0007697900470056
In Proceedings of the 14th International Joint Conference on Computer Vision, Imaging and Computer Graphics Theory and Applications (VISIGRAPP 2019), pages 47-56
ISBN: 978-989-758-354-4
Copyright
c
2019 by SCITEPRESS – Science and Technology Publications, Lda. All rights reserved
47

describe the qualitative concepts (e.g. poor, medium,
and highly) an d then to cope with the vagueness of ex-
perts’ rules. Thus, it is well-adapted for the modeling
step formulated by experts. To cope with the impre-
cision of extracted data, we adop t the fuzzification to
model the Bag-of-Words (BoW) of the lesions.
In recent de cades, CAD systems using Deep Neu-
ral Networks (DNN) has been reported to be an ef-
ficient tool for the diagnosis of skin lesions (Binder
et al., 1994; Piccolo et al., 2002; Blum et al., 2004).
In our work, a deep neur al network classifier is used to
identify th e classes of benign common nevi and ma-
lignant melanoma.
In our work, we develop a CAD system for me-
lanoma detection based on fuzzy BoW using DNN
classifier. Firstly, we apply the fuzzification of featu-
res extracted from preprocessed lesion images using
Fuzzy C-Means (FCM) in order to model the BoW.
The result of this feature modeling step is the mem-
bership degrees of the lesion to each word of the
BoWs. Then, these membership degrees are a pplied
as input to a DNN classifier for dec ision making about
the skin lesion severity.
The remainder of this paper is organized as fol-
lows: In section 2 , we define related works on skin
lesion classification . Then, in section 3, we describe a
general overview of the prop osed CAD system where
a fuzzy modeling is proposed of BoW. Later in section
4, we give details on feature modeling step. Then, in
section 5, we describe deep classification. Thus, in
section 6, exp erimental results, based o n public data-
bases, are discussed. Finally, conclusions are dr awn
in section 7.
2 RELATED WORKS
Many studies on automatic diagn osis of melanoma
have been developed in the last few decades where
several methods and techniques have been propo sed.
Most of these previous researches consider only der-
moscopy images (Celebi and Zornberg, 2014; Codella
et al., 2017; Lopez et al., 2017; Yu et al., 2017; Qua ng
et al. , 2017). I n ( Celebi and Zornberg, 2014), auth ors
present an approach for au tomatic estimation of cli-
nically significant colors in dermoscopy images. The
database of this stud y is composed of 914 images (272
melanoma s and 642 non-melanoma) obtained fro m
the EDRA Interactive Atlas of Dermoscopy. Based
on color features, the rates of classification obtained
are nearly 71.7% for accuracy, 75.8% for specificity
and 61.6% for sensitivity.
In ( Codella et al., 2017), authors adopted a CNN
model in order to segment and classify the skin le-
sions fo r melanoma detection from dermoscopy skin
lesion images. They yield a n accu racy of %94 on seg-
mentation and an accuracy of 85% on classification.
In an other study, Lopez et. al. use a CNN mo del
for melanoma detection. They are based on trans-
fer learning method and they acquired an accuracy
of 81% on dermoscopy images (Lopez et al., 2017).
In (Yu et al., 2017), authors use the fully convolutio-
nal residual network (FCRN) and deep r esidual net-
work (DRN) for segmentation and classification of
melanoma . They get accuracy rates of 94% and 85%
for segmentation and classification, respective ly. In
(Quang et al., 2017), authors adopt a fully convolu-
tional model to segment skin lesion and use a sim-
ple CNN and VGG-16 model based on transfer lear-
ning for skin lesion classification. This work achieves
a segmentation accur a cy of 87% and a classification
accuracy of 79%. These previous works are working
on ISIC Archive dataset (Marchetti et al., 2018).
According to the state of art, all the existing met-
hods suffer from sensitivity low values. Such values
result from ina ccuracy mode ling o f melanoma so that
they are confused to benign lesions. In this paper,
we consider improving such modeling by taking into
account the ambiguity of d a ta in a fuz zy framework
modeling. Besides, we will be based in our dataset
on more samples of m e la noma than those used in the
state of the art, let it be half of the samples. Our da-
taset is then balanced. A further improvement of the
accuracy of diagnosis can be obtain e d by app lying a
machine learning decision-making system, which is
able to cop e with the complexity of such a diag nosis
of melanoma. Accordingly, a deep c lassifier is a pp-
lied in decision making.
3 GENERAL OVERVIEW
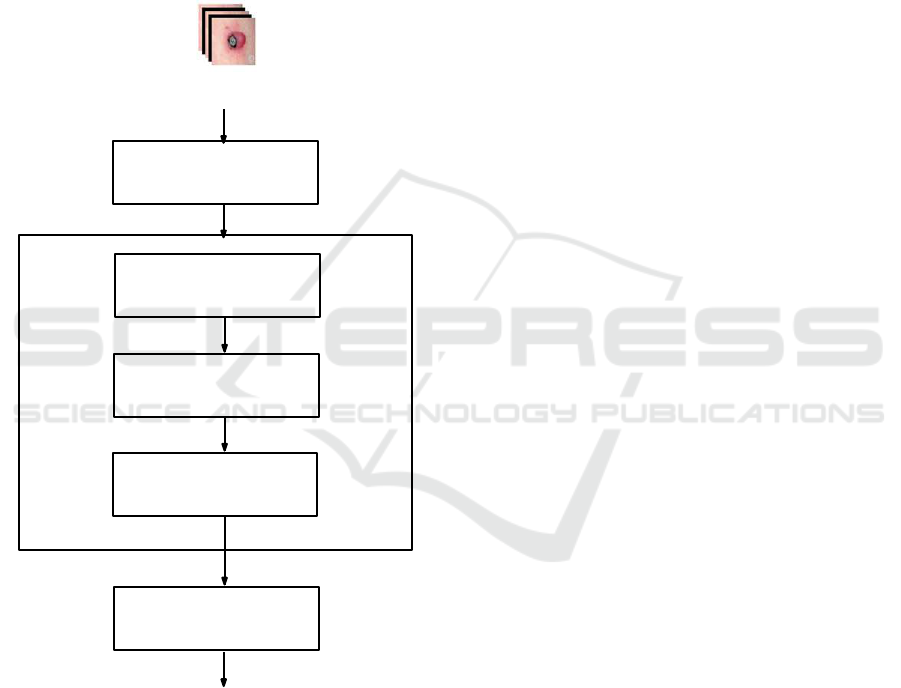
In Figure.1, we present a general block-diagram of the
proposed CAD system. Firstly, a skin lesion imag e is
manually segmented . Sec ondly, the propo sed system
is composed of three main blocks: preprocessing, fe-
ature modeling, and classification. In the preproces-
sing step, a m edian filter (Chang et al., 2008) is ap-
plied. Briefly, the median filter is a nonlinear digital
filter which is commonly adopted for noise re moval.
It is generally considered in digital image processing
because under certain conditions, it preserves relevant
image information while removing noise. Such noise
decreasing is a typical preprocessing step to improve
the results of subsequent steps. The second step con-
sisting on a feature modeling aims at filling the gap
between the low-level description an d the diagnosis
concept described b y the BoWs. To cope with the in-
VISAPP 2019 - 14th International Conference on Computer Vision Theory and Applications
48
formation amb iguity aspect in low-leve l descriptors,
fuzzy modeling fits better our context. Firstly, image
is analyzed for feature extraction in order to define
our BoW related to four specific criteria which are:
asymmetry, border, color, and differential structures.
Then, given these features, FCM is applied to define
the membership degrees of lesion imag e to each word
(concept) of the BoW. For classification, DNNs are
adopted since they have been prowed to be the most
efficient in modeling all complex dec isio n making sy-
stems. These main steps are discussed in de ta il in the
following sections.
Median Filter
Feature Extraction
Bag-of-Words
Feature Modeling
Modeling
Data Fuzzification
DNN Classifier
Decision
Segmented lesion image
Figure 1: Graph representation of main steps of our CAD
system f or decision making about severity of the skin lesion.
4 FEATURE MODELING
4.1 Bag-of-Words Modeling
Dermatologists adopt some concepts to describe ima-
ging sig ns related to melan oma. In our work, the
BoW modeling is inspired by expert interpretation
and diagnosis of melanoma. These concepts help de r-
matologists to identify the features from skin lesion
images which are not visible to the naked eye. Besi-
des, the feature modeling step is performed by FCM
method in ord er to model the fuzzified BoW from ex-
tracted featu res (Abbes and Sellami, 2016; Abb es and
Sellami, 2017).
For asymmetry, dermatologists use different mo-
deled words to describe this concept. We can de-
fine these words by: ”Poor Asymmetry”, ”Medium
Asymmetry” , and ”Highly Asymmetry”. Relatin g to
the borde r, experts model the irregularity of the le-
sion border using different labels. We can describe
these labels by: ”Regular Border”, ”Fine Irr egu la ri-
ties”, and ”Coarse Irregularities”. For the color, the
description of this conc ept is based on the complex-
ity of the color distribution. In our work, two mo-
deled words are defined for the color concept which
are: ”Simple Color” and ”Complex Color”. Based
on the modeled words adopted by the dermatologists,
the differential structure concept is described by two
modeled words wh ic h are: ”Uniform Structure” and
”Composite Structure”. Table.1 defines the descrip-
tion of each BoW.
4.2 High-level Descriptors
Inspired by the ABCD rule (Stolz, 1994), a feature set
of the skin lesion im age is extracte d for each criterion
(Asymmetry, Border, Color, and Differential structu-
res) in order to determine the lesion severity.
4.2.1 Asymmetry
Dermatologists consider the lesion a symmetry, accor-
ding to the pr incipal axes, as an important descrip-
tor. Indeed, they try to char a cterize the shape and co-
lor asymmetry of a skin lesion, since melanoma cases
tend to be asymmetrically pigmented. While, the be-
nign lesion cases have homogeneous color d istributi-
ons. Moreover, melanoma cases have an asymmetri-
cal shape, whereas, the benign lesions are elliptically
shaped. Therefore, the aim o f asymmetry features is
to define a quantitative description of the shape a nd
the color of the skin lesion. The asymmetry features
are:
• Central Shape Asymmetry Feature: F
CSA
: This
feature de scribes the degree of lesion asymmetry
relative to the center of gravity. It is computed
in this work by the following method: The seg-
mented lesion is divided by n lines passed by its
center of gravity in order to achieve 2 ∗n equal an-
gles. For each sample, the average length of rays
Deep Neural Network for Fuzzy Automatic Melanoma Diagnosis
49
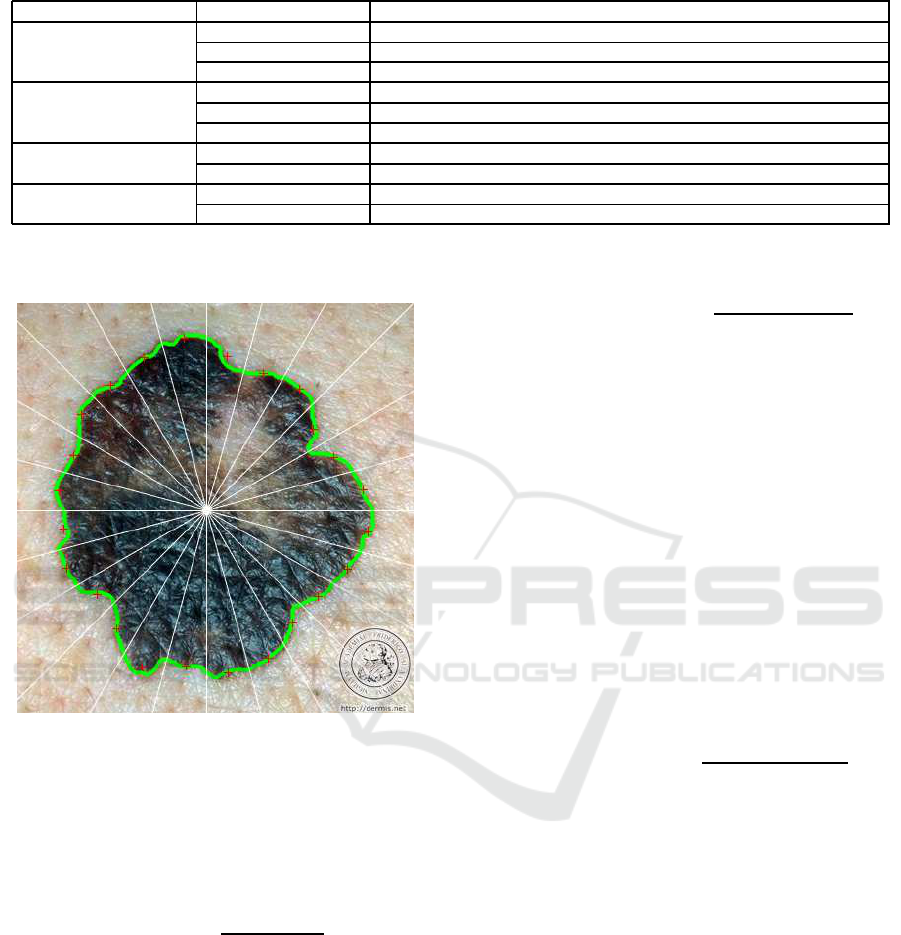
Table 1: Description of the bag-of-words.
Concept Bag-of-Words Description
Asymmetry Poor Asymmetry It describes the poor asymmetry of the lesion
Medium Asymmetry It describes the medium asymmetry of the lesion
Highly Asymmetry It describes the high asymmetry of the lesion
Border Regular Border It describes the elliptical border of the lesion
Fine Irregularities It describes the border of t he lesion that contains fine irregularities
Coarse Irregularities It describes the border of t he lesion that contains coarse irregularities
Color Simple Color It describes the lesion that contains at most two colors
Complex Color It describes the lesion that contains at least three colors
Differential S tructures Uniform S tructure It describes the uniform texture of the lesion
Composite Structure It describes the composite texture of the lesion
of each ang le is calculated as it is shown in Figure.
2.
Figure 2: Lesion crossed by n lines(White), lesion border
(Green), centre of gravity (White square), average rays of
each angle of lesion (Red).
Then, the central shape asymmetry feature is de-
termined by chi-square distance of two opposite
average rays as it is expressed in the following
equation:
F
CSA
=
n
∑
i=1
(¯r
(i+n)
− ¯r
i
)
2
¯r
(i+n)
+ ¯r
i
(1)
where ¯r
i
represents th e ave rage length of the rays
of angle i. High values of this feature describe an
asymmetric lesion, whereas, lower values define
an elliptical shape.
• Axial Shape Asymmetry: F
ASA
: This fea ture de-
termines the lowest asymmetry of the skin lesion
with respect to an axis passing by the center of
gravity. The chi-squ a re distance of the averages
of two symmetric rays is calcu la ted for each axis.
The axial shape asymmetry f eature is the mini-
mum value that verifies the low est asymmetry as
it is shown in the following equation.
F
ASA
= min
0≤ j≤(n− 1)
(
(n+ j)
∑
i=(1+ j)
(¯r
(2(n+ j)−i)
− ¯r
i
)
2
¯r
(2(n+ j)−i)
+ ¯r
i
) (2)
High values of this feature are achieved with an
asymmetric lesion.
• Color Asymmetry: F
CA
: This feature evaluates
the symm etrical distribution of colors in a skin
lesion. This color feature is based on th e HSV
color space (Smith, 1978). The skin lesion is di-
vided into two sides where an a xis of separation
is the major axis of the lesion. Each side has a
set of vectors specific to each space V
c
i j
with c∈
{Hue, Saturation,Value} : S1 contains V
c
11
,...,V
c
1 j
,...,V
c
1N
and S2 contains V
c
21
,...,V
c
2 j
,...,V
c
2N
. Using
the segmented lesion, the color distributions on
each side are compare d usin g chi- square distance.
Therefore, the color asymm etry feature is deter-
mined by the following equation:
F
CA
=
∑
c∈{H,S,V }
N
∑
k=1
(V
c
1 j
(k) −V
c
2 j
(k))
2
V
c
1 j
(k) +V
c
2 j
(k)
(3)
4.2.2 Border
The lesion border c an be determined by the gray le-
vel transition between the inner lesion and the region
surrounding it. Experts try to identify the irregu la r
borders of the lesion, since melanoma cases generally
tend to have highly irregular borders, while a benign
skin lesion has a smooth border. To iden tify this irre-
gularity, we characterize the following features:
• Border Irregularity based on Area: F
1
BI
: Me -
lanoma cases frequently have irregular localized
patterns. To evaluate these irregularities, a smoot-
hed method is applied to the border o f the lesion.
In fact, the average rays, computed in the previous
section, are marked in the median of each angle.
Therefore, the smoothed border is determined by
the link between all extreme points of the average
rays as it is illustrated in Figure.3.
VISAPP 2019 - 14th International Conference on Computer Vision Theory and Applications
50
Then, border irregularity feature based on the area
can evaluate the fine irregularities based on the
normalized area between the original shape and
the smoothed shape. A regular bo rder presents
very little d ifference, wherea s, a highly irregular
border has large area differentials.
• Border Irregularity based on the Perimeter:
F
2
BI
: This featur e evaluates the coarse irregulari-
ties of the skin lesion. It is defined by the dif-
ference of the smoothed shape perimeter and the
original shape perimeter. A hig h value of this fea-
ture p resents a highly irregular border.
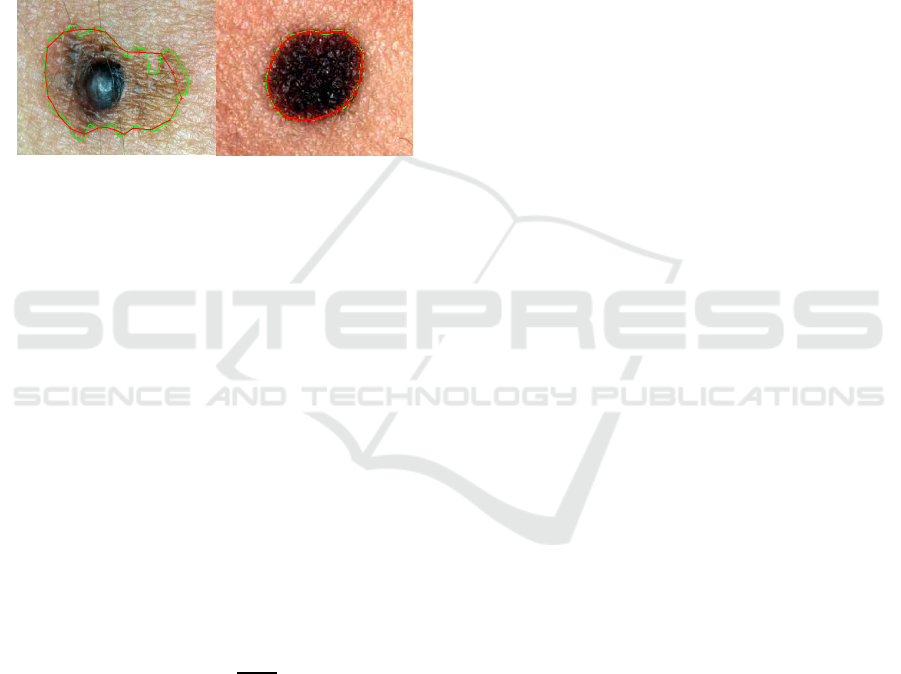
(a)
(b)
Figure 3: Smoothed lesion, original shape (Green), smoot-
hed shape (Red). (a) melanoma l esion where F
1
BI
=13.64 and
F
2
BI
=0.22 (b) benign lesion where F
1
BI
=5.21 and F
2
BI
=0.04.
• Shape Signature: F
BS
: T his fe ature is defined by
the variance of the distance of boundary points
from the cen te r of gravity of the skin lesion. Then,
it is normalized to make it scale-invariant, by di-
viding it by the maximum ray which is the max-
imum distance between the center of gravity and
the border points. Finally, this feature is calcula-
ted by the sum of the difference betwee n th e nor-
malized signature and its average.
• Compactness: F
BC
: This feature is defined as
the ratio of the area to the lesion perimeter as it
is shown in the Equation. 4. It is used to evaluate
the connectedness of the skin lesion. Melanoma
cases have low compactness values, wherea s,
benign lesions p resent high ly compa c tness values.
F
BC
=
4π.A
P
2
(4)
where A is the lesion area and P presents the peri-
meter of the le sio n shape.
4.2.3 Color
The scientific definition of melanoma is usually a s-
sociated with the pr esence of diff erent colors, which
can be defined as non-uniform distributions of colors
compare d to the benign skin lesion. De rmatologists
deal with a color numbe r that is between one and six.
Therefore, this color feature evaluates the number of
colors in a skin lesion. A way to identify this fea-
ture in our study is to apply k-means method where
k is the number of colors. The number o f classes ”k”
is varied from one to six. T he result of the k-means
method is a reconstruction of the lesion image a ccor-
dingly. For each reconstruction, the intra- class and
inter-class variance are calculated. The best recon-
struction is achieved with the lowest ratio of intra-
class to inter-class variance. Therefore , it is associ-
ated with the optimal color c la ss number.
4.2.4 Differential Structure
Texture analy sis identifies the region characterization
in an image by their textur e data. It presents one of
the useful methods for the d iscrimination of skin can-
cer with hig h precision . It consists on computing the
statistics of pairs of neighboring pixels, using th e co-
occurre nce matrix (Haralick et al., 1973). The Gray
Level Co-occurrence M a trix ( GLCM) is a relevant ap-
proach f or texture description by mapping the grey
level co-occur rence probabilities based on spatial re-
lations of pixels in different orientations ( Sheha et al.,
2012). The differential structure features are extrac te d
based on texture analysis using normalized GLCM
with an angle value of 0
◦
and a distance value of 1.
To normalize the GLCM, we compu te the sum of all
the values in each GLCM in the array and divide e ach
element by its sum.
The features based on GLCM in our work are as fol-
lows: Correlation, Autocorrelation, Cluster Promi-
nence, Contra st, Cluster Shade , Difference variance,
Dissimilarity, Difference entropy, Entropy, Energy,
Maximum probability, Sum average, Sum entropy,
Sum of squares Varia nce, Sum variance, Homoge-
neity, Inverse difference homog enous (IN V ), Inverse
difference moment nor malized, Inverse difference
normalized (INN), Information measure of correla-
tion 1, and Information measure of correlation 2.
4.3 Modeling using Fuzzy C-Means
4.3.1 Fuzzy C-Means
FCM was determined by Dunn in 1 973 (Dunn, 1973)
and developed by Bezdek in 1981 (Peizhuang, 1983).
In our work, FCM is adop te d for lesion annotation in
order to c luster the lesions with respect to concepts of
each criterion (Asymmetry, border, color, differential
structures), given the features extracted from the skin
lesion ima ge. Data partitioning into clusters is perfor-
med by minimiz ing an objective function. The latter
allows minimizing intra -cluster variance. Minimizing
objective function means increasing similarity among
all the components within a cluster. Therefore, the
Deep Neural Network for Fuzzy Automatic Melanoma Diagnosis
51

adopted objective function is exp ressed by the fo llo-
wing equation:
J =
N
∑
i=1
C
∑
j=1
u
2
i j
kx
i
− c
j
k
2
(5)
where:
• x
i
is the i
th
sample of a d-dimensional measured
data;
• c
j
is the d-dimension center of the cluster j;
• u
i j
is the degree of membership of x
i
to cluster j;
• k ∗ k is a norm function expressing the Euclidean
distance;
• N is the number of samples;
• C is the number of clusters.
FCM is carried out by an iterative optimizatio n of the
adopted objective function J, applying the update of
the cente rs of clusters c
j
and the mem bership degrees
u
i j
. Firstly, the matrix u
i j
is randomly initialized and
then it is m odified in order to achieve
C
∑
j=1
u
i j
= 1. Af-
ter that, the update of the cluster centers c
j
and the
membersh ip u
i j
is perfo rmed through the following
expressions deduc e d from equation .5:
c
j
=
N
∑
i=1
u
2
i j
× x
i
N
∑
i=1
u
2
i j
(6)
u
i j
=
1
kx
i
− c
j
k
2
C
∑
k=1
1
kx
i
−c
k
k
2
(7)
By iteratively updating the cluster centers and the
membersh ip degrees for each sample, FCM modi-
fies the centers of clusters to the ”perfect” location
within a data set. This update iteratio n will stop when
max
i, j
{|u
(k+1)
i j
−u
(k)
i j
|} < ε wh ere k presen ts the iteration
steps, and ε, defining a termination criterion, must be
very low.
4.3.2 Modeling Step
Once the features are extracted from a lesion image,
the different words are modeled. Firstly, as a prepro-
cessing step, we normalize the extracted data. Data
normalization is useful because our data has varying
scales and we use the algorithm that does not make
assumptions about the distribution of extracted data.
Normalization is the process of rescaling one or mo re
features to the interval [0,1]. Accordingly, for each fe-
ature dimension, we calculate the mean of the feature
and subtract it from the d a ta set. After that, we com-
pute the standard deviation of each feature and divide
each feature by its standard deviation as it is shown in
the fo llowing equation:
f n =
| f −
f |
σ
f
(8)
where:
• f n presents the normalized feature,
• f is the extracted feature,
•
f defines the mean of the feature f ,
• σ
f
presents the standard deviations of the feature
f .
For asymmetr y, FCM was carried out to classify
the skin lesions into three classes: ”Poor asymme-
try”, ”Medium asymmetry” and ”Highly asymmetry”,
using the n ormalized features (central shape asymme-
try, axial shape asymmetry, and color asy mmetry).
Accordingly, the membership degrees of the lesion
are computed for each cluster.
Using the normalize d feature of the bord e r, FCM
was applied to model the lesions by the thr ee bag-
of- words: ”Regular border”, ”Fine irregularities” or
”Coarse irregularities”. Thus, the membership de-
grees of the lesio n are calculated f or each word.
Based on the color feature, FCM was performed
to annotate the lesion with two bag-of-words: ”Sim-
ple color” and ”Complex color”. Therefore, the mem-
bership degrees for each modeled feature are compu-
ted.
Based on the n ormalized GLCM features, FCM
was performed to cluster the lesions into ”Uniform
structure” and ”Composite structure”. Then, mem-
bership degrees are deduc ed.
Figure. 4 illustrates the modeling step of each
word of th e BoW.
where:
• NF
CSA
, NF
ASA
, and NF
CA
present the norma lize d
asymmetry features of F
CSA
, F
ASA
, and F
CA
, re-
spectively.
• NF
1
BI
, NF
2
BI
, NF
BS
, and NF
BC
are the n ormalized
border featu res of F
1
BI
, F
2
BI
, F
BS
, and F
BC
, respecti-
vely.
• NCF presents the normalized co lor feature.
• NGLCM defines the normalized GLCM features.
5 CLASSIFICATION
In medical diagnosis areas, Artificial Intelligence (AI)
techniques are the most able to cope with such com-
VISAPP 2019 - 14th International Conference on Computer Vision Theory and Applications
52
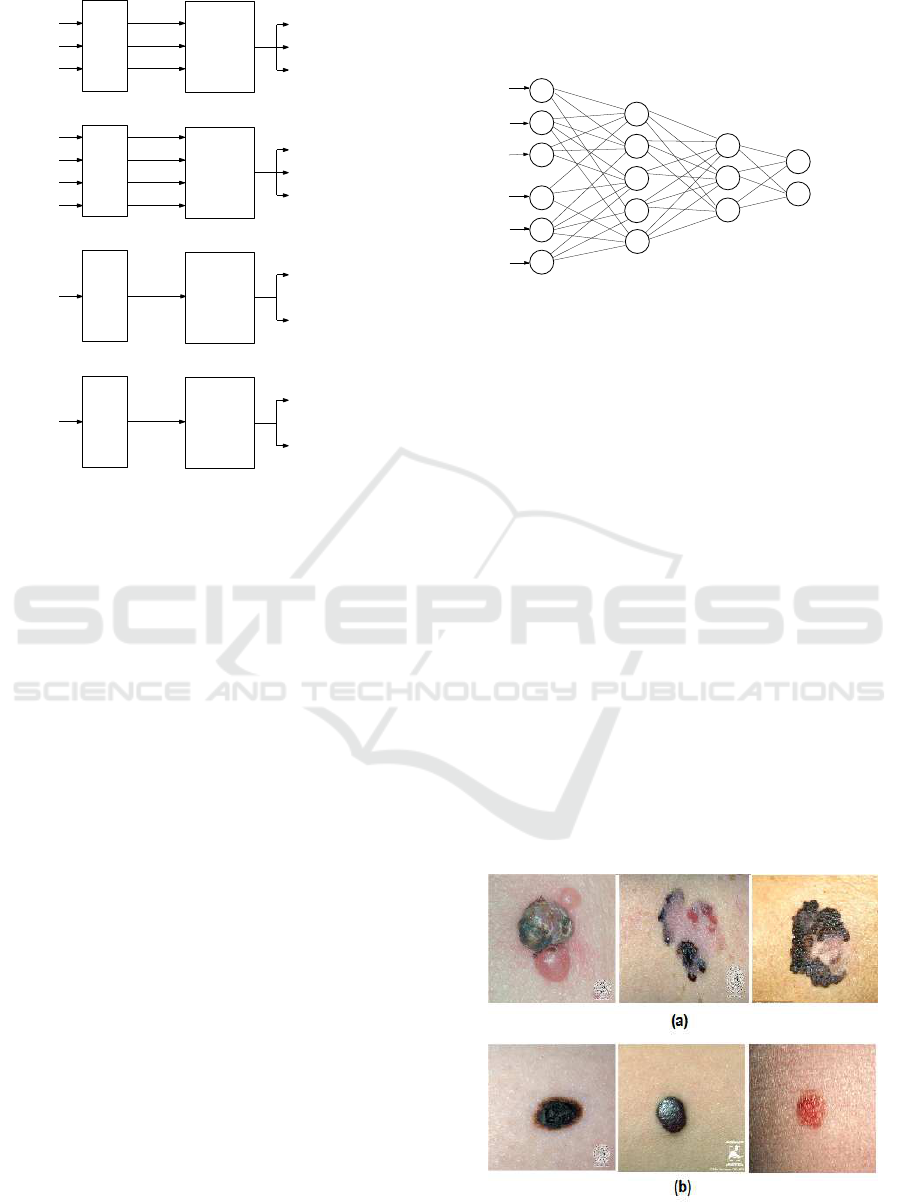
F
CSA
F
ASA
F
CA
Fuzzy
C-Means
Poor asymmetry
Medium asymmetry
Highly asymmetry
F
1
BI
F
2
BI
F
BS
Fuzzy
C-Means
Regular border
Fine irregularities
Coarse irregularities
F
BC
Number
Fuzzy
C-Means
Complexe color
Simple color
GLCM
Fuzzy
C-Means
Composite structure
Uniform structure
ofcolors
features
(a)
(b)
(c)
(d)
NF
CSA
NF
ASA
NF
CA
NF
1
BI
NF
2
BI
NF
BS
NF
BC
NCF
NGLCM
Normalization
Normalization
Normalization
Normalization
Figure 4: The modeling step from the extracted features.
(a) Asymmetric modeling (b) Border modeling (c) Color
modeling (d) Differential structure modeling.
plexity in decision making. Recently, Deep Neural
Network (DNN) has developed as an active research
sub-area of AI and it has been significantly increa-
sed performance on various pattern-re c ognition tasks.
CAD system based on DNN has been reported to be
an ac curate tool for the evaluation of pigmented skin
lesions (Binder et al., 1994; Piccolo et al., 2002; Blum
et al., 200 4). DNNs are considered as an efficient
classifier. It is a computational paradigm based on
mathematical models that unlike traditional compu-
ting have a structure and operation that imitates the
mammal brain (Sordo, 2002). The input features of
DNNs are processed in parallel in interconnected pro-
cessors. Moreover, the ability of adaptation by lear-
ning algorithms adjusts the connectivity betwee n the
nodes of DNNs. DNNs can be trained by specific
domain samples, therefore, they obtain their ”know-
ledge” abo ut appropriate processing in order to ex-
tract pertinent infor mation from tho se samples.
In our work, we apply the DNN process in order to
make the decision about the severity of the lesion.
Indeed , an input layer of nodes represents external
data which are the membership degrees of the lesion
to each BoW, wher eas a n output layer r epresents the
identity of classes which are the benign and the me-
lanoma classes, and two layers of hidden nodes were
included to represent possible interactions among the
input variables as it is shown in Figure.5. We ap-
ply the hyp erbolic tangent sigmoid as a non-linearity
function and gradient descent as an optimization al-
gorithm in this neural networks.
Hidden
Output
Membership degrees to the BoW
Melanoma
Benign
Layer
Layer
.
.
.
Input Layer
Hidden
Layer
Figure 5: A multilayered deep neural network for decision
making based on BoW memberships.
6 EXPERIMENTAL RESULTS
In this section, we show an experimental evaluation of
the proposed CAD system. Firstly, we represent the
experimental data set. Then, we define the evaluation
metrics as well as the performanc e eva luation of the
proposed CAD system. Based on performance me-
trics, results a re compare d to the existing approa ches.
6.1 Experimental Dataset
In order to validate our work, we use 206 images of
skin lesion, in which 119 are me la noma and 87 are
benign lesions. These skin lesion images were obtai-
ned using stand ard cameras in varying environmental
conditions. Each image has a single region of intere st.
This dataset was extrac te d from the two online public
databases DermQuest (Der, 2012) and Dermatology
Information Sy stem(DIS, 2012). Figure. 6 shows
some samples of our experimental dataset.
Figure 6: Samples of skin lesion i mages acquired by an op-
tical camera: (a) Melanoma cases and (b) Benign lesions.
Deep Neural Network for Fuzzy Automatic Melanoma Diagnosis
53

6.2 Evaluation Metrics
To evaluate the error rate of the diagnostic results,
some kind of performance metrics is determined in
terms of the true and false negative s as well as true
and false positives. Using these terms, the perfor-
mance of the classification is described by the sensiti-
vity, specificity an d accuracy metrics. Specificity de-
termines the proportion of negatives tha t are correctly
identified. In our work, it presents the percentage of
benign lesions which are correctly identified as be-
nign. Sensitivity defines the proportion of positives
that are correctly identified. Here, it presents the per-
centage of m elanomas which are correctly identified
as melanoma. Whereas acc uracy determines the pro-
portion of negatives and positives that are correctly
identified to the total nu mber o f benign lesions and
melanoma s. Thus, the perfect diagnostic test would
correctly classify skin lesions with 100% of sensiti-
vity, of specificity and of accur acy. T hese evaluation
metrics are expressed in the following equations:
Sen sitivity =
T P
T P + FN
× 100 (9)
Speci f icity =
T N
T N + FP
× 100 (10)
Accuracy =
T P + T N
T P + T N + FP + FN
× 100 (11)
where T P is the numb er of true positives, FP is
the number of false positives, FN is the numb er of
false negatives and TN is the number of true nega-
tives. Therefore, TP represents a correct malignant
prediction, FP is the incorr e ct malignant prediction,
FN defines the incorrect benign predictio n and T N
describes the correct benign prediction. Thus, FP and
FN should be minimized using the proposed CAD sy-
stem.
6.3 Performance Evaluation
The proposed CAD system allows decreasing FP va-
lue, which presents the most dangerous cases. Sen-
sitivity, specificity, a nd accuracy are the evaluation
metrics of our CAD system. They are calculated in
order to evaluate the diagnostic performance. Accor-
dingly, our system yields a good sensitivity of 90.1%,
an acceptable specificity of 84.4% and a good accu-
racy of 87.5% on our database.
6.4 Comparative Study
In this sectio n, we d e fine a comparative study of our
approa c h with five recent studies from the state-of-
the-art (Celebi and Zornberg, 2014; Codella et al.,
2017; L opez et al., 2017; Yu et al., 2017 ; Quang et al.,
2017). We are intere sted in comparing the results of
these different diagnostic approa ches to situate our
approa c h among the state of the art methods. These
previous works are considering dermoscopy images.
Each work d evelops autom ated systems of image ana-
lysis in order to detec t malignant melanoma from skin
lesion images.
About the work of (Celebi and Zornberg, 2014),
authors adopt a k-means clustering algorithm and a
symbolic regression fo r classification. T he classifica-
tion rates are nearly 75.8% for specificity, 7 1.7% for
accuracy, and 61.6% for sensitivity. In (Codella et al.,
2017), authors combin e feature extractors coded by
hand, sparse-coding approac hes, and Support Vector
Machines (SVM), with deep residual n etworks and
fully convolutional neural networks for decision ma-
king about melanoma. This work yields an accuracy
of 85%, specificity of 93% and sensitivity of 5 4%.
The work of Lopez et al. (Lopez et a l., 2017) is based
on an existing CNN architecture. Firstly, it trains the
CNN from scratch. Then, it uses the transfer learning
method to leverage features from a VGGNet model
pre-train ed on a larger data set. Finally, it keeps the
transfer learning method and fine-tuning the existing
CNN architecture. The classification rates are 81%
for accuracy and 78% for sensitivity. In (Yu et al.,
2017), Yu et al. deve lop deep networks, which have
more than 50 layers, for both segmentation and clas-
sification steps to acquire more relevant features for
more precise recognition. They use the residual le-
arning methods. Indeed, they develop a fully convo-
lutional residual n etwork (FCRN) usin g a multi-scale
contextual inform a tion integration scheme. The eva-
luation of this work yields a sensitivity of 54%, a spe-
cificity of 93% and an accuracy of 8 5%. Quang et
al. (Quang et al., 2017) use two different CNN ar-
chitectures to improve classification accuracy. The
first method adopts a simple CNN and it trains the
dataset from scratch. In the seco nd method, they are
based on VGG-16 with fine-tuning approaches in or-
der to make use of pre-trained VGG-16 on ImageNet
dataset. The classification rates of the first method
are 49% for accuracy, 83% for sensitivity an d 41%
for specificity. The second method achieves 79% for
accuracy, 34% for sensitivity and 90% for specificity.
We illustrate the perform ance metrics ( Spec ifi-
city, sensitivity, and accuracy) of the re sults of these
studies in Table 2. We note that m ost of the previous
studies are poor in term of sensitivity. Poor sensiti-
vity is due to high false negative r ates, i.e. the rate of
melanoma detection a s a benign lesion is high. Furt-
hermore, we remark that the previous studies based
on CNN architecture are working on unbalanced da-
VISAPP 2019 - 14th International Conference on Computer Vision Theory and Applications
54

Table 2: Comparative Study.
Performance Sensitivity (%) Sp ecificity (%) Accuracy (%)
(Celebi and Zornberg, 2014) 61.6 75.8 71.7
(Codella et al., 2017) 54 93 85
(Lopez et al., 2017) 78 - 81
(Yu e t al., 2017) 51 94 85
(Quang et al., 2017) Method 1 83 41 49
Method 2 34 90 79
Our work 90.1 84.4 87.5
taset between two classes ( 80% benign lesion class
and 20% melanoma class). Thus, the lesions are di-
agnosed as benign in most cases, and this leads to
increasing the specificity result rates. Therefore, we
are trying to improve the sensitivity in our study by
keeping an acceptable result of specificity. Indeed,
our CAD system achieves a good sensitivity of 90.1%
and an acceptable specificity of 84.4%. This is due
to the relevant extracted f eatures, the fuzzification of
feature modeling, and th e deep neur al ne twork ba-
sed classification. In conclusion, cla ssification using
fuzzy feature modeling exhibits the best sensitivity,
while reaching a better accuracy compared to all pre-
vious studies.
7 CONCLUSIONS
In this work, we propose an approach using fuz z y
feature modeling and DNN in orde r to help derma-
tologists and improve the accuracy o f melanoma di-
agnosis based on standard optical im a ges. Firstly,
we present a framework for modeling the extracted
features using FCM method and proposes BoW for
quantifying skin lesion characteristics for melanoma
detection. This BoW is modeled to describe some
human-observable characteristics. The output of this
feature modeling step is the membership degrees of
the lesion to the different label in BoW. Then, these
membersh ip degrees are applied as input to the DNN
classifier. The proposed approach achieves promising
results in a classification problem. It yield s the best
result in term of accuracy (87.5%)and of sen sitivity
(90.1%). However, this approach has some inconve-
niences that can be avoided in the future. In future
work, we will improve the specificity rates by adop-
ted the convolutional neural networks.
REFERENCES
(2012). Dermatology information system. www.dermis.net.
from DermIs.net.
(2012). Dermquest. www.dermquest.com. from University
of Cali fornia, San Francisco, UCSF.
Abbes, W. and Sellami, D. (2016). High-level features f or
automatic skin lesions neural network based classifi-
cation. In Image Processing, Applications and Sys-
tems ( IPAS), 2016 International, pages 1–7. IEEE.
Abbes, W. and Sellami, D. (2017). Automatic skin lesi-
ons classification using ontology-based semantic ana-
lysis of optical standard images. Procedia Computer
Science, 112:2096–2105.
Argenziano, G., Fabbrocini, G., Carli, P. , De Giorgi, V.,
Sammarco, E., and Delfino, M. (1998). Epilumi-
nescence microscopy for the diagnosis of doubtful
melanocytic skin lesions: comparison of the abcd
rule of dermatoscopy and a new 7-point checklist ba-
sed on pattern analysis. Archives of dermatology,
134(12):1563–1570.
Bickers, D. R ., Lim, H. W., Margolis, D., Weinstock, M. A.,
Goodman, C., Faulkner, E., Gould, C., G emmen, E.,
and Dall, T. (2006). The burden of skin diseases:
2004: A joint project of the american academy of der-
matology association and the society for investigative
dermatology. Journal of the American Academy of
Dermatology, 55(3):490–500.
Binder, M., Steiner, A., Schwarz, M., Knollmayer, S.,
Wolff, K., and Pehamberger, H. (1994). Applica-
tion of an artificial neural network in epiluminescence
microscopy pattern analysis of pigmented skin lesi-
ons: a pilot study. British Journal of Dermatology,
130(4):460–465.
Blum, A., Luedtke, H., Ellwanger, U., Schwabe, R., Rass-
ner, G., and Garbe, C. (2004). Digital image analysis
for diagnosis of cutaneous melanoma. development of
a highly effective computer algorithm based on ana-
lysis of 837 melanocytic lesions. British Journal of
Dermatology, 151(5):1029–1038.
Celebi, M. and Zornberg, A. (2014). Automated quantifi-
cation of clinically significant colors in dermoscopy
images and its application to skin lesionclassification.
IEEE systems journal, 8(3):980–4.
Chang, C.-C., Hsiao, J.-Y., and Hsieh, C .-P. (2008). An
adaptive median filter for image denoising. In In-
telligent Information Technology Application, 2008.
IITA’08. Second International Symposium on, vo-
lume 2, pages 346–350. IEEE.
Codella, N. C., Nguyen, Q.-B., Pankanti, S., Gutman, D.,
Helba, B., Halpern, A., and Smith, J. R. (2017). Deep
learning ensembles for melanoma recognition in der-
Deep Neural Network for Fuzzy Automatic Melanoma Diagnosis
55

moscopy images. IBM Journal of Research and De-
velopment, 61(4):5–1.
Dunn, J. C. (1973). A fuzzy relative of the isodata process
and its use in detecting compact well-separated clus-
ters.
Engasser, H. C. and Warshaw, E. M. (2010). Dermato-
scopy use by us dermatologists: a cross-sectional sur-
vey. Journal of the American Academy of Dermato-
logy, 63(3):412–419.
Facts, C. and Figures (2018). American cancer so-
ciety. https://www.cancer.org/content/dam/cancer-
org/research/cancer-facts-and-statistics/annual-
cancer-facts-and-figures/2018/cancer-facts-and-
figures-2018.pdf.
Ferlay, J., Shin, H.- R., Bray, F., Forman, D., Mathers, C.,
and Parkin, D. M. (2010). Estimates of worldwide
burden of cancer in 2008: Globocan 2008. Internati-
onal journal of cancer, 127(12):2893–2917.
Haralick, R. M., Shanmugam, K., et al. (1973). Textural
features for image classification. IEE E Transactions
on systems, man, and cybernetics, (6):610–621.
Henning, J. S., Dusza, S. W., Wang, S. Q., Marghoob, A. A.,
Rabinovitz, H. S., Polsky, D., and Kopf, A. W. (2007).
The cash (color, architecture, symmetry, and homoge-
neity) algorithm for dermoscopy. Journal of the Ame-
rican Academy of Dermatology, 56(1):45–52.
Kaliyadan, F. , Ashique, K. T., Jagadeesan, S., et al. (2018).
A survey on the pattern of dermoscopy use among der-
matologists in india. Indian Journal of Dermatology,
Venereology, and Leprology, 84(1):120.
Kuo, Y.-W., Chang, Y.-J., Wang, S .-H., Lu, P.-H., Su, Y.-L. ,
Chu, T. W., and Chu, G.-Y. (2015). Survey of der-
moscopy use by taiwanese dermatologists. Dermato-
logica Sinica, 33(4):215–219.
Lopez, A. R., Giro-i Nieto, X., Burdick, J., and Marques, O.
(2017). Skin lesion classification from dermoscopic
images using deep learning techniques. In Biomedical
Engineering (BioMed), 2017 13th I ASTED Internati-
onal Conference on, pages 49–54. IEEE.
Marchetti, M. A., Codella, N. C., Dusza, S. W., Gutman,
D. A., H elba, B., Kalloo, A., Mishra, N., Carrera, C.,
Celebi, M. E., DeFazio, J. L., et al. (2018). Results
of the 2016 international skin i maging collaboration
international symposium on biomedical imaging chal-
lenge: Comparison of the accuracy of computer al-
gorithms to dermatologists for the diagnosis of mela-
noma from dermoscopic images. Journal of the Ame-
rican Academy of Dermatology, 78(2):270–277.
Menzies, S. W., Ingvar, C., Crotty, K. A., and McCarthy,
W. H. (1996). Frequency and morphologic charac-
teristics of invasive melanomas lacking specific sur-
face microscopic features. Archives of Dermatology,
132(10):1178–1182.
Peizhuang, W. (1983). Pattern recognition with fuzzy ob-
jective function algorithms (james c. bezdek). SIAM
Review, 25(3):442.
Piccolo, D., Ferrari, A., Peris, K., Daidone, R., Ruggeri,
B., and Chimenti, S. (2002). Dermoscopic diagnosis
by a trained clinician vs. a clinician with minimal der-
moscopy training vs. computer-aided diagnosis of 341
pigmented skin lesions: a comparative study. British
Journal of Dermatology, 147(3):481–486.
Quang, N. H. et al. (2017). Automatic skin lesion analysis
towards melanoma detection. In Intelligent and Evo-
lutionary Systems (IES), 2017 21st A sia Pacific Sym-
posium on, pages 106–111. IE EE.
Ries, L. A., Harkins, D., Krapcho, M., Mariotto, A., Mill er,
B., Feuer, E. J., Clegg, L. X., Eisner, M., Horner, M.-
J., Howlader, N., et al. (2006). Seer cancer statistics
review, 1975-2003.
Sheha, M., Mabrouk, M., and Sharawy, A. (2012). Auto-
matic detection of melanoma skin cancer using texture
analysis. International Journal of Computer Applica-
tions, 42(20):22–26.
Smith, A. R. ( 1978). Color gamut transform pairs. ACM
Siggraph C omputer Graphics, 12(3):12–19.
Sordo, M. (2002). Introduction to neural networks in he-
althcare. Open Clinical: Knowledge Management for
Medical Care.
Stolz, W. (1994). Abcd rule of dermatoscopy: a new practi-
cal method for early recognition of malignant mela-
noma. Eur. J. Dermatol., 4:521–527.
Yu, L., Chen, H., Dou, Q., Qin, J., and Heng, P.-A.
(2017). Automated melanoma recognition in der-
moscopy images via very deep r esidual networks.
IEEE transactions on medical imaging, 36(4):994–
1004.
VISAPP 2019 - 14th International Conference on Computer Vision Theory and Applications
56
