
CloudCity: A Live Environment for the Management of Cloud
Infrastructures
Pedro Lourenc¸o
1
, Jo
˜
ao Pedro Dias
1,2
, Ademar Aguiar
1,2
and Hugo Sereno Ferreira
1,2
1
Department of Informatics Engineering, Faculty of Engineering, University of Porto, Portugal
2
INESC TEC, Porto, Portugal
Keywords:
Cloud Computing, Model-driven Development, Infrastructure Provisioning.
Abstract:
Cloud computing has emerged as the de facto approach for providing services over the Internet. Although hav-
ing increased popularity, challenges arise in the management of such environments, especially when the cloud
service providers are constantly evolving their services and technology stack in order to maintain position in a
demanding market. This usually leads to a combination of different services, each one managed individually,
not providing a big picture of the architecture. In essence, the end state will be too many resources under man-
agement in an overwhelming heterogeneous environment. An infrastructure that has considerable growth will
not be able to avoid its increasing complexity. Thus, this papers introduces liveness as an attempt to increase
the feedback-loop to the developer in the management of cloud architectures. This aims to ease the process
of developing and integrating cloud-based systems, by giving the possibility to understand the system and
manage it in an interactive and immersive experience, thus perceiving how the infrastructure reacts to change.
This approach allows the real-time visualization of a cloud infrastructure composed of a set of Amazon Web
Services resources, using visual city metaphors.
1 INTRODUCTION
Cloud Computing, in all its different forms, has
emerged as a new paradigm for provisioning services
over the Internet, in an on-demand self-service (Ab-
basov, 2014). Organizations can completely abstract
from hardware infrastructure management and fo-
cus on the virtual architecture, eradicating concerns
with resource maintenance and improving manage-
ability (Armbrust et al., 2009).
One of the essential characteristics and advantages
of the cloud is elasticity. The resources required to
meet service expectations can be rapidly scaled out-
wards and inwards to compensate for seesaw and un-
predictable business demand; creating an illusion of
infinite resource power. This flexibility allows the
organization to focus on the core business instead
of constantly maintaining provisioned infrastructure.
Consequently, most of the times, there is no exact
sense of location over the provided services, except,
in some cases, the ability to specify multiple higher
regions which can be used to increase reliability and
avoid network outages (Mell and Grance, 2011).
When services are made available in a pay-as-you-
go manner to the general public, resources are mon-
itored and metered, associating a cost depending on
the type of service and usage. This deployment model
is called a public cloud and associated with a Cloud
Services Provider (Armbrust et al., 2009).
While these services bring increased interoper-
ability and versatility, there is a substantial amount
of complexity in building and managing consistent
and reliable infrastructures, resulting in expert de-
velopers being required to implement cloud architec-
tures (Buyya et al., 2011).
As the market becomes more demanding and
evolves at lightning speed, new ”as-a-service” models
start to emerge (Erian, 2018; Mastelic et al., 2014).
As we keep going, the result is eventually an ex-
plosion of different services, each one managed in-
dividually, which causes challenges to arise in the
management of such environments. The largest chal-
lenge is to understand these complex cloud architec-
tures and the value they bring to the business. It’s
not trivial to understand and manage such infrastruc-
tures (Linthicum, 2016).
To clarify this point, 451 Research headlined the
fact that the cloud services provider AWS portfo-
lio provides more than 320,000 Stock Keeping Units
(SKUs), with around 53,000 of these added dur-
Lourenço, P., Dias, J., Aguiar, A. and Ferreira, H.
CloudCity: A Live Environment for the Management of Cloud Infrastructures.
DOI: 10.5220/0007699700270036
In Proceedings of the 14th International Conference on Evaluation of Novel Approaches to Software Engineering (ENASE 2019), pages 27-36
ISBN: 978-989-758-375-9
Copyright
c
2019 by SCITEPRESS – Science and Technology Publications, Lda. All rights reserved
27

ing the first two weeks of November 2017. Owen
Rogers, Research Director at 451 Research rein-
forced (Rogers, 2017):
Cloud buyers have access to more capabilities
than ever before, but the result is greater com-
plexity. [...] The cloud was supposed to be a
simple utility like electricity, but new innova-
tions and new pricing models, such as AWS
Reserved Instances, mean the IT landscape is
more complex than ever.
According to insights from
RightScale’s (RightScale, 2017)State of the Cloud
Report, comparing the years 2016, 2017 and 2018,
the number one (1) cloud challenges are the lack
of resources/expertise and security in cloud man-
agement. Despite observing a decline in nearly
all challenges compared with the previous year,
it is interesting to note governance/control is the
only challenge which has nearly stagnated in the
three-year comparison.
In this work, we intend to explore how cloud
management can benefit from model-driven engineer-
ing and live programming. Software visualization
attempts to solve a similar problem as the one that
live programming addresses - reducing programming
complexity by making it easier to understand quickly
what a program is doing or supposed to do (Tanimoto,
2013). By combining approaches from both areas we
intend to provide a live visualization method that pro-
vides continuous feedback about a virtual cloud in-
frastructure.
This paper is structured as follows: the Section 2
delves into the city visual metaphor along with other
core concepts of this work, Section 3 introduces dif-
ferent approaches for the management of cloud in-
frastructures, Section 4 presents an overview and ar-
chitecture details of our approach, CloudCity, Sec-
tion 5 presents the preliminary experiments carried on
to validate the approach and, to conclude, Section 6
gives some final remarks and points to future work.
2 CONTEXT
2.1 Software Visualization
Software visualization refers to the visualization of
information depicted and which composes software
and its development process by methods for static,
interactive and multi-dimensional visual representa-
tions (Diehl, 2007). Besides program source code,
the target artifacts can also include requirements, ar-
chitectural design, and bug reports. In this chapter we
investigate high-level abstractions or proper support
that could be transposed to the cloud environment, to
enhance the management experience.
Kapec in (Kapec, 2010)Visualizing software ar-
tifacts using hypergraphs developed a hypergraph-
based software visualization system. Relations can
be transposed to source-code as function calls or class
inheritance with visible links between edges and store
information about developers and tasks. Since hetero-
geneous programming environments are a common
practice (diverse language specifications) contribut-
ing to software complexity, the hypergraph combined
with visual data mining hides the actual implementa-
tion but captures the call relation.
Lanza and Ducasse (Lanza and Ducasse, 2003;
Lanza, 2004) present a software visualization tech-
nique enriched with metrics information. Polymet-
ric views intend to help understand the structure and
detect problems in the initial phases of a reverse en-
gineering process. The actual visualization requires a
layout, a set of metrics and a set of entities. A lay-
out considers the selected entities, relationships and
areas of interest into how they should be sorted and
displayed (e.g., a tree layout is better suited for the
display of an inheritance hierarchy than a circle lay-
out). The metrics, extracted from the source code en-
tities, heavily influence the resulting visualization, be-
ing good means to control the state of a software sys-
tem during development (Lanza and Ducasse, 2003).
To enhance the view, certain parts or entities of the
system are selected for visualization.
Wettel et al. (Wettel et al., 2011) conceptualize a
metaphor-based approach for visualization adopting
the urban domain as the central metaphor. Starting on
the influence of civil architecture on software engi-
neering, a city and a software system have many sim-
ilarities. Both are conceived during a planning phase,
in which requirements are a central piece; built incre-
mentally and require a ceaseless maintenance.
In this city metaphor, city elements (e.g., buildings
and districts) are mapped to software system compo-
nents (classes and packages respectively). Moreover,
to complement the visualization, physical properties
of the urban artifacts (e.g., color and dimensions) also
reflect attributes of the software components.
The concept was implemented in CodeCity by
Wettel et al. (Wettel et al., 2011) (Fig. 1) followed
by an empirical evaluation in a series of experimental
runs spanned over six months of time. The main re-
sults concluded that, for the program comprehension
and design quality assessment, the city metaphor en-
abled the creation of efficient software visualizations.
The city metaphor has also been explored recently by
other researchers in CityVR - an implementation of
ENASE 2019 - 14th International Conference on Evaluation of Novel Approaches to Software Engineering
28

Figure 1: A real representation of the code city of Ar-
goUML (Wettel et al., 2011).
the city metaphor using virtual reality in an immersive
3D environment medium to boost developer engage-
ment in software comprehension tasks (Merino et al.,
2017); ExplorViz - a VR approach following the 3D
city metaphor (Fittkau et al., 2015); VR City - a mod-
ification of the city metaphor in virtual reality envi-
ronment, with a different layout technique that pro-
vides a higher level of detail and positioning oriented
to the coupling between classes (Vincur et al., 2017);
SwiftCity - metaphor applied to Swift projects (Nunes
et al., 2017).
2.2 Live Programming
Programming is a strenuous task since most of the
work happens in a programmer’s mind while thinking
about how code executes, how to write it and update
it (McDirmid, 2013; Sean McDirmid, 2017). To find
the cause of errors, one should resort to debugging to
get feedback about how the code behaves (McDirmid,
2013). This step causes a break in the mental simula-
tion and the editing flow.
Live programming challenges this problem by
unifying the gap between code editing and debug-
ging (Sean McDirmid, 2017), re- executing the pro-
gram and providing a continuous feedback while edit-
ing (McDirmid, 2013). It is not a panacea for pro-
gramming environments, but potentially very impor-
tant for some. The ability to inspect and modify is
taken for granted in most IDEs, adding liveness is an
enhancement (Tanimoto, 2013).
Ideally, this concept is often made analogous to
a water hose: moving a stream of water in an ever-
evolving aim until the target is hit (Mcdirmid, 2016;
Sean McDirmid, 2017). Small changes to the pro-
gram should lead to small changes in the output.
However, this idea is difficult to realize since the code
is not directly related to program output, there is al-
ways a mental effort to produce relevant changes.
Challenges in this concept point out to how feed-
back can be considered harmful. Receiving continu-
ous results with change can be potentially distracting
in some cases and cause the programmer to write in a
certain order to ”keep it live”. For live programming
to succeed, it must enhance programming without re-
stricting what the programmer can do, either beginner
or expert (Mcdirmid, 2016).
Other criticism (as cited in (McDirmid, 2013))
highlights the fact that the steps in between execu-
tion are the most important part of programming.
Therefore, by using live programming, a programmer
would be hiding the critical flow of execution. This
argument can remit to the concern of merely focus
on updating the program output with successive code
changes. However, the focus of live is not solving
a ”right or wrong” programming model, where even
without applying this concept the same problem re-
mains. Nevertheless, from a debugging perspective,
live programming can address this concern combining
editing and debugging in time where updated debug
results are readily visible while editing (McDirmid,
2013). With this approach, the focus returns back to
the program flow and how changes affect certain parts
of execution.
For the purpose of managing cloud infrastructures
our aim is to receive continuous feedback on how ar-
chitectural (instead of code) changes affect the whole
system.
2.3 Cloud Management
Provisioning is defined as obtaining services from the
cloud, such as spawning computers or virtual hosts
and tailoring its software and configurations (Buyya
et al., 2011). It should not be confused with deploy-
ment, which does not necessarily imply provision-
ing. Deployment is the process of getting a new ap-
plication, or version, onto a prepared server (Sayers,
2017).
From the disconnection between the tradition-
ally considered development and operations activ-
ity, DevOps surges as a software engineering culture
that aims to unify software development (oriented to
change) and software operation (oriented to stabil-
ity) (Amazon Web Services, 2017b; Edwards, 2010).
The benefits of this model include:
•
Rapid Delivery. Quickly respond to customer
needs and move a change into production (Ama-
zon Web Services, 2017b; Edwards, 2010).
•
Reliability. Ensure the quality of application up-
dates and infrastructure changes through testing in
practices such as continuous integration and con-
tinuous delivery (Amazon Web Services, 2017b;
Edwards, 2010).
CloudCity: A Live Environment for the Management of Cloud Infrastructures
29

•
Scale. Automation and consistency help changing
systems efficiently and with reduced risk (Ama-
zon Web Services, 2017b).
•
Collaboration. Developers and operation engi-
neers share responsibilities and combine work-
flows (Amazon Web Services, 2017b).
For startups, the responsibilities are broadly
guided towards supporting development, followed by
build, continuous integration, and fast delivery (build-
ing an effective pipeline of releases). Expanding
companies focus more on configuration management,
testing, and production (Kerzazi and Adams, 2016).
2.3.1 Configuration Management
In a broader context, configuration management (CM)
is an important part of provisioning, which is de-
signed to methodically handle changes to a system
in order to maintain its integrity over time. Soft-
ware configuration management is often referenced
in a software engineering context, Pressman and
Maxim (Pressman and Maxim, 2015) define it as:
A set of activities designed to manage change
by identifying the work products that are likely
to change, establishing relationships among
them, defining mechanisms for managing dif-
ferent versions of these work products, con-
trolling the changes imposed, and auditing
and reporting on the changes made.
Automation is the heart of server configuration
management. It’s common to refer to configuration
management tools as Automation Tools or IT Au-
tomation Tools (Heidi, 2016).
2.3.2 Infrastructure Orchestration
On the other hand, orchestration tools define a dif-
ferent purpose, they are designed to enforce a work-
flow order to a set of automated tasks, such as the
provisioning of those resources. Both categories are
not mutually exclusive since some orchestration tools
can extend to configuration and vice-versa (Brikman,
2016).
Automation and orchestration are becoming crit-
ical concepts to the effective management of large-
scale cloud architectures allowing developers to cope
with unstable business need (Tosatto et al., 2015). In
this section, we intend to explore the most valuable
solutions to manage virtual machines, physical ma-
chines, and containers.
3 RELATED WORK
Derived from the lack of resources/expertise and abil-
ity to manage different cloud services, there has
been a growing interest in methods to support infras-
tructure provisioning, orchestration and configuration
management.
CloudFormation is an aws-based orchestration
tool to describe and provision infrastructure as
code (Amazon Web Services, 2017a). It features the
following aspects:
•
Modeling. The ability to model, in a single file,
the entire infrastructure, standardize all compo-
nents.
•
Automation. Infrastructure can be destroyed and
re-built in ”one-click”, without custom scripts,
and with roll-backs if errors are detected.
•
Version Control. Source files can be authored
and reviewed before deploying into production.
Source files can be formatted in two different lan-
guages: JSON or YAML and previously converted
into a graphical display which can help to analyze
relations between templates (Amazon Web Services,
2017a).
Terraform is another orchestration tool for build-
ing, changing and versioning infrastructure for ex-
isting service providers as well as custom in-house
solutions. Similarly to the previous competitor, re-
sources are defined as code, reflecting a blueprint of
the architecture which allows it to be versioned and
shared (HashiCorp, 2017). The key features are:
•
Execution Plans. Before infrastructure deploy-
ment, an execution plan synthesizes what ter-
raform will apply.
•
Resource Graph. The creation of non-dependent
resources can be parallelized, building infrastruc-
ture as efficient as possible.
•
Change Automation. Complex changes can be
applied to multiple services in incremental steps
with minimal human interaction.
Terraform differs from the previous competitor for
being cloud agnostic and enabling the combination of
multiple cloud service providers with a unified syn-
tax (HashiCorp, 2017). Configuration files follow a
declarative style where resources to be provisioned
are declared according to their desired end state.
Sandobalin et al., in his work presented a so-
lution to help the management of Infrastructure-as-
Code (IaC), through a domain specific language (San-
dobalin et al., 2017). ARGON is a modeling tool for
specifying the final state of the infrastructure and pro-
visioning of cloud resources. The tool aims to fo-
cus mainly on automation: automatic generation of
ENASE 2019 - 14th International Conference on Evaluation of Novel Approaches to Software Engineering
30
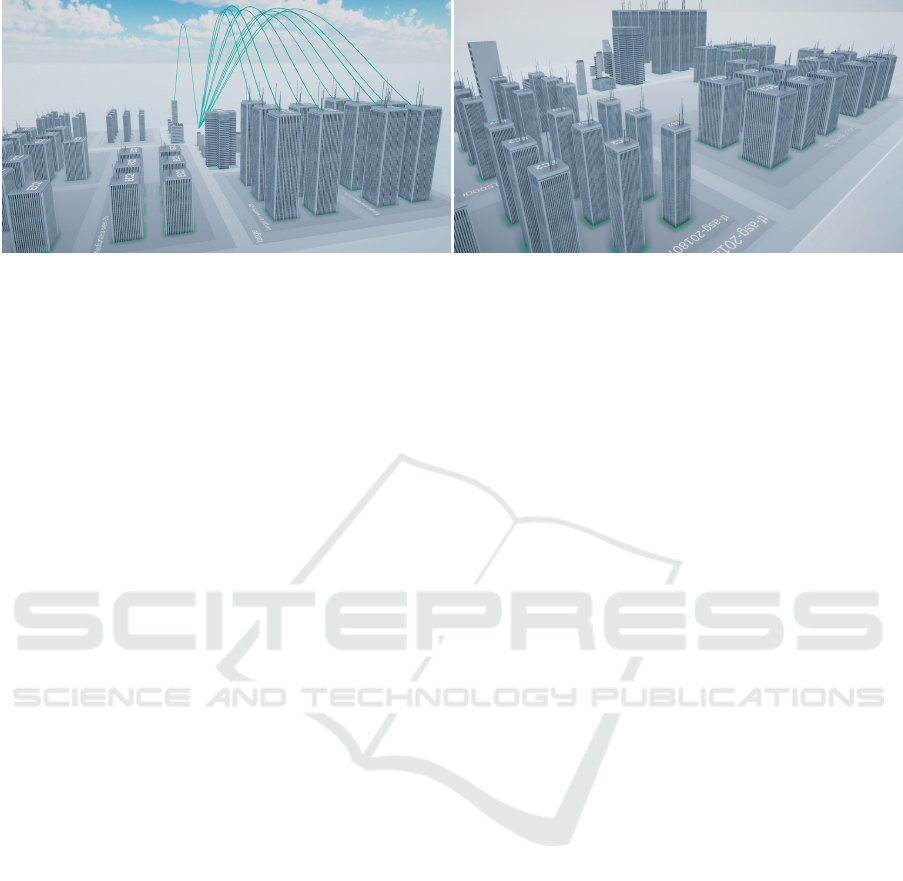
Figure 2: CloudCity’s main environment containing an small size example architecture, displaying a subset of the relations.
infrastructure provisioning scripts. One of the advan-
tages of this approach is the abstraction from the com-
plexity of working with different cloud providers, re-
sulting in a platform-independent metamodel and pre-
venting vendor lock-in.
Mastelic et al., in his work takes advantage of
model-driven development for building and manag-
ing arbitrary cloud services in a cloud-agnostic man-
ner (Mastelic et al., 2014). Through the CoPS meta-
model, cloud services are described using three se-
quential models: (a) Service, that defines services re-
quirements; (b) Product, that defines the arrangement
of the service; and (c) Component, that defines the
configuration of each component of the service.
4 CLOUDCITY
The 3D visualization method we propose for manag-
ing cloud infrastructures is a city metaphor. By def-
inition, the cloud is not a physical entity, and can-
not, by nature, be purely synthesized into a straight-
forward visually understandable mapping. Instead, it
can be transposed into other dimensions, such as code
or models, in order to ease its management. Repre-
senting the cloud as a city intends to enable users to
gradually become familiar with the represented archi-
tecture, due to the relationship with many similarities
between the two domains.
4.1 Overview
CloudCity is a live cloud management environment
which embodies the city metaphor. We opted for ex-
ploring this metaphor since it is has been picked and
validated by the software engineering scientific com-
munity as one with good empirical results in what
regards software visualization (see subsection 2.1).
The main concept is to allow the design and analy-
sis of cloud compositions through an intuitive map-
ping between city metaphors and cloud resources.
Each building contains a set of properties reflected
from the cloud, which can be inspected or modified
through simple interaction. Relations are depicted as
curved lines between two elements which can be fil-
tered and detailed on-demand. The main difference
from other model-driven approaches is that this en-
vironment doesn’t reflect a static infrastructure map-
ping, but instead a live infrastructure which shows the
real-time state of each component. A metaphor that
we introduce as, the live city.
4.2 Architecture
The definition of CloudCity follows the model-driven
engineering principles. Fig. 3 describes, in a high-
level, a representation of the system architecture. The
tool is composed of three core packages:
•
Cloud Service Providers API. Provides a con-
nection to a specific cloud service provider. For
our proof of concept we picked Amazon Web Ser-
vices among the existent options.
•
Importer. Periodically pools the provider and de-
tects changes in the infrastructure state, forward-
ing actions to update specific resources. In the
future this could be improved by using a publish-
subscribe solution.
•
Resources. To define resources and groups, we
implemented the composite pattern. A group of
resources can either contain a resource or an-
other resource group. If it contains another group,
the same applies recursively downwards the tree
structure.
Notwithstanding the fact that the proof of concept pre-
sented in this work currently only recognizes a unique
service provider; to mitigate the complexity of work-
ing with different cloud service providers and to open
the possibility of implementing their support in future
work, we prepared our architecture to support differ-
ent providers. For that reason, it was divided into two
different decoupled layers:
CloudCity: A Live Environment for the Management of Cloud Infrastructures
31
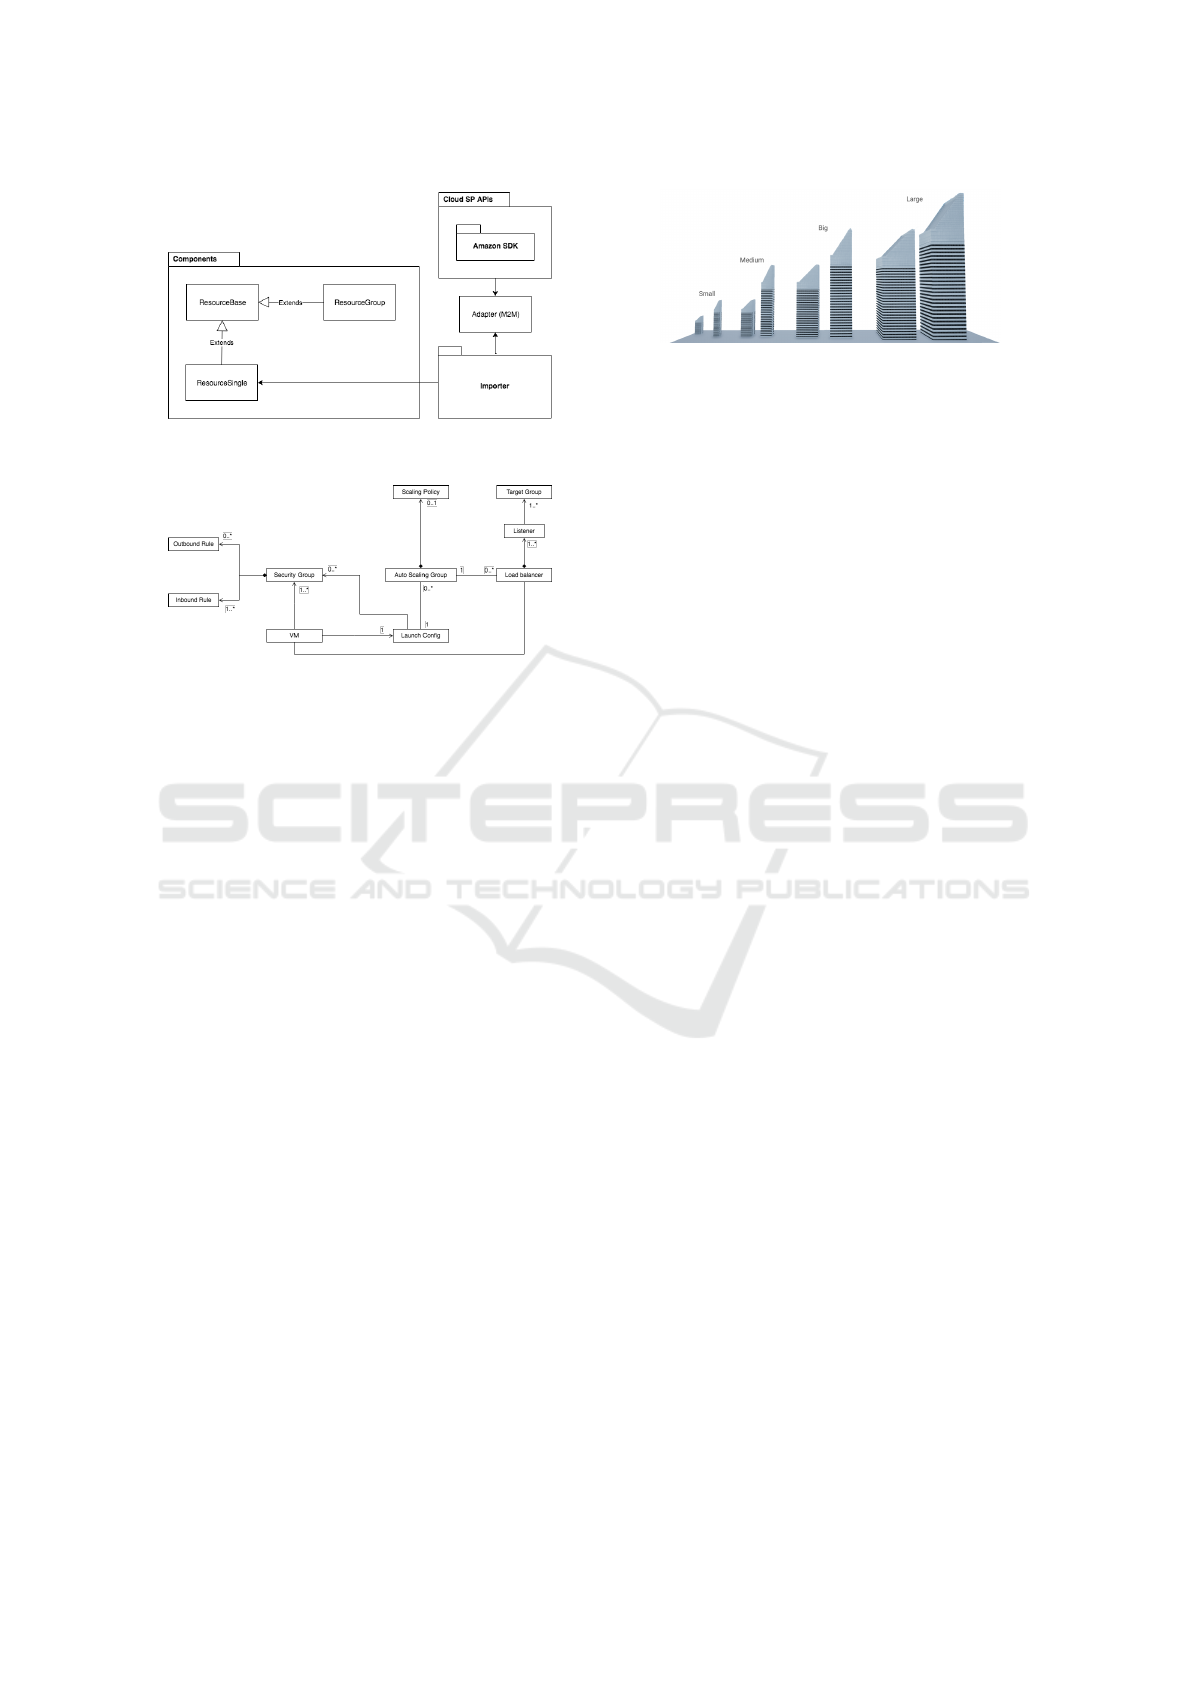
Figure 3: CloudCity’s architecture described by a package
diagram.
Figure 4: Infrastructure metamodel (inspired by the abstract
syntax presented in (Sandobalin et al., 2017)).
1. Platform Independent Model. Illustrated in
Fig. 4, this model is independent of any specific
provider.
2. Platform Specific Model. This model is coupled
with a specific provider and can be obtained with
a model to model transformation.
The proof of concept was implemented using a
multipurpose three-dimensional engine, Unity. This
technology decision was derived from being an en-
gine with extensive documentation and community
support, thus accelerating the implementation. Open-
ing room for new features to be studied and provide
support for Virtual/Augmented Reality (an interest-
ing perspective also studied in other approaches using
the City Metaphor, as in (Merino et al., 2017; Vincur
et al., 2017)).
4.3 Resource Mapping
One of the advantages of creating a visual map for the
cloud is that there is a finite set of resources, with pre-
dictable properties. Therefore, it allows us to create
an alphabet with models for each of the instances we
want to represent, rather than defining new metrics.
However, since cloud service providers must be
constantly adapting to maintain their position in a de-
manding market (Serrano et al., 2015), the result is
an increase in their service portfolio. As a proof of
concept, we prepared the environment to accept eight
popular services:
Figure 5: CloudCity’s reference building dimensions sorted
in ascending order.
1. Security Group: Security Groups act as a vir-
tual firewall to control instances inbound and out-
bound. Each group contains a set of rules which
controls the port range where traffic is allowed.
The metric chosen for the building height varies
according to the port range the security group
covers. Since the security group is a very com-
mon instance in a cloud architecture (an instance
can have from one up to five different groups),
the building dimensions correspond to the small
building type.
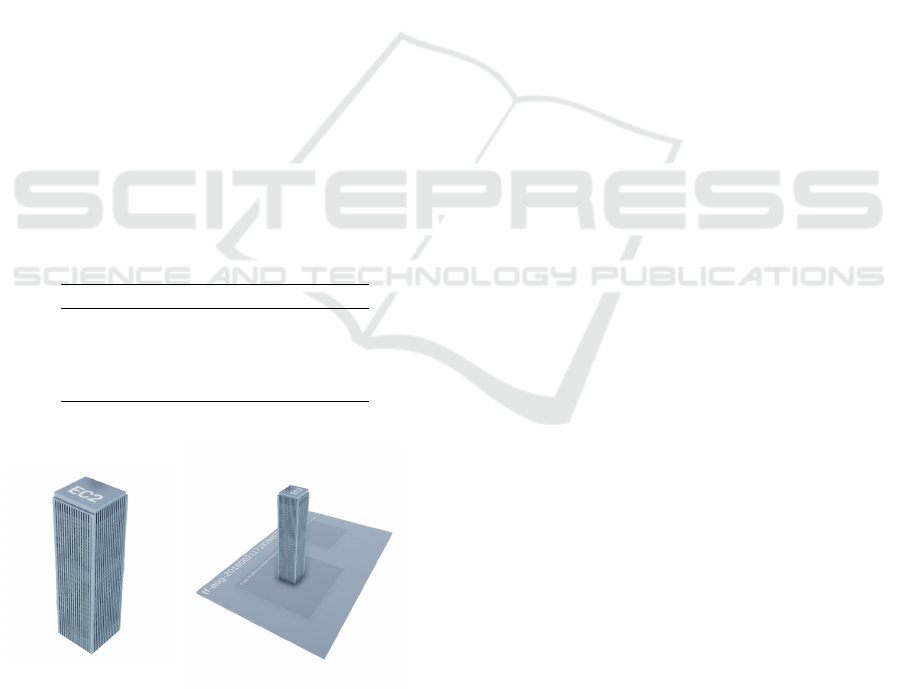
2. Virtual Machine: VMs provide scalable com-
pute capacity in the cloud. Each instance contains
a size, from a wide selection of instance types that
define the hardware specifications. The metric for
the building dimensions varies according to this
attribute (visually represented on Fig. 6).
3. Load Balancer: Load balancers are responsi-
ble for distributing traffic across multiple tar-
gets, achieving multi-tenancy and resource pool-
ing. One can have multiple listeners, to receive in-
coming connections and distribute them, accord-
ing to a rule (a specific host or path), to multi-
ple groups of targets. The metric chosen for the
building height varies depending on the number
of total rules the load balancer takes into consid-
eration when forwarding connections. Moreover,
since load balancing is a central component be-
tween the point of entry and the targets, we con-
sider it as part of the big buildings category.
4. Listener: The listener, related to load balancing,
is a process that checks for incoming requests on a
specific port and forwards them to a target group.
The metric chosen for the building height varies
in consonance with the number of rules it takes
consideration when forwarding a connection to
a specific group of targets. As for the building
type, since this component is a subset of the load
balancer, we chose to consider it as part of the
medium buildings category.
5. Target Group: A target group routes incoming
listener requests to one or more registered targets.
The metric chosen for the building height varies
depending on the number of instances registered
ENASE 2019 - 14th International Conference on Evaluation of Novel Approaches to Software Engineering
32
in it. As for the building type, since this com-
ponent can also be considered a subset of the load
balancer, it falls in the medium buildings category.
6. Launch Configuration: A launch configuration
is a parental reference of machine specifications
for a VM to be mirrored from. It is useful for
when the auto scaling group is expanding and
needs a source from where instances will be repli-
cated. The building type chosen for this compo-
nent depends on the instance type attribute (as in
Table 1).
7. Scaling Policy: Policies define how the scaling
group increases or decreases the size, and accord-
ing to which metric. The metric chosen for the
building height varies depending on the scaling
adjustment. As for the building type, since this
component can be considered a subset of the auto
scaling group, it falls in the medium buildings cat-
egory.
8. Auto Scaling Group: In contrast with the previ-
ous resources, an auto-scaling group is not repre-
sented by a building. Instead, since it is a group
with multiple VMs and scales dynamically, we
represent it as a plane with sufficient area to sup-
port the different availability zones and specific
VM (visually represented on Fig. 6).
Table 1: The building categories that correspond to specific
instance types.
Instance Type Building Type
Nano small
Micro/Small medium
large - 8xlarge big
8xlarge - 32xlarge large
Figure 6: Visual notation for a virtual machine by itself
(left), and as part of an auto-scaling group (right).
4.4 Layout
To provide a proper environment for live managing
cloud infrastructures, we need a mechanism to lay
out and update components as the architecture is ex-
panded and modified. In sum, the requirements are:
•
Support for laying out all the imported compo-
nents of the infrastructure, with different dimen-
sions, in an ordered manner;
•
Do not waste much of the cities’ real-estate (Wet-
tel et al., 2011);
•
Support for grouping components according to a
class.
Our first approach was to think of the components
and relations as a graph. The force-directed graph
layout is one of the most popular graph layout tech-
niques, it consists in applying spring-like forces to the
edges, attempting to achieve an aesthetically-pleasing
layout. However, the drawbacks of this technique
are: (a) intensive computation (naive approach), worst
case running time is proportional to the square of the
number of nodes, and (b) diverges from the standard
city metaphor - losing resemblance to a known envi-
ronment.
Another approach is the Tree-Map technique
which divides the existing space into rectangular
blocks according to an attribute of the respective ob-
ject. However, this method does not take into account
the dimensions and proportions of the buildings (Wet-
tel et al., 2011).
After all, the technique we chose for layering the
elements is CodeCity’s rectangle packing algorithm
proposed by Wettel et al. (Wettel et al., 2011). It starts
with an empty rectangular space, large enough to host
a set of exposed components. Each step of the algo-
rithm consists in layering the elements at the best free
space from a list of potential candidates. In case the
element does not cover the full space, we recursively
split the surplus in two different cuts available to host
new components, as depicted in Fig. 7.
4.5 Updates & Interaction
This section intends to address the most important
question in the implementation of this concept: how
to deal with infrastructural updates. The core idea to
our suggested approach would be a publish-subscribe
pattern that receives messages every time a change
happens in the environment. However, since the spe-
cific cloud provider we are working with doesn’t pro-
vide the means to integrate this style, we are forced
to periodically poll it and manually detect the differ-
ences.
CloudCity: A Live Environment for the Management of Cloud Infrastructures
33
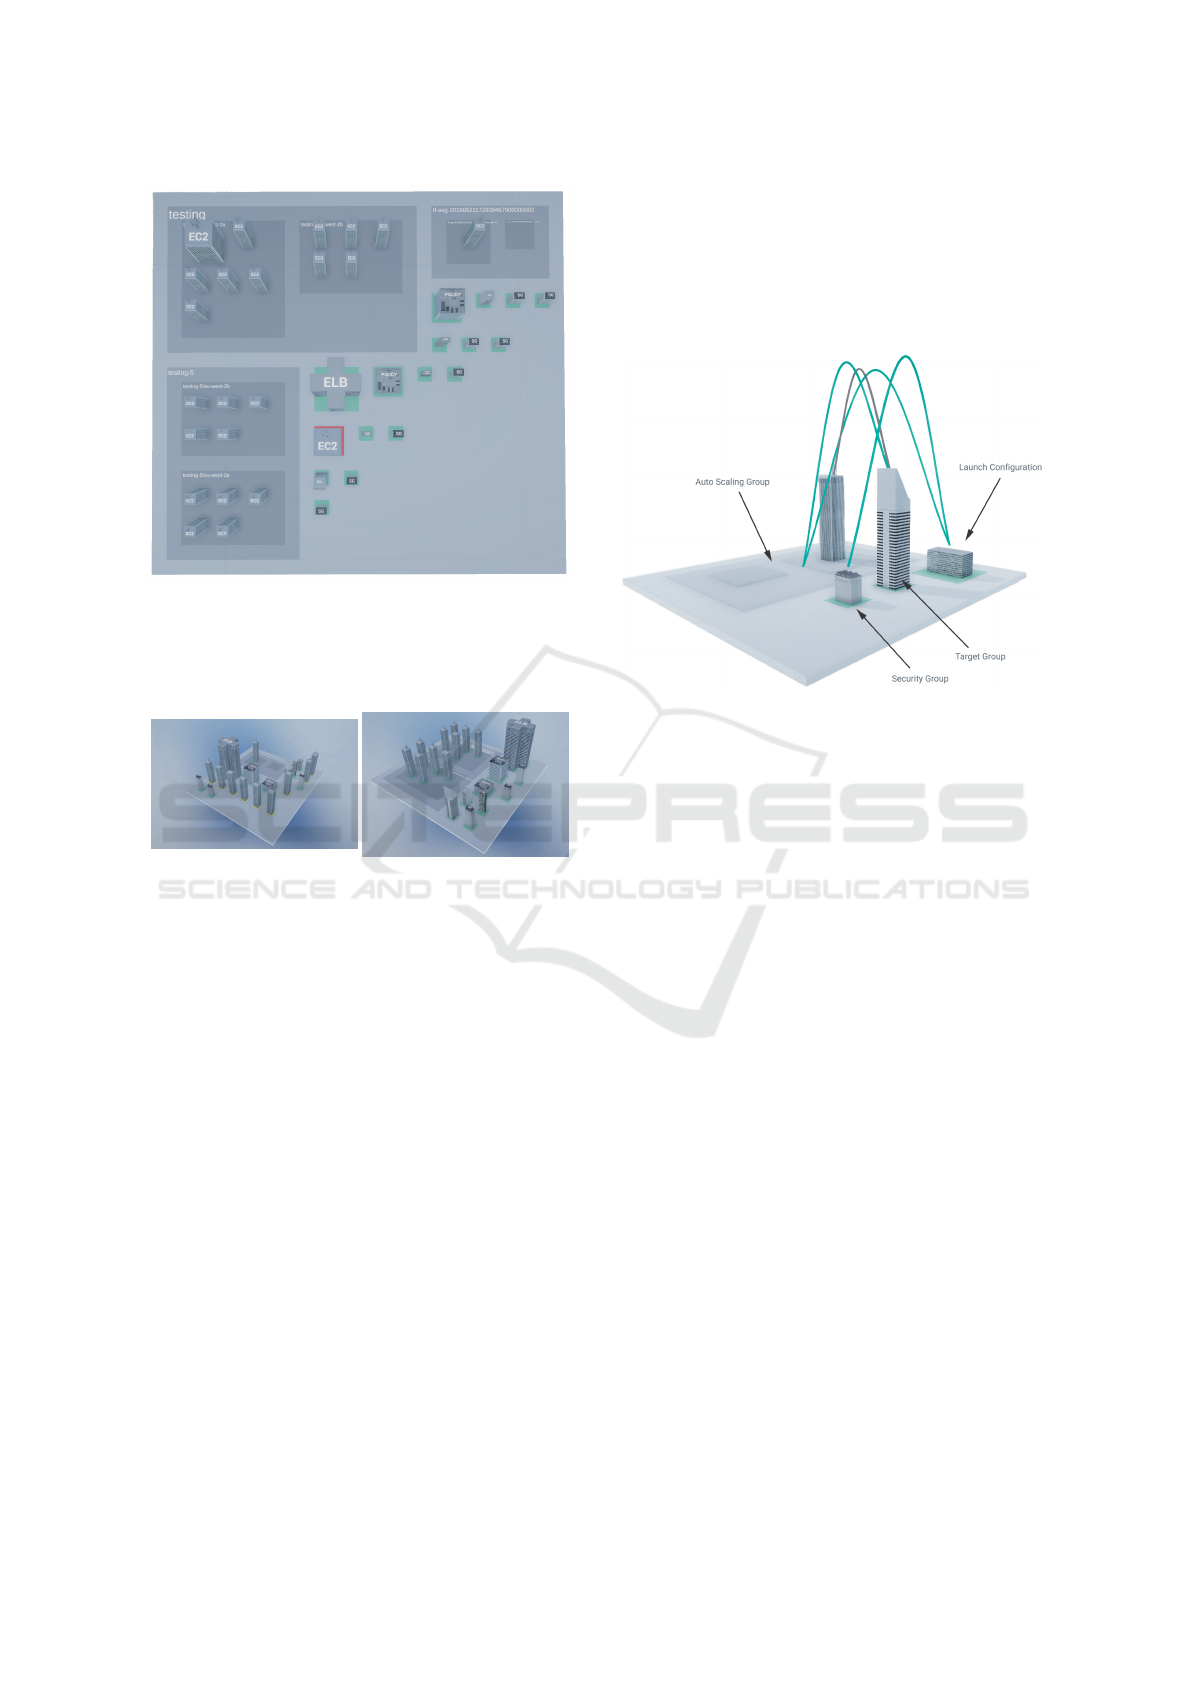
Figure 7: An example of the rectangle packing layout for
a considerable size infrastructure, composed of: three auto
scaling groups containing multiple size instances and two
scaling policies; a stopped test instance; one load balancer
and several security groups.
Figure 8: An illustration of an infrastructural update when
an auto-scaling group increases it’s desired capacity. The
number of instances changed from 1 to 10. For that reason,
nine new servers were spawned (Figure on the left) and then
attached inside the scaling group (Figure on the right).
Having considered a method to detect the change,
the next step is to refresh the infrastructure. The most
naive approach would be to destroy the whole infras-
tructure and rebuilt it. But, for efficiency reasons, we
decided not to destroy any element except if it has
been terminated. Instead, every time the layout needs
to re-position elements, only the affected ones will
change position, as depicted in Fig. 8.
All things considered, to avoid abrupt changes in
the layout, we prepared all components to change
their position slowly (speed of 1 unit per second) to in-
crease the response feedback (sliding in between po-
sitions).
Relations are mapped into arcs beginning at one
instance or group and ending in another. Both re-
sources and their relations may contain a state de-
pending on their nature which can also be inspected
by clicking them, and filtered when a specific compo-
nent is selected.
5 EXPERIMENTS AND RESULTS
In order to illustrate our approach, we conceived two
different phases, one being the construction of a cloud
infrastructure and another being the analysis of an ex-
isting, which is not the implemented in the first phase.
Figure 9: An illustration of the resulting CloudCity model
for the first phase experiment.
In the construction phase, we designed a typical
web-hosting reference architecture (excluding stor-
age) composed of four resources: (a) an auto-scal-
ing group with a minimum size of two instances;
(b) a launch configuration for each new instance to
be spawned inside the scaling group; (c) a security
group; and (d) a target group to route incoming re-
quests to the targets in the scaling group. The result-
ing model is depicted in Fig. 9.
As for the second phase, analysis, it consisted in
inspecting an existing infrastructure. In order to cre-
ate some independence between the two phases, we
prepared a different infrastructure using Terraform
containing: (a) an auto-scaling group in two zones
connected to the respective launch configuration;
(b) two scaling policies; (c) a load balancer with the
respective listener, target group and security group;
and (d) a web server.
The rationale for this assignment is to simulate the
occurrence of an unhealthy target, a common event
in a cloud environment. In most cases, the cause is
derived from a failed/overloaded instance or security
group misconfiguration. For that purpose, we mis-
configured a security group (firewall) on purpose in
one of the registered targets and disallow any traffic
coming from the target group. In consequence, the
target group will not be able to send health check re-
quests, and consider the instance unhealthy. The goal
is to locate that specific instance and analyze its cause,
targeting liveness level three: informative, significant
ENASE 2019 - 14th International Conference on Evaluation of Novel Approaches to Software Engineering
34
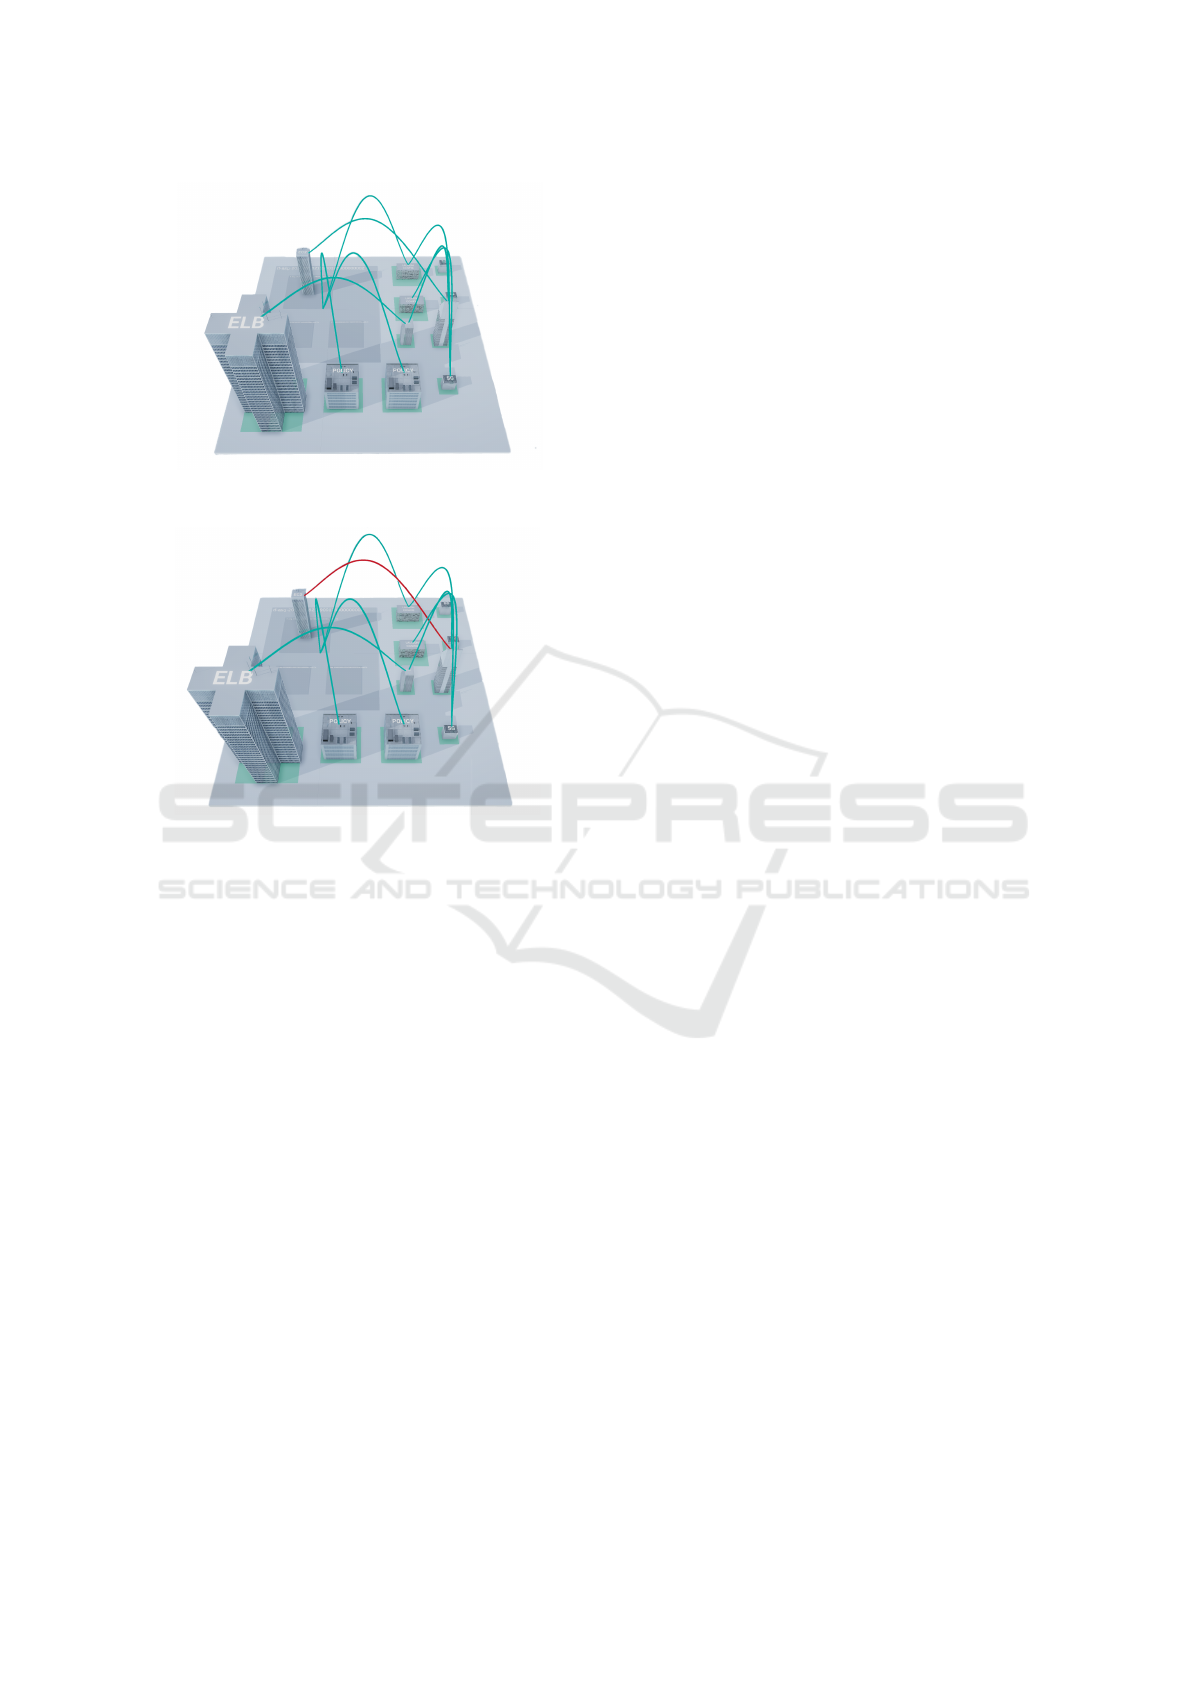
(a) The resulting model of the second phase of the ex-
periment according to Terraform’s configuration plan.
(b) The resulting model immediately after the miscon-
figuration of a security group, for the purpose of iden-
tifying the resulting infrastructural changes, in spe-
cific, a unhealthy instance.
Figure 10: Resulting visualizations of the experiments. The
connections between components (buildings) are represent-
ing connections and the floor gives information about the
group/context where the different components are placed. If
everything is operating normally both the connections and
floor colors are in green, otherwise the connections and/or
floor colors of each component turn red.
and responsive. Both the occurrences can be con-
firmed in Fig. 10a and Fig. 10b.
6 CONCLUSIONS AND FUTURE
WORK
In this paper, we started by analyzing the challenges
and evolution in the management of cloud environ-
ments, specifically, it is important to notice: (a) the
cloud service providers are constantly evolving their
services in order to maintain position in a demanding
market (b) this causes unavoidable increasing com-
plexity when too many resources are under manage-
ment in an overwhelming disheveled environment.
From the perspective of cloud management, the
main result is the contribution with an integrated
development environment; to analyze, architect and
configure cloud compositions with a higher level of
abstraction. Enabling architects to focus their inter-
ests in specific areas, and track the changes as the in-
frastructure evolves and the complexity increases.
Our approach combines the strengths of existing
approaches, techniques and tools by introducing live-
ness to cloud management and providing a complete
feedback loop which can help developers understand
how the infrastructure reacts to change, working to-
wards a Live Software Development (Aguiar et al.,
2019) approach for cloud management.
We believe the approach represents a considerable
improvement over current practices. When referring
to managing cloud infrastructures, the focus is specif-
ically cloud architecture configuration tasks.
Many issues were addressed by this work but it
has also uncovered other interesting areas and sub-
jects for further research based on this work, them
being: (a) provide a modifiable layout technique - a
user’s ability to manually modify the position of a
specific component; (b) explore other levels of live-
ness and (c) investigate different metaphors.
Furthermore, all the experiments carried on were
made to evaluate the sanity and viability of the ap-
proach. We consider that in the future several con-
trolled experiments must be carried on to assert the
usefulness of the work here presented.
ACKNOWLEDGEMENTS
This work is financed by the ERDF – European Re-
gional Development Fund through the Operational
Programme for Competitiveness and Internationali-
sation - COMPETE 2020 Programme within project
”POCI-01-0145-FEDER-006961”, and by National
Funds through the Portuguese funding agency, FCT
- Fundac¸
˜
ao para a Ci
ˆ
encia e a Tecnologia as part of
project ”UID/EEA/50014/2013”.
REFERENCES
Abbasov, B. (2014). Cloud computing: State of the art re-
seach issues. 8th IEEE International Conference on
Application of Information and Communication Tech-
nologies, AICT 2014 - Conference Proceedings.
Aguiar, A., Restivo, A., Figueiredo Correia, F., Ferreira,
H. S., and Dias, J. P. (2019). Live software devel-
opment: Tightening the feedback loops. In Confer-
ence Companion of the 3rd International Conference
CloudCity: A Live Environment for the Management of Cloud Infrastructures
35

on Art, Science, and Engineering of Programming,
Programming 2019 Companion. To Appear.
Amazon Web Services (2017a). Cloudformation.
Amazon Web Services (2017b). What is devops?
Armbrust, M., Fox, A., Griffith, R., Joseph, A., and RH
(2009). Above the clouds: A Berkeley view of cloud
computing. University of California, Berkeley, Tech.
Rep. UCB, page 1.
Brikman, Y. (2016). Why we use terraform and not chef,
puppet, ansible, saltstack, or cloudformation.
Buyya, R., Broberg, J., and Goscinski, A. (2011). Cloud
Computing Principles and Paradigms. John Wiley &
Sons, Inc., New Jersey.
Diehl, S. (2007). Software visualization: Visualizing
the structure, behaviour, and evolution of software.
Springer-Verlag.
Edwards, D. (2010). What is devops?
Erian, T. E. (2018). The xaas family: Understanding iaas,
paas and saas.
Fittkau, F., Krause, A., and Hasselbring, W. (2015). Explor-
ing software cities in virtual reality. 2015 IEEE 3rd
Working Conference on Software Visualization, VIS-
SOFT 2015 - Proceedings, pages 130–134.
HashiCorp (2017). Terraform vs. other software.
Heidi, E. (2016). An introduction to configuration manage-
ment.
Kapec, P. (2010). Visualizing software artifacts using hy-
pergraphs. Proceedings of the 26th Spring Conference
on Computer Graphics - SCCG ’10, page 27.
Kerzazi, N. and Adams, B. (2016). Who needs release and
devops engineers, and why? Proceedings of the Inter-
national Workshop on Continuous Software Evolution
and Delivery - CSED ’16, pages 77–83.
Lanza, M. (2004). CodeCrawler - Polymetric views in ac-
tion. Proceedings - 19th International Conference on
Automated Software Engineering, ASE 2004, pages
394–395.
Lanza, M. and Ducasse, S. (2003). Polymetric Views—
A Lightweight Visual Approach to Reverse Engineer-
ing. Transactions on Software Engineering (TSE),
29(9):782–795.
Linthicum, D. S. (2016). Understanding Complex Cloud
Patterns. IEEE Cloud Computing, 3(1):8–11.
Mastelic, T., Brandic, I., and Garcia, A. G. (2014). Towards
Uniform Management of Cloud Services by Apply-
ing Model-Driven Development. 2014 IEEE 38th
Annual Computer Software and Applications Confer-
ence, pages 129–138.
McDirmid, S. (2013). Usable live programming. In Pro-
ceedings of the 2013 ACM International Symposium
on New Ideas, New Paradigms, and Reflections on
Programming & Software, Onward! 2013, pages 53–
62, New York, NY, USA. ACM.
Mcdirmid, S. (2016). The Promise of Live Programming.
LIVE Programming Workshop.
Mell, P. and Grance, T. (2011). The NIST Definition of
Cloud Computing Recommendations of the National
Institute of Standards and Technology. pages 2–3.
Merino, L., Ghafari, M., Anslow, C., and Nierstrasz, O.
(2017). Cityvr: Gameful software visualization.
In 2017 IEEE International Conference on Software
Maintenance and Evolution (ICSME), pages 633–637.
Nunes, R., Reboucas, M., Soares-Neto, F., and Castor, F.
(2017). Visualizing swift projects as cities. Proceed-
ings - 2017 IEEE/ACM 39th International Conference
on Software Engineering Companion, ICSE-C 2017,
pages 368–370.
Pressman, R. S. and Maxim, B. R. (2015). Software En-
gineering: A Practitioner’s Approach. McGraw-Hill
Education.
RightScale (2017). State of the Cloud Report. Technical
report, RightScale.
Rogers, O. (2017). Voice of the enterprise: Cloud transfor-
mation. AWS re:invent.
Sandobalin, J., Insfran, E., and Abrahao, S. (2017). An In-
frastructure Modelling Tool for Cloud Provisioning.
Proceedings - 2017 IEEE 14th International Confer-
ence on Services Computing, SCC 2017, pages 354–
361.
Sayers, D. (2017). Configuration management vs. applica-
tion release automation.
Sean McDirmid (2017). Live Programming as Gradual Ab-
straction. LIVE Programming Workshop.
Serrano, N., Gallardo, G., and Hernantes, J. (2015). Infras-
tructure as a Service and Cloud Technologies. IEEE
Software.
Tanimoto, S. L. (2013). A perspective on the evolution of
live programming. In 2013 1st International Work-
shop on Live Programming, LIVE 2013 - Proceedings,
pages 31–34.
Tosatto, A., Ruiu, P., and Attanasio, A. (2015). Container-
Based Orchestration in Cloud: State of the Art and
Challenges. Proceedings - 2015 9th International
Conference on Complex, Intelligent, and Software In-
tensive Systems, CISIS 2015, pages 70–75.
Vincur, J., Navrat, P., and Polasek, I. (2017). VR City: Soft-
ware Analysis in Virtual Reality Environment. 2017
IEEE International Conference on Software Quality,
Reliability and Security Companion (QRS-C), pages
509–516.
Wettel, R., Lanza, M., and Robbes, R. (2011). Software sys-
tems as cities. In Proceeding of the 33rd international
conference on Software engineering - ICSE ’11.
ENASE 2019 - 14th International Conference on Evaluation of Novel Approaches to Software Engineering
36
