Live Software Development Environment
for Java using Virtual Reality
Diogo Amaral
1
, Gil Domingues
1
, Jo
˜
ao Pedro Dias
1,2
, Hugo Sereno Ferreira
1,2
, Ademar Aguiar
1,2
and
Rui N
´
obrega
1,2
1
Department of Informatics Engineering, Faculty of Engineering, University of Porto, Portugal
2
INESC TEC, Porto, Portugal
Keywords: Software Engineering, Virtual Reality, Live Programming, Software Visualization, Software Analysis.
Abstract:
Any software system that has a considerable growing number of features will suffer from essential complexity,
which makes the understanding of the software artifacts increasingly costly and time-consuming. A common
approach for reducing the software understanding complexity is to use software visualizations techniques.
There are already several approaches for visualizing software, as well as for extracting the information needed
for those visualizations. This paper presents a novel approach to tackle the software complexity, delving into
the common approaches for extracting information about software artifacts and common software visualization
metaphors, allowing users to dive into the software system in a live way using virtual reality (VR). Experiments
were carried out in order to validate the correct extraction of metadata from the software artifact and the
corresponding VR visualization. With this work, we intend to present a starting point towards a Live Software
Development approach.
1 INTRODUCTION
The constant increase in complexity and size of soft-
ware systems makes their understanding costly and
time-consuming, especially when this understanding
is carried out by a programmer distant in the time or
space of its original author. This difficulty constitutes
an obstacle to the following maintenance processes,
whether corrective or evolutionary, that can not be
performed without the complete understanding of the
system.
Although best practices in software development
are used, a system that has considerable growth will
not be able to avoid increasing its essential complex-
ity, which shows that the systems may take a long time
to be understood and evolved by users. Comprehen-
sive analysis tasks are required which translates into
high costs.
Here we delve into an approach to mitigate this
problem by allowing users to literally enter the sys-
tem in a live way using virtual reality. A tool was
developed for Java systems that receives information
about the static and dynamic analysis of the system,
using reverse engineering approaches, such as the
ones presented by Fauzi et al. (Fauzi et al., 2016) and
Gu
´
eh
´
eneue et al. (Gu
´
eh
´
eneuc, 2004). The tool must,
Software
System
Static
Software
Analysis
Tools
Dynamic
Software
Analysis
Tools
Repository
Visualization
Engine
User
Figure 1: Diagram of the idealized Live Software Develop-
ment environment.
in real time and during the execution of the system,
allow its visualization using metaphors. The interac-
tion with the system in full execution is a key factor,
following concepts of live programming that create a
fluid feedback-loop between the program and the pro-
grammer, as depicted in Fig. 1. This new approach of
live software development resorts to the virtual reality
for the construction of an environment, through which
it is possible to understand the system and visit it in
an interactive and immersive way.
The work here presented intends to dive into the
novel Live Software Development paradigm (Aguiar
et al., 2019), adding to the liveness (Tanimoto, 2013)
Amaral, D., Domingues, G., Dias, J., Ferreira, H., Aguiar, A. and Nóbrega, R.
Live Software Development Environment for Java using Virtual Reality.
DOI: 10.5220/0007699800370046
In Proceedings of the 14th International Conference on Evaluation of Novel Approaches to Software Engineering (ENASE 2019), pages 37-46
ISBN: 978-989-758-375-9
Copyright
c
2019 by SCITEPRESS – Science and Technology Publications, Lda. All rights reserved
37

the virtual reality, representing an added value to soft-
ware engineers dealing with large systems. Also, we
believe that this work eases the process of understand-
ing software systems.
The paper is structured as follows: Section 2
overviews the current state-of-the-art on live pro-
gramming, software visualization, software analysis
and virtual reality; Section 3 overviews our approach
towards live software development, including archi-
tecture details; Section 4 presents the preliminary ex-
periments carried on to validate the approach; and,
finally, Section 5 provides some final remarks and
points to further work.
2 LITERATURE REVIEW
This work involves different areas, being Live Pro-
gramming, Software Visualization, Software Analy-
sis and Virtual Reality, the most relevant topics here.
2.1 Live Programming and Liveness
The fundamental notion of liveness is that, instead of
having a traditional program development cycle in-
volving four phases — edit, compile, link, run —
there is only one phase, at least in principle. This
phase involves the program constantly running, even
if various editing events occur (Tanimoto, 2013).
Live programming, which embraces the concept
of liveness, aims to ease the programming task by ex-
ecuting a program continuously during editing (real-
time programming). Looking back at Hancock’s anal-
ogy, consider hitting a target with a stream of wa-
ter: we receive continuous feedback on where we are
shooting, whereas, with archery, we need to shoot
(run the software) and rely on the discrete feedback
(debugging) provided by the point the arrow hit, ad-
justing the aim if necessary (McDirmid, 2013).
This is not a recent notion; LISP machines, the
Smalltalk language, and the Logo language are a few
examples of uses of live programming in the earlier
days of computing. In addition to software visual-
ization, liveness is also closely related to visual pro-
gramming, which simply put provides a simpler, more
intuitive interface to develop and modify the software.
2.2 Software Visualization
Software visualization is important to enhance com-
prehension. The software is inherently invisible,
which does not help the task of understanding how a
project functions. Visualization tools are necessary to
associate a tangible representation to the code and the
program execution. This is especially relevant in the
maintenance, reverse engineering, and re-engineering
cases (Koschke, 2003).
Bassil et al. show evidence that the most com-
monly used visualization methods are representations
based on graphs. In fact, there are plenty of exam-
ples in literature (Sadar and J, 2015; Bartoszuk et al.,
2013) which output graphs to represent the relation-
ships between levels of a system (Bassil and Keller,
2001). We can consider that are mainly three ap-
proaches for software visualization, namely: static,
dynamic and 3D-based visualizations.
CodeCrawler (Lanza and Ducasse, 2003) is a vi-
sualization tool which provides the possibility of visu-
alizing data retrieved from other reverse engineering
tools, offering a visual encoding that allows five met-
rics to be represented per entity. The visualization is
deciding by choosing the layout, the five metrics out
of a defined list (Lanza and Ducasse, 2003) and the
entities for which to represent those metrics.
Jinsight is an example of a tool created for the
purpose of visualizing program runtime data. It pro-
vides multiple views to increase the probability of the
user being able to detect existing performance issues,
unexpected behavior or bugs. The information used
by this tool is extracted from the resulting data of the
JVM profiling agent (De Pauw et al., 2002).
While the most common software visualization
methods are two-dimensional representations, Wettel
et al. present a 3D representation of the architecture
of software as a city, where the user can freely move
around and observe and interact with the system (Wet-
tel et al., 2011). This approach is a pure visualization
system not dealing with real time modifications of the
running system.
Teyseyre et al. (Teyseyre and Campo, 2009) dis-
cusses the use of 3D software representations and how
they have been approach up until this point. Repre-
sentations have mostly been in one of two ways: ab-
stract visual or real-world representations. Abstract
visual representations are graphs, trees, and other ab-
stract geometric shapes, while an example of real-
world representations is a city metaphor.
2.3 Structural and Dynamic Analysis
The source code is the representation most familiar
for developers. It is how software is built and modi-
fied. However, it is not necessarily the best when the
goal is easy software comprehension.
For that purpose, different and higher levels of ab-
straction are useful to increase the developers’ un-
derstanding of the software, by elevating above the
finer grained implementation details. UML is an ex-
ENASE 2019 - 14th International Conference on Evaluation of Novel Approaches to Software Engineering
38

ample of a higher level representation of a system’s
structure and behaviour (Rumbaugh et al., 2004), be-
ing amongst the most popular for object-oriented sys-
tems.
To develop a higher level abstraction, it is required
to obtain the existent structural information from the
system. The focus of this section is to find how a
software’s structural information can be obtained.
Feijs et al. (Feijs et al., 1998) describe a model for
analyzing architecture: the Extract-Abstract-Present
model. Extraction consists on retrieving structural in-
formation from the system, abstraction is the deriva-
tion of new relationships between the components ob-
tained in the earlier phase (that is, a further analysis
of those components) and the presentation of that in-
formation through a graphical format.
2.3.1 Software Reverse Engineering
Fauzi et al. (Fauzi et al., 2016), identifies reverse en-
gineering as a valid approach to generate sequence di-
agrams that reflect a system’s behavior. For this, the
authors use a software’s abstract syntax tree (AST).
Although one may assume reverse engineering
makes use solely of static representations, such as
source code or bytecode, this is not the case. There
are instances in literature where static and dynamic
analysis are combined. Gu
´
eh
´
eneuc et al. (Gu
´
eh
´
eneuc,
2004) demonstrate how a mixture of static and dy-
namic models allows for a more precise automatic
generation of class diagrams. Furthermore, Shi et
al. (Shi and Olsson, 2006) describe PINOT, a tool
to automatically detect design patterns from both the
source code and the system’s behavior.
2.3.2 Abstract Syntax Trees
Abstract syntax trees (AST) are one of the data struc-
tures used by compilers to create an intermediate rep-
resentation of the software, thus becoming an inter-
esting starting point for analyzing the structure of a
software system. It creates a structure from the in-
put (source code) that ignores unnecessary syntactic
details (Jones, 2003).
Baxter et al. (Baxter et al., 1998) states that the
reduction of duplicated code, leads to reduced main-
tenance costs, and describes the application of a tool
that uses ASTs to detect said duplicates. In this case,
the AST provides a representation that is easier to
compare, as opposed to lines of code, where chang-
ing variable names or inserting comments, for exam-
ple, would increase the number of false negatives.
2.3.3 Dynamic Analysis
Obtaining a software system’s structure is not suffi-
cient to understand how it behaves. There are multi-
ple sources of variability that cannot be taken into ac-
count during a static analysis. User input, the perfor-
mance of shared resources and variable control flow
paths all contribute to the fact that the source code
does not predict the exact behavior during the execu-
tion of the program (Gosain and Sharma, 2015).
To compensate for this lack of information, the
system should be observed during runtime. For ex-
ample, logging is a very common practice in software
development to record dynamic information of a pro-
gram’s execution (Yuan et al., 2012).
Dynamic analysis can be implemented in three
different ways. Gosain et al. (Gosain and Sharma,
2015) describe the different approaches and tools as-
sociated.
2.4 Virtual Reality
Virtual Reality (VR) is used to create the real or vir-
tual simulations, applies the theory of immersion in a
3D virtual space where the senses resemble the real
world (Singh and Singh, 2017). The presence of in-
vestments in the research and development of VR has
been driven by the decrease in size and costs of VR
equipment, such as headsets. For example, nowadays
anyone can have a VR device, be it more sophisticated
or cheap, created with a card.
Although still few software visualization tools use
VR for comprehension tasks (Merino et al., 2017),
some applications have already been developed. As
example, VR City (Vincur et al., 2017) uses an ani-
mation to demonstrate which classes and methods un-
dergo changes in a sequence of commits, previously
provided to the tool.
In general, the use of an immersive environment is
an added value for visualization and interaction with
the created representation of the software system.
3 LIVE VR ANALYSIS SYSTEM
This work focuses on providing a VR environment
to improve software comprehension through the vi-
sual representation of the software structure and run-
time behavior. To obtain data about the software sys-
tem under analysis a metadata extraction and storage
framework was developed, which, using static and dy-
namic analysis strategies, captures relevant informa-
tion about the software system.
Live Software Development Environment for Java using Virtual Reality
39

The software artifact metadata extracted with the
framework (both static and dynamic) is then used by
the visualization engine, that renders a software visu-
alization following a city metaphor. This visualiza-
tion provides different visual elements in order to un-
derstand the software, as, for example, representing
packages as blocks and classes as buildings, among
other representations.
The framework is responsible for the extraction,
storage, and distribution of information regarding a
software project, so far in Java. The information
should be extracted from a development environment
and affect the analyzed source code as minimally as
possible. It should then be possible to access this in-
formation and be notified of any live modifications.
As software comprehension is inherently tied to
development and maintenance, we assume the tools
which will request information from this framework
will do so from a development environment.
The environment allows the visualization of spa-
tial and temporal content through the use of VR. The
implementation of metaphors that allow the 3D visu-
alization of familiar contents to the users favors the
understanding of the information. The interaction
with this content is a plus. At this point, the use of
VR equipment such as simple headsets and controls
gives the user the opportunity to control the flow of
software execution and to traverse the space created
by the metaphor. The control of the execution visual-
ization is in the hands of the user.
3.1 Architecture Overview
The proposed approach for this process will begin
by determining which are the metrics that best rep-
resent the structure and behavior of a Java system.
Although we consider that a similar approach target-
ing another systems beyond the Java-based ones will
produce similar results, here we will maintain the fo-
cus on Java systems.
As the point of origin of this analysis is the source
code, there are two main paths that can be followed:
reverse engineering and forward engineering.
3.1.1 Reverse Engineering
Through reverse engineering, higher-level representa-
tions of the software can be extracted. This will be the
basis of the static structural analysis.
We will make use of two representations of a Java
project. First, the Java Model used by the Eclipse
IDE, which contains information about the Java ele-
ments such as compilation units, packages, methods,
among others. Secondly, the AST of the software,
which is a data structure used by the Java compiler
and can be used to overlook minor syntactic details of
the code and arrive at an easier to understand repre-
sentation of the source code structure, from package
level down to method level. The combination of these
two representations will provide the information on
how the system is composed as well as empower the
next process.
3.1.2 Forward Engineering
Forward engineering, as opposed to reverse engineer-
ing, leads to lower level representations of the sys-
tem. This will be the process through which we will
observe the system’s behavior.
Among the several approaches to forward engi-
neering, namely: instrumentation, virtual machine
profiling, and aspect-oriented programming and after
an overall analysis of how straightforward it is to im-
plement these approaches to the selected case studies,
we conclude that the best fit was a mix of both virtual
machine profiling and code instrumentation.
The selected approach was then used for execution
tracing, through event logging, at a granularity that
best fits the needs of the visualization component. As
an example, we can log every method call, register-
ing the calling class, the called method, and the used
arguments.
Monitoring would also be a viable option for rel-
evant behavior information. We would need to define
resource usage or function execution time thresholds
so that an event is logged when one of those thresh-
olds is violated.
3.2 Structural Analysis
First and foremost, a tool whose purpose is to increase
software comprehension will require information on
how the software in question is composed structurally.
As stated before, in the specific case of a Java project,
the AST can be used to abstract from syntactic details
from the language and provide a structure of the ele-
ments generated from the source code which is con-
siderably easier to interpret.
In order to have easier access to the AST as well
as some other structural details of a Java project,
and given the assumption of development environ-
ment mentioned earlier, the software structure anal-
ysis component was envisioned as an IDE plug-in.
A Java oriented Eclipse IDE contains the Java De-
velopment Tools which allows a plug-in developer to
access to the structures Eclipse uses to represent Java
projects of all the projects in the workspace. In order
to make use of these capabilities, the structure analy-
sis tool was developed as an Eclipse plug-in.
ENASE 2019 - 14th International Conference on Evaluation of Novel Approaches to Software Engineering
40

3.2.1 Structure
Before deciding what the internal representation of
the workspace for the plug-in will be, it is neces-
sary to understand the structures Eclipse JDT pro-
vides access to: the abstract syntax tree (AST) and
the Java Model. The AST is composed of ASTN-
odes, which can also be composed of other ASTN-
odes. Each ASTNode represents a Java language
source code construct, such as name, type, expres-
sion, statement or declaration. Several other classes
exist that extend ASTNode in order to include at-
tributes and methods specific to the source code con-
struct they represent.
Given its proximity with the source code, the AST
allows fine-grained information on where some el-
ements are located in a source file. For example,
through the AST it is possible to know what is the
index of the starting character of method declaration
and its length in characters.
Nevertheless, the fact that the AST is a powerful
representation of a project comes with a significant
drawback. Due to its fine-grained structural nature,
it is considerably more complex to navigate than the
Eclipse Java Model.
The Java Model is composed of the classes which
model the elements that compose a Java program.
These classes range from IJavaModel, which repre-
sents the workspace in question, IJavaProject, which
represents the project itself, to IMethod and IType,
which represent methods and classes respectively.
As the Java Model structure is considerably easier
to traverse than the AST due to its coarser granularity,
it was used as the main source of information about
the project to build the internal model.
3.2.2 Generating the Representation
The actual process of extracting the structure of the
projects in the workspace is based on a progressive
descent through the Java Model. Before the Java
Model can be analyzed, it has to be generated from the
IWorkspace class, which represents the workspace in
a language-agnostic manner. This is done by invoking
JavaCore’s create a method with the current IWorkws-
pace as an argument.
Once the Java Model is obtained, we analyze each
project in the workspace. The analysis of an element
of a certain level in the Java Model implies the anal-
ysis of all their child elements. For example, analyz-
ing one project implies analyzing that project’s pack-
age fragments, which further implies analyzing each
package fragment’s compilation units, and so on.
Although this process may seem trivial, there are
some points worth noting in regards to the extrac-
tion of the lower level elements in the model. There
are cases in which obtaining the child elements of a
specific parent element is not as linear as calling a
getChildElements method which returns an array of
said child elements. This is the case when obtaining
both the classes’ methods and the method invocations
within them.
The complexity in obtaining these two types of
structural elements arises due to the fact that, in both
cases, it is necessary to obtain information about them
from the AST to be used in conjunction with the infor-
mation from the Java Model.
3.2.3 Live Changes
One of the crucial features of the plug-in developed
for the statistical analysis is the ability to detect
changes to the source code in real time and reanalyz-
ing the changed elements.
The Eclipse JDT provides the mechanism to im-
plement an element change listener, which calls a pre-
defined function once there is a change to a Java el-
ement inside the Eclipse IDE. The callback function
will receive as an argument the ElementChangedE-
vent, from which we can obtain the IJavaElement-
Delta which contains information about which ele-
ment was changed.
As IJavaElementDelta informs us of which ele-
ment was changed, the representation of the project in
the plug-in does not have to be rebuilt from the start.
Processing time is thus saved by only analyzing the
affected elements, from the Project level to the Com-
pilation Unit level.
Despite the fact that it would be interesting to al-
low modifications to the Method level, Eclipse JDT
does not provide a notification of a change in an
IMethod element when the method body is changed,
only a ICompilationUnit level notification. The low-
est change listener implemented was therefore at the
Compilation Unit level.
When communicating the result of this partial
analysis to the repository, the JSON data sent is the
part of the aforementioned JSON structure relevant to
the element level analyzed. The request is then sent to
the endpoint corresponding to the respective element:
/projects, /packages or /i-classes.
Another important factor to guarantee consistency
is the analysis of the workspace when the IDE is
launched. This compensates for any changes that may
have been done to the source code from an external
tool, as well as establishing a mechanism to restore
the projects’ representations to a safe state if any in-
consistency issues occur during the detection of live
changes.
Live Software Development Environment for Java using Virtual Reality
41

It is also important to note that if there are any is-
sues with the analysis as a result of incorrect source
code (i.e. invoking inexistent functions), the model
will not be generated and the changes will not be
propagated.
3.3 Runtime Analysis
Alongside structural analysis, the analysis of the soft-
ware’s behavior upon execution is extremely impor-
tant for one to know how a piece of software func-
tions. However, analyzing runtime behavior elicits a
myriad of problems.
Depending on the amount of data the analyzing
tool extracts from the software at runtime, the data
throughput can be massive. Some measures have to
be taken in order to mitigate this issue.
Another concern for a runtime analyzer is that it
should be minimally invasive, that is, the logging con-
cerns should be as decoupled from the software to be
analyzed as possible. For the runtime analysis, we
built an AspectJ project which would weave the gen-
erated logging code into the target project with mini-
mal impact to it.
The main focus of this analyzer is method invoca-
tions. However, it could easily be extended to monitor
other events such as constructor calls, exception han-
dling, among others.
3.3.1 AspectJ
As mentioned earlier, one of the requirements for this
analyzer is the segregation of concerns in the source
code, that is, the source code of the original software
should not have to be modified in order for it to be an-
alyzed. This excludes the case of simply implement-
ing a logger as a class in the project and then calling
a log method whenever it is relevant, adapting it to
whichever context it is called from.
Luckily, AspectJ provides a way to achieve this,
by weaving advices into the original code. For the an-
alyzer code to be weaved into the project in question,
we need to choose the relevant join points, define the
pointcuts and the advices. These steps will now be
explained in further detail.
Join Points. The first concern is to choose the
relevant joint points. These are the points in a Java
project in which AspectJ allows us to introduce ad-
vice. Examples of join points are method calls,
method executions, constructor calls, field reference,
and exception handlers, among others. For our an-
alyzer, however, we chose to only focus on method
calls.
Pointcuts. Secondly, it is necessary to define
exactly what instances of the joint points will be
Figure 2: Screenshot of a code segment of the aspect which
monitors the execution.
weaved with the advice. As the goal is to build a
generic method call logger, the conjunction of point-
cuts will have to include calls for any method except
for calls which occur in the source code of the ana-
lyzer project.
The pointcuts used by the analyzer are the call
pointcut, which gathers all method calls, and the
within pointcut, to select all method calls from within
the classes of the runtime analyzer and avoid analyz-
ing them.
Given the fact that the analyzer is provided as an
AspectJ project, the user can add pointcuts to the ex-
isting advice. One possible application for this would
be to select method calls originating from a specific
class or package by using the within pointcut. Be-
sides allowing for a more targeted analysis, it would
help the communication process run more smoothly
since the amount of information being sent would be
reduced.
Advice. Finally, we need to define the aspect
advice. The advice specifies the code that will be
weaved into the original source code on the compi-
lation, at each pointcut.
An advice can be set to run before, after or be-
tween the joint point. As we want to have a notion of
the order of method calls, the advice will be weaved
before the method calls.
For the analysis of a method call, AspectJ pro-
vides a multitude of variables. In the specific case
of the runtime analyzer we use two of these vari-
ables: thisJoinPoint and thisEnclosingJoinPointStat-
icPart. Most of the data will be extracted from the
thisJoinPoint variable, while the thisEnclosingJoin-
PointStaticPart will only provide the name of the
class where the method call occurs. The data obtained
for each method call will be described in a more de-
tailed manner in section 3.3.2.
Two hashes are also generated, one from the name
of the class where which the method call (the origin
class) and the other from the name of the class where
the called method is declared (the destination class).
These hashes are generated in the same way as the
class hash generated by the static analyzer.
Figure 2 shows the partial definition of the aspect
ENASE 2019 - 14th International Conference on Evaluation of Novel Approaches to Software Engineering
42

used to monitor method calls (missing the rest of the
advice). The joinpoint corresponds to call, while the
rest of the pointcut specifies that the advice should
not be weaved into method calls of the execution an-
alyzer. Finally, the advice recovers information from
the method call and hands it over to the communica-
tion interface to send the method call to the repository.
Though an interface was not built for this, as the
analysis tool is implemented as an AspectJ project,
a developer could modify the aspect where the com-
ment ”insert other calls here” is done in Figure 2,
and add within pointcuts to specifically identify the
classes or packages where he wants the method calls
to be obtained. This reduces the toll on the repository
and allows the developer to focus specifically on the
method calls in a small set of classes.
After defining the aspect, upon compiling the
project, AspectJ instruments the resulting code by in-
serting the code defined in the advice in the points
specified by the advice.
3.3.2 Extracted Data
The main goal of this process is to extract the most
valuable information without compromising the di-
mension of each event, considering how there is a
massive amount of method calls in a normal piece of
software and that these events will have to be handled
by the repository.
The analyzer also obtains an array of the argu-
ments used in the method call and for each one stores
its type in a field called type and a whether it is null
or not in a field called value.
The first implementation stored the string repre-
sentation of the argument in the value field. How-
ever, it quickly became apparent that this was not a
good idea, as there were cases of long and cumber-
some string representations that increased the amount
of data which needed to be sent to the repository sig-
nificantly.
3.4 Communication
The communication component of this analyzer is of
utter importance given the large amount of data it
will transmit. The mechanisms used to avoid slow-
ing down the execution of the software in the analysis
will be discussed in this subsection, as well as the se-
quence of communications with the repository and the
structure of the messages.
3.4.1 Buffering and Asynchronous Requests
In order to reduce the impact of the analysis and the
latency with which events arrive at the repository,
and, by sequence, to the visualization engine, two
approaches are adopted: asynchronous requests and
buffering.
Asynchronous requests are the most simple im-
provement that can be implemented, especially taking
into account that we do not have to process any sort of
returning information from the repository. As we fa-
vor reduced latency over the guarantee that all events
are received, asynchronous requests to avoid stopping
the execution of the original software to send a re-
quest and await the server’s response. This reduces
the performance impact of the analyzer to the original
software significantly.
The second mechanism is buffering events, that is,
storing events in an array and sending a request with
all the stored events, clearing the array afterward, and
repeating this process at a fixed time interval. The
reasoning behind using buffering is to minimize the
impact of the inherent latency of communicating with
the server. Similarly to the reasoning behind sending
the whole project structure in a single request, it is
better to send one large request and allow the server
to process it than to send a large batch of smaller re-
quests.
Though buffering may affect the notion of live-
ness, it prevents unordered events and avoids, or
at least reduces the likelihood of overwhelming the
communication channel with massive amounts of
small requests.
3.5 Visualization Engine
The visualization engine seeks to combine the best
of both worlds, liveness and virtual reality. The vir-
tual environment is responsible for visualizing static
and dynamic content. To do this, the use of liveness
increases and improves the feedback of the software
that is transmitted to the user. The VR feature for vi-
sualizing the 3D content is indispensable due to the
desired immersion and also given the need for VR
device controllers to allow interaction. Figure 3 is a
static sample of the tool’s features.
3.5.1 City-based Metaphor
The city-based metaphor was selected to be used in
this project due to its common appearance among dif-
ferent literature about software visualization. Further,
this metaphor is easily recognized by a developer as it
is based on a city building, roads and other common
city blocks.
A mapping is performed where packages, classes,
and invocations information are converted into dis-
tricts, buildings, and connections. The whole envi-
ronment is built using blocks. The dimensions and
Live Software Development Environment for Java using Virtual Reality
43

Figure 3: Structure of the visualization using the engine tool
on JUnit project.
colors of the blocks are defined through metrics ob-
tained from the software.
Block allocation also follows a pre-defined rule.
The aim was to minimize the total space required for
the construction of the city, to maintain a rectangular
space and to instantiate the elements by dimension.
The tangibility created with the city metaphor al-
lows us to take a different stance on code understand-
ing.
3.5.2 Interaction Actions and Interface
Being a virtual live environment, the invocations that
occur would be imperceptible, since they happen in
milliseconds. In order to be able to view and analyze
the software, the engine generates the connections at
the moment it receives them. However, it adds 3 sec-
onds of duration so that the user has the necessary
time to understand what is happening. In addition,
the user still has in his possession other time control
factors in the environment menu.
Using the controllers and sensors of the VR de-
vices, the user is able to perform several actions.
Pause - Pause button blocks any changes in the en-
vironment, either with connections or with districts
and packages. This is the ideal time for the user to
make his analysis because he will have total tempo-
ral freedom. Start Live - After pausing, the user can
return to the live state. This means, back to the real-
time, ignoring everything that might have happened
at the time it was paused. Continue - After pausing,
the user can still continue to execute at the next point
to the one that was in the moment that paused the ex-
ecution. All events that the engine received and was
not viewed are cached and can thus be recovered. Go
Back 1 Second - In spite of the intentional delay cre-
ated in the changes that occur in the environment, it
is possible that the user loses some detail or simply
wants to go back in time. This functionality allows
exactly that, retreating a second. After it is activated,
it asks the server for the events that happened in the
last second and returns to show them.
Navigating the virtual world is achieved by phys-
ically moving the user or by using the teleport func-
tionality.
The user interaction with the virtual environment
is possible using only one monitor of a computer.
However, the visualization loses its immersiveness
and the interaction becomes impracticable due to the
non-existence of controllers. As a result, it is advised
to use VR devices with hand controllers and sensors,
such as HTC Vive or Oculus Rift.
4 EXPERIMENTS & RESULTS
In order to test and validate that the framework de-
veloped is working as originally intended, two Java
projects were used. These projects are both developed
in Java and were chosen as they provide a different
set off differing characteristics, namely the structural
complexity.
The first, Maze project, was the first project de-
veloped in the context of a teaching course, thus it is
a small project which allows easier verification while
still having some degree of architectural complexity,
that is, it contains a reasonable number of each one of
the structural elements (packages, classes, etc.).
The second, JUnit, is a unit testing framework
widely used in Java projects. This software is com-
monly used in literature as a case study.
The goal of the experimental scenarios described
in this section is to analyze the performance of the
execution analyzer in conjunction with the software
repository.
In this set of experiments, only the Maze project
was used. The amount of data generated no longer
depends solely on structural complexity, but on the
processing capabilities of the machine, the program
is running on.
The proper functioning of the static and dynamic
analysis framework was paramount to the correct
functioning of the visualization environment and as
such, this visualization environment’s validation can
be correlated with the frameworks validation.
In order to validate the effectiveness of a live vi-
sualization environment two possible issues (not nec-
essarily errors) were injected into the software, which
does not appear as issues in a regular IDE: an infinite
loop and an invocation with a number of null argu-
ments greater than zero.
As expected, the visualization represented this
two issues, preliminary validating the effectiveness
ENASE 2019 - 14th International Conference on Evaluation of Novel Approaches to Software Engineering
44
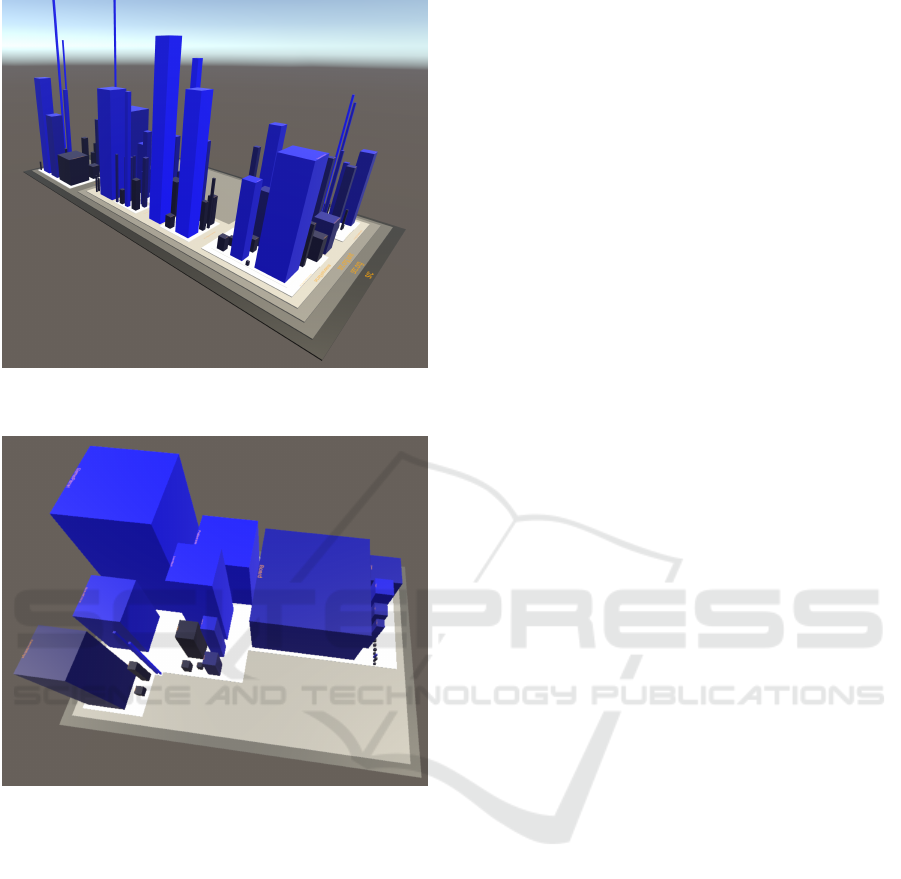
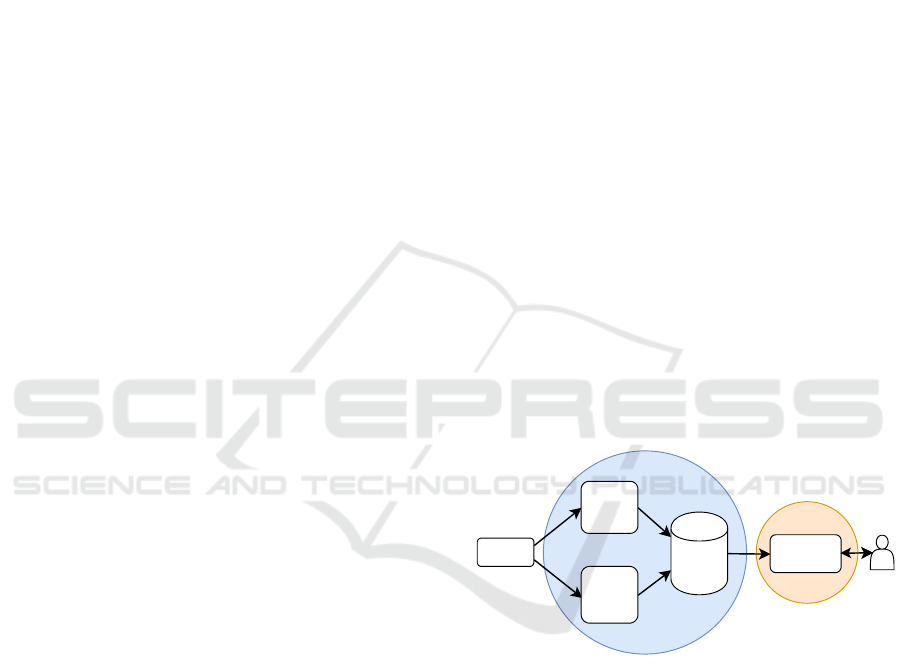
Figure 4: Result of using the VR visualization tool on JUnit,
giving a perspective of the structure of the software artifact.
Figure 5: Result of using the VR visualization tool on Maze
project, highlighting some events between structural ele-
ments of the software project.
static and dynamic analysis framework developed, as
well as the visualization component.
This, in turn, helps validate the usefulness of the
data that this framework extracts from the static repre-
sentation of software, as well as from its runtime be-
havior, and the manner in which the repository makes
this data available to external tools, such as this visu-
alization environment.
Figure 4 and Figure 5 shows the resulting visual-
ization from the VR environment developed. In Fig-
ure 4 we can see the structural representation of the
JUnit4 project while in Figure 5 we can see the Maze
project running.
5 CONCLUSIONS
This paper presents several contributions to the field
of software visualization, human-computer interac-
tion and novel contributions to bring liveness to soft-
ware development, pushing towards the research on
Live Software Development (Aguiar et al., 2019).
The main contributions of this paper include: (1)
a structural analysis tool for Java projects that can be
included in any JDT enabled Eclipse IDE as a plug-
in, capable of recognizing changes to several levels
of the Java Model tree; (2) an execution analysis tool
for Java projects that can be included in the relevant
workspace and added to a project with minimal modi-
fications to the concerning project required; (3) a soft-
ware repository ready to receive information from the
previously mentioned analysis tools, and provide it in
real-time to any external tools through an API.
Further, it includes a visual and spatial metaphors
with familiar 3D contexts and with care in the dis-
position of virtual objects to facilitate understanding,
a VR application that allows to create enriched ex-
periences, such as interaction with objects or spatial
movement in the generated virtual environment.
Finally, as future improvements, we consider the
addition of spatial and temporal interactions with a
live software system through a VR platform. Also,
communication between the repository and the virtual
environment engine sends all the static and dynamic
information of the software system is performed uni-
directionally, from the server to the engine. A two-
way communication would be an improvement to the
current approach, where modifications in the virtual
environment will be passed to the running system.
The experiments carried on were made to evaluate the
sanity and viability of the approach. We consider that
in the future several controlled experiments must be
done to assert the usefulness of this work.
ACKNOWLEDGEMENTS
This work is financed by the ERDF – European Re-
gional Development Fund through the Operational
Programme for Competitiveness and Internationali-
sation - COMPETE 2020 Programme within project
”POCI-01-0145-FEDER-006961”, and by National
Funds through the Portuguese funding agency, FCT
- Fundac¸
˜
ao para a Ci
ˆ
encia e a Tecnologia as part of
project ”UID/EEA/50014/2013”.
Live Software Development Environment for Java using Virtual Reality
45

REFERENCES
Aguiar, A., Restivo, A., Figueiredo Correia, F., Ferreira,
H. S., and Dias, J. P. (2019). Live software devel-
opment: Tightening the feedback loops. In Confer-
ence Companion of the 3rd International Conference
on Art, Science, and Engineering of Programming,
Programming 2019 Companion. To Appear.
Bartoszuk, C., Timoszuk, G., Dabrowski, R., and Stencel,
K. (2013). Magnify - a new tool for software visual-
ization. In 2013 Federated Conference on Computer
Science and Information Systems, pages 1485–1488.
Bassil, S. and Keller, R. K. (2001). Software visualization
tools: Survey and analysis. In Proceedings of the 9th
International Workshop on Program Comprehension,
IWPC 01, pages 7–17, Washington, DC, USA. IEEE
Computer Society.
Baxter, I. D., Yahin, A., Moura, L., Sant’Anna, M., and
Bier, L. (1998). Clone detection using abstract syntax
trees. In Proceedings. International Conference on
Software Maintenance (Cat. No. 98CB36272), pages
368–377.
De Pauw, W., Jensen, E., Mitchell, N., Sevitsky, G., Vlis-
sides, J., and Yang, J. (2002). Visualizing the exe-
cution of java programs. In Diehl, S., editor, Soft-
ware Visualization, pages 151–162, Berlin, Heidel-
berg. Springer Berlin Heidelberg.
Fauzi, E., Hendradjaya, B., and Sunindyo, W. D. (2016).
Reverse engineering of source code to sequence di-
agram using abstract syntax tree. In 2016 Interna-
tional Conference on Data and Software Engineering
(ICoDSE), pages 1–6.
Feijs, L., Krikhaar, R., and Ommering, R. V. (1998). A rela-
tional approach to support software architecture anal-
ysis. Software: Practice and Experience, 28(4):371–
400.
Gosain, A. and Sharma, G. (2015). A survey of dynamic
program analysis techniques and tools. In Satapa-
thy, S. C., Biswal, B. N., Udgata, S. K., and Mandal,
J., editors, Proceedings of the 3rd International Con-
ference on Frontiers of Intelligent Computing: The-
ory and Applications (FICTA) 2014, pages 113–122,
Cham. Springer International Publishing.
Gu
´
eh
´
eneuc, Y.-G. (2004). A reverse engineering tool for
precise class diagrams. In Proceedings of the 2004
Conference of the Centre for Advanced Studies on
Collaborative Research, CASCON ’04, pages 28–41.
IBM Press.
Jones, J. (2003). Abstract syntax tree implementation id-
ioms. In Proceedings of the 10th Conference on Pat-
tern Languages of Programs (PLoP2003).
Koschke, R. (2003). Software visualization in software
maintenance, reverse engineering, and re-engineering:
a research survey. Journal of Software Maintenance
and Evolution: Research and Practice, 15(2):87–109.
Lanza, M. and Ducasse, S. (2003). Polymetric views-a
lightweight visual approach to reverse engineering.
IEEE Trans. Softw. Eng., 29(9):782–795.
McDirmid, S. (2013). Usable live programming. In Pro-
ceedings of the 2013 ACM international symposium
on New ideas, new paradigms, and reflections on pro-
gramming & software - Onward! ’13, pages 53–62,
New York, New York, USA. ACM Press.
Merino, L., Ghafari, M., Anslow, C., and Nierstrasz, O.
(2017). Cityvr: Gameful software visualization.
In 2017 IEEE International Conference on Software
Maintenance and Evolution (ICSME), pages 633–637.
Rumbaugh, J., Jacobson, I., and Booch, G. (2004). Uni-
fied Modeling Language Reference Manual, The (2Nd
Edition). Pearson Higher Education.
Sadar, A. and J, V. P. (2015). Doctool - a tool for vi-
sualizing software projects using graph database. In
2015 Eighth International Conference on Contempo-
rary Computing (IC3), pages 439–442.
Shi, N. and Olsson, R. A. (2006). Reverse engineering of
design patterns from java source code. In Proceed-
ings of the 21st IEEE/ACM International Conference
on Automated Software Engineering, ASE ’06, pages
123–134, Washington, DC, USA. IEEE Computer So-
ciety.
Singh, N. and Singh, S. (2017). Virtual reality: A brief
survey. In 2017 International Conference on Infor-
mation Communication and Embedded Systems (ICI-
CES), pages 1–6.
Tanimoto, S. L. (2013). A perspective on the evolution of
live programming. In Proceedings of the 1st Inter-
national Workshop on Live Programming, LIVE ’13,
pages 31–34, Piscataway, NJ, USA. IEEE Press.
Teyseyre, A. R. and Campo, M. R. (2009). An overview
of 3d software visualization. IEEE Transactions on
Visualization and Computer Graphics, 15(1):87–105.
Vincur, J., Navrat, P., and Polasek, I. (2017). Vr city: Soft-
ware analysis in virtual reality environment. In 2017
IEEE International Conference on Software Quality,
Reliability and Security Companion (QRS-C), pages
509–516.
Wettel, R., Lanza, M., and Robbes, R. (2011). Software sys-
tems as cities: A controlled experiment. In Proceed-
ings of the 33rd International Conference on Software
Engineering, ICSE ’11, pages 551–560, New York,
NY, USA. ACM.
Yuan, D., Park, S., and Zhou, Y. (2012). Characterizing
logging practices in open-source software. In 2012
34th International Conference on Software Engineer-
ing (ICSE), pages 102–112.
ENASE 2019 - 14th International Conference on Evaluation of Novel Approaches to Software Engineering
46
