
Differences in Driver Behaviour between Race and Experienced Drivers:
A Driving Simulator Study
Naman Singh Negi
1
, Peter Van Leeuwen
2
and Riender Happee
2
1
Telecom Paris-Tech, Paris, France
2
Delft University of Technology (TU Delft), Delft, The Netherlands
Keywords:
Driver Behaviour, Race Drivers, Experienced Drivers, Simulator, Steering, Braking, Path Strategy.
Abstract:
Safety is one of the major areas of concerns today in the field of automotive development. Different safety
measures have and are being introduced in order to improve driver/passenger and pedestrian safety. Advanced
driver assist systems (ADAS) are therefore becoming increasingly important in their role of reducing driver
crash risk. A shortcoming of the ADAS systems is that the variability in drivers based on skill and experience
is not taken into account and the system is often designed for average or worst case driver performance thereby
compromising on the dynamic behaviour of the vehicle. This study focuses on understanding and quantifying
the differences in drivers. This knowledge of driver differences can be helpful in designing an adaptive ADAS
by introducing the driver into the control loop.
The study investigates differences between race-car drivers and normal (experienced) drivers in a high-speed
driving task. The study analyses simulator data for 17 drivers on the Mallory Park test circuit. The driving
task required the participants to drive around the circuit to achieve the fastest lap times. Analysis showed that
higher steering activity and differences in path strategy were the main reasons for lower lap-times shown by
the expert race drivers compared to the non-expert drivers. Steering metrics like average steering rate, steering
jerk showed higher values for the expert group and distance traveled around the corner showed a different
path strategy adopted by the experts. Both groups showed improvement in performance based on lap-times
across the different sessions. Thus the study shows that expert and non-expert drivers have different steering
behaviour and path strategy, which can be attributed to differences in driving experience, vehicle dynamics
knowledge and vehicle control skills.
1 INTRODUCTION
Through the years of automotive development safety
has been one of the primary areas of concern. In-
appropriate driver behaviour and insufficient skill
are considered the primary cause of road accidents.
(Brookhuis and Smiley, 1987) stated that more than
85% of total accidents could be directly attributed
to the driver (59% driver error and 26% driver im-
pairment due to alcohol or drug consumption, fatigue
etc.). Over the years there have been many regulatory
and technological advances designed to help reduce
the risk of accidents. (Fildes and Lee, 1994) reviewed
several studies and reported a reduction of 8-40% in
road accidents in Belgium, Finland, France, Germany,
UK and South Africa due to reduced speed limits.
Advanced driver assist systems (ADAS) are also
becoming increasingly important in their role of re-
ducing driver crash risk. Studies ((Weiner and Curry,
1980) and (NHTSA, 2009)) have shown that these
systems are beneficial in improving the safety of the
driver and the passengers, but at the same time they
can also make the drivers complacent and relaxed
thereby increasing the probability of a dangerous situ-
ation. Moreover, these regulatory and technical mea-
sures are not driver specific and often the average
driver performance is used as the benchmark. It can
be argued that the present safety measures are not
designed to address the variance in the skill level of
drivers. Knowledge of driver based differences in
control and behaviour can hence help improve the de-
velopment of ADAS.
Driver perception, knowledge and awareness, and
vehicle control skills affect the driving task compe-
tency. (Fuller, 2005) stated that the total driving com-
petency is based on initial driving skill and the knowl-
edge and vehicle control skills gained through expe-
rience. (Malik, 2011) defined driver competency as
the ability to use driving knowledge and skill for the
successful and safe completion of the driving task i.e.
360
Negi, N., Van Leeuwen, P. and Happee, R.
Differences in Driver Behaviour between Race and Exper ienced Drivers: A Driving Simulator Study.
DOI: 10.5220/0007700003600367
In Proceedings of the 5th International Conference on Vehicle Technology and Intelligent Transport Systems (VEHITS 2019), pages 360-367
ISBN: 978-989-758-374-2
Copyright
c
2019 by SCITEPRESS – Science and Technology Publications, Lda. All rights reserved

proper and timely perception followed by appropriate
action. Previous research has shown differences in
control strategy for expert drivers compared to non-
experts (Katzourakis et al., 2011) on a circular drive
task. Further differences in steering control in a simu-
lated environment were found by (Zhang et al., 2008),
who showed differences in the frequency spectrum
between expert and non-expert drivers during differ-
ent lane change maneuvers. The difference in com-
petency level between experts and non-expert drivers
leads to differences in behaviour and performance.
This research is an extension of previous research
done to classify drivers into groups of non-expert, ex-
perienced and experts. The research aims at objec-
tively estimating the skill level of the drivers using a
predefined task. The present study focuses on analyz-
ing the differences between race drivers (experts) and
normal (experienced) drivers in a high-speed driving
task. An experienced driver is one who has a certain
level of expertise gained through driving experience,
while expert drivers are categorized by high level of
driving proficiency (e.g. race car drivers, instructors
in driving schools). The task required the partici-
pants to select the optimal speed and race line, and
provide accurate and consistent control inputs while
going around the corners in order to achieve minimal
lap-time. The study focuses on the steering behaviour
and the path strategy and consistency of both groups
of drivers using a driving simulator test dataset.
2 METHODS
2.1 Apparatus
The experiment was conducted in a race-car simulator
based on the chassis of a Formula Renault 2.0 racing
car used for training purposes (Sim-Delft, 2013). The
steering wheel, brake and throttle pedal were used
from the original car and a direct drive motor pro-
vided force feedback. The throttle and brake pedal
feedback was passive and calibrated to resemble a re-
alistic formula car. The visual system consisted of
three 52-inch LCD screens and provided a 130 de-
gree horizontal and 27 degrees vertical field of view.
The simulator was equipped with a steering wheel
mounted dashboard showing speed, engine rpm, lap
and lap sector times. The virtual environment, vehicle
dynamics and force feedback were simulated by rFac-
tor software (v1.255). The rTrainer vehicle model, a
rear wheel driven formula style racecar (115 bhp, 573
kg), was used (Figure 1). All driving aids were dis-
abled and gear shifting was automated. All driving
simulator data was recorded and stored at 100Hz.
Figure 1: RTrainer Car.
2.2 Experiment Instructions
Participants were instructed to drive the fastest lap-
time possible on an unfamiliar racetrack. The Mal-
lory Park circuit was chosen for the experiment. Fig-
ure 2 below shows the outline of the circuit, con-
sisting of: 1) a long right hand corner known as the
Gerard’s bend, which turns through nearly 200 de-
grees, 2) a 180 degrees hairpin corner know as the
Shaw’s Hairpin, and 3) a combination of two fast cor-
ners. The participants drove four sessions of 10 min-
utes and between sessions had a five-minute break.
Participants received instructions prior to the start of
the experiment about the application of the throttle
and gas pedal and explanations regarding the infor-
mation available on the steering wheel mounted dash-
board. Participants were required to steer, accelerate
and brake (gear shifting was automatic).
Figure 2: Mallory Park Test Circuit.
2.3 Participants
Seventeen drivers (all male), aged from 17 to 26 years
(mean = 20.8, SD = 2.0) participated in the study. The
non-expert group consisted of 10 drivers, students at
the Delft University of Technology having no experi-
ence in racing with an average age of 21.6 years (SD =
1.8). The expert group had 7 drivers, professional rac-
ing drivers from various (international) racing classes
(e.g. Formula 3, GP2 and Porsche Supercup) with an
average age of 19.9 years (SD = 2.0).
2.4 Dependant Measures
To analyze the performance of the participants three
curves were selected on the test circuit:
Differences in Driver Behaviour between Race and Experienced Drivers: A Driving Simulator Study
361
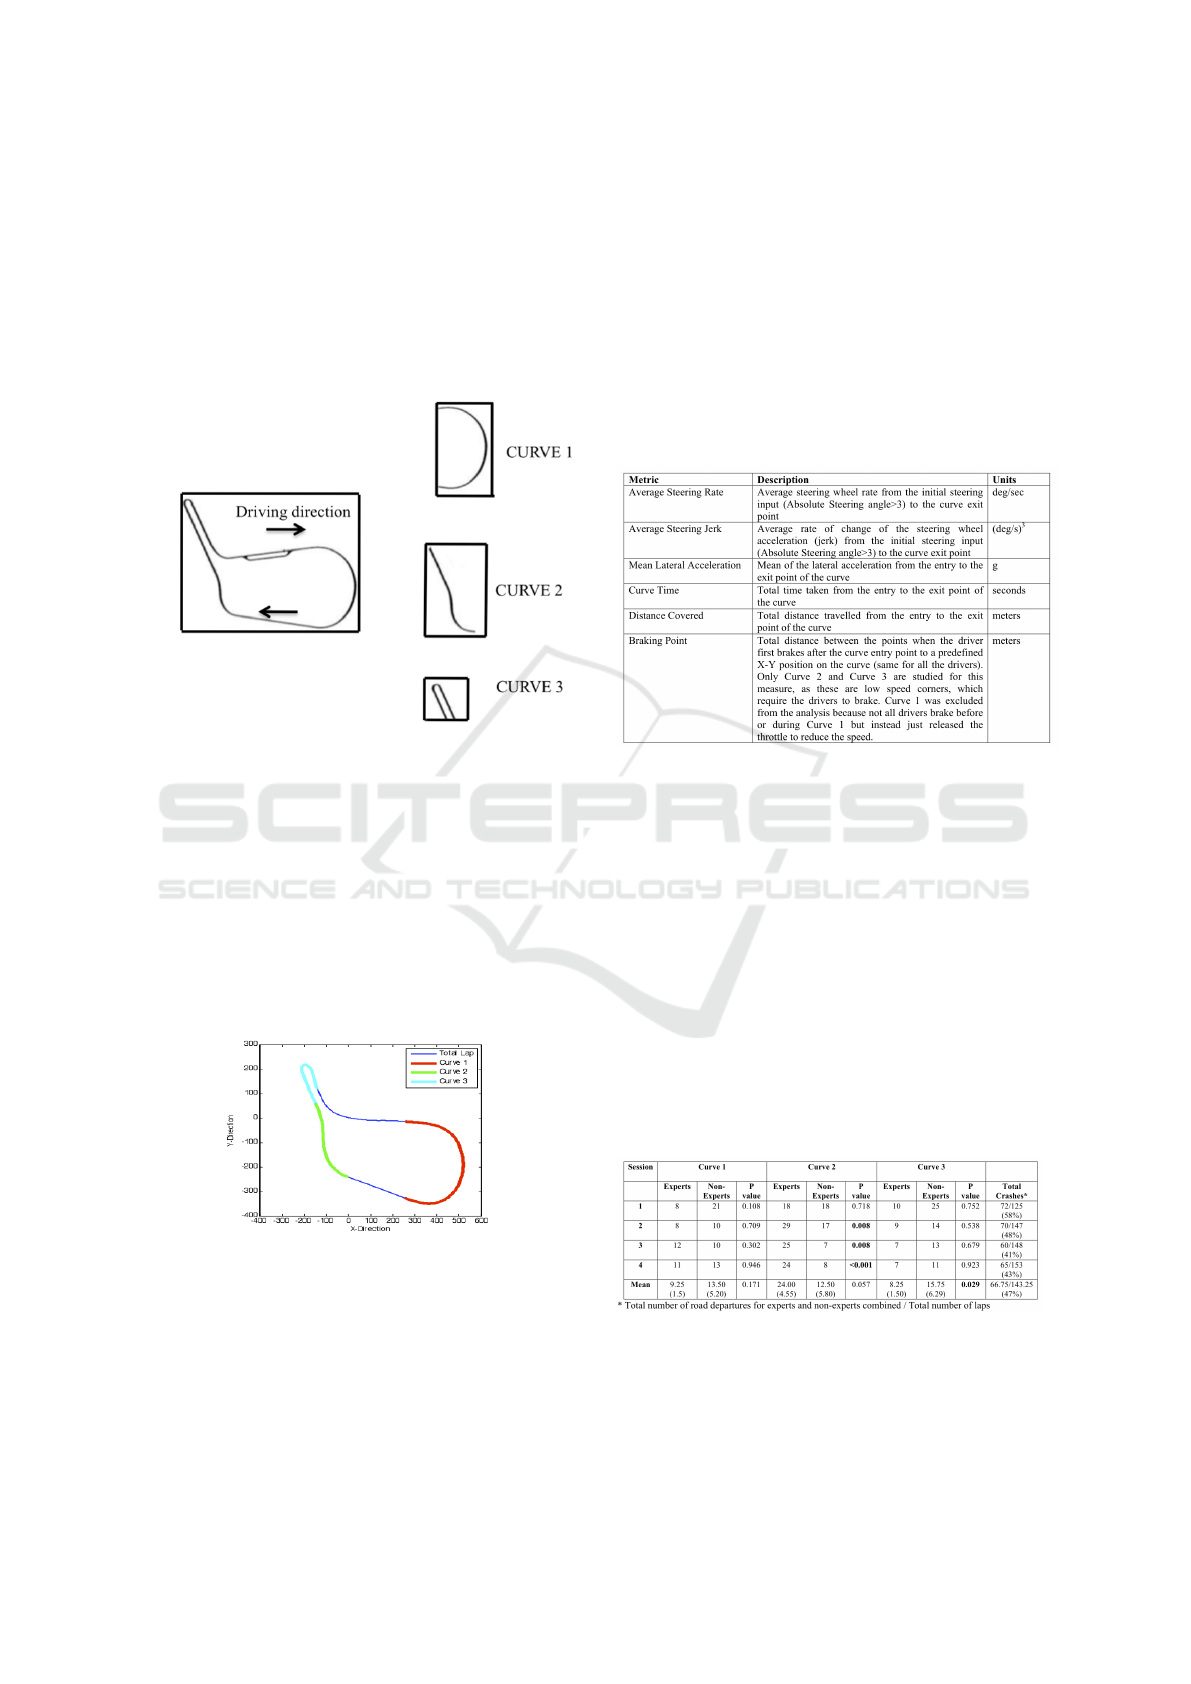
1. 1) Long right hand curve, which turns through
nearly 200 degrees
2. 2) Combination of two fast curves
3. 3) 180 degrees hairpin curve
Figure 3 below shows the selected curve and each
curve was analyzed separately. Data analysis and the
results are shown below. Each session was analyzed
Figure 3: Track breakdown into different curves for analy-
sis.
separately per curve. The data for the three mentioned
curves was selected for every lap and analyzed. The
curve entry and exit point was determined by the X-
Y position of the vehicle, ensuring that it was situ-
ated before the point where drivers start giving any
vehicle control inputs (steering, brake, or throttle) re-
lating to the entry of the corner. Similarly, in deter-
mining the exit point it was verified that the vehicle
was in straight-line steady state condition (Figure 4)
The steering data was filtered using a low pass Butter-
Figure 4: X-Y position of the selected curves for analysis.
worth filter (2nd order, 3Hz). All the other data was
filtered using a Butterworth 2nd order 10Hz low pass
filter. The first part of the analysis was to remove road
departures from the data. The cases in which all the
four wheels left the track were considered as "road
departure". This was done separately for all the three
curves and laps with road departures were excluded
from the performance analysis. They were studied
separately to understand the crash behaviour of the
two groups, but have not been included in this study.
The performance of the drivers was analyzed using
different dependant measures discussed in Table 1 be-
low. As the data was found to be non-normal (us-
ing q-q plots), differences between the experts and
the non-experts were assessed using the Wilcoxon-
Mann-Whitney test, which is better at dealing with
non-normal distributions than the t-test.
Table 1: Dependant Measures.
3 RESULTS
3.1 Road Departures
Experts showed a higher percentage of road depar-
tures compared to non-expert drivers in Curve2, ses-
sion 2-4. A significant improvement in the num-
ber of road departures over sessions can be seen for
the non-expert drivers in all curves (p=0.031), while
the experts remain at a constant level of road depar-
tures (p=0.343). Table 2 below shows the number of
laps with road departures for every session and both
groups.
Table 2: Number of Road Departures.
3.2 Curve Times
Experts show lower lap-times and curve times com-
pared to the non-experts. Experts are faster than non-
experts on average across all the sessions by a margin
VEHITS 2019 - 5th International Conference on Vehicle Technology and Intelligent Transport Systems
362
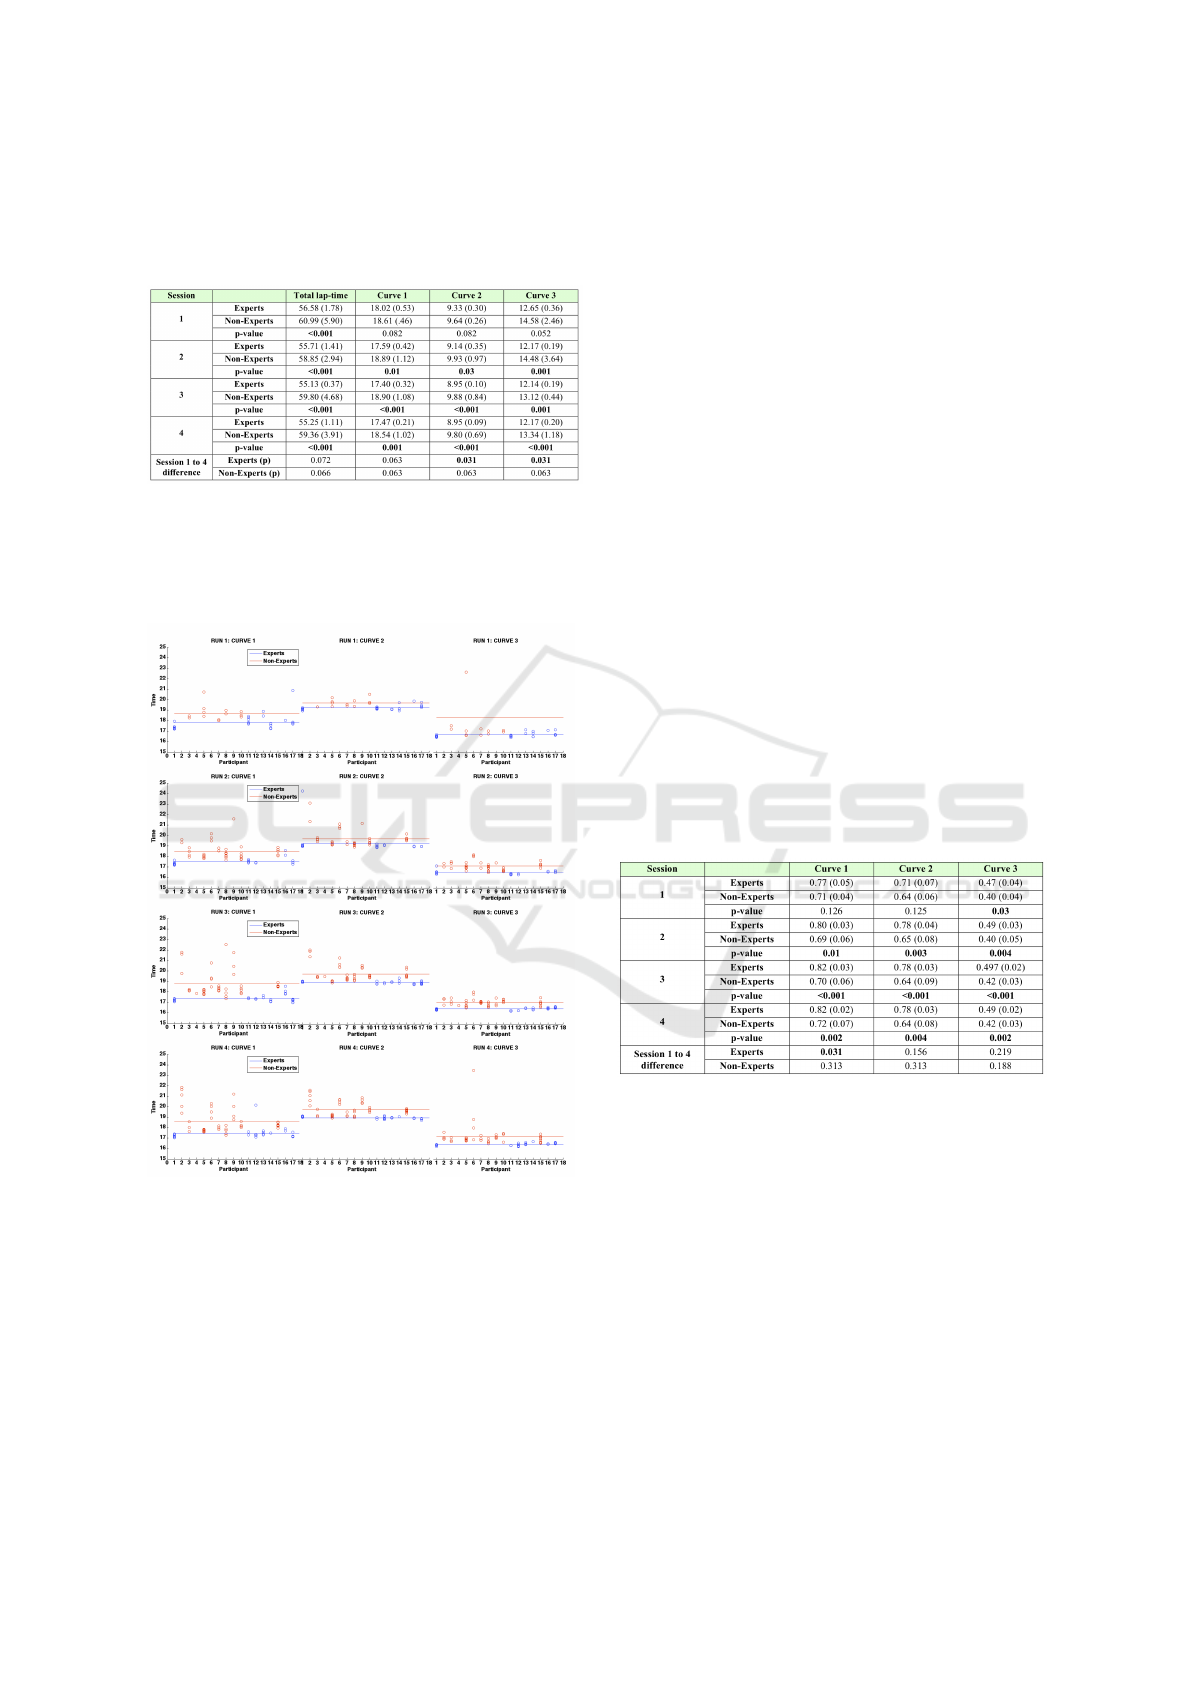
of 0.8-1.5 seconds in curve 1, 0.4-0.9 seconds in curve
2 and 1.0- 2.3 seconds in curve 3.
Table 3: Average curve-times for all session and all curves.
Both the groups show near significant improvement
in lap times from session 1 to 4. The two groups per-
form significantly differently in terms of curve times
from Session-2 to Session-4, as can be seen from the
p-values indicated in the table below.
Figure 5: Comparison of curve times for the three curves
from session 1 (top) to 4 (bottom) (blue and red lines rep-
resent the mean curve times for experts and non-experts re-
spectively). Each circle represents the curve time for one
lap during a curve section from the respective participant.
The overall difference in curve-times for all the
three curves between experts and non-expert drivers is
around 2.2 -4.6 seconds whereas the difference in lap-
times is between 3.2-4.7 seconds. This shows that the
experts maintained a higher speed in the straight road
segments also, which maybe because of the higher
corner exit speeds of the experts. Table 3 above does
not indicate the improvement in the average curve
times for curve 1 from session 1 to 4, which can be
seen in Figure 5. Similar differences are shown in
curve 2 and curve 3 also with experts having lower
curve times as compared to non-expert drivers. Both
the groups show improvement across the sessions.
Experts show significant improvement in curve-times
in curve 2 and curve 3 between session 1 and session
4. Experts show more consistency in the results as can
be seen from Figure 5.
3.3 Lateral Acceleration
Experts maintain higher levels of lateral acceleration
as they went around the curves during sessions 1 to
session 4 compared to the non-expert drivers. In curve
1 the expert drivers maintain 0.06-0.12 g higher lat-
eral acceleration, in curve 2 the difference is 0.07-
0.14 g and in curve 3 there is 0.07-0.09 g difference
as compared to the non-expert drivers. No significant
improvement was seen in the performance of the two
groups in terms of lateral acceleration from session 1
to session 4 for the non-experts whereas the experts
show significant increase in lateral acceleration for
curve 1 from session 1 to session 4. non-experts have
Table 4: Average Lateral Acceleration for all sessions and
all curves.
lower values of acceleration probably because their
primary goal is to successfully negotiate the curve
without any road departures, whereas experts try to
keep the vehicle at the limit to achieve the best perfor-
mance. Thus experts also have higher road departures
as compared to non-expert drivers (Table 2).
3.3.1 Steering Performance
Experts show higher steering activity compared to
non-expert drivers based on steering wheel rate and
steering jerk. Steering jerk values are different for the
two groups but only curve 1 (session1 and session 2)
and curve 2 (session 1, session 3 and session 4) show
significant differences (p< 0.05). Steering jerk val-
ues shown by the experts were approximately 1.5-2
Differences in Driver Behaviour between Race and Experienced Drivers: A Driving Simulator Study
363
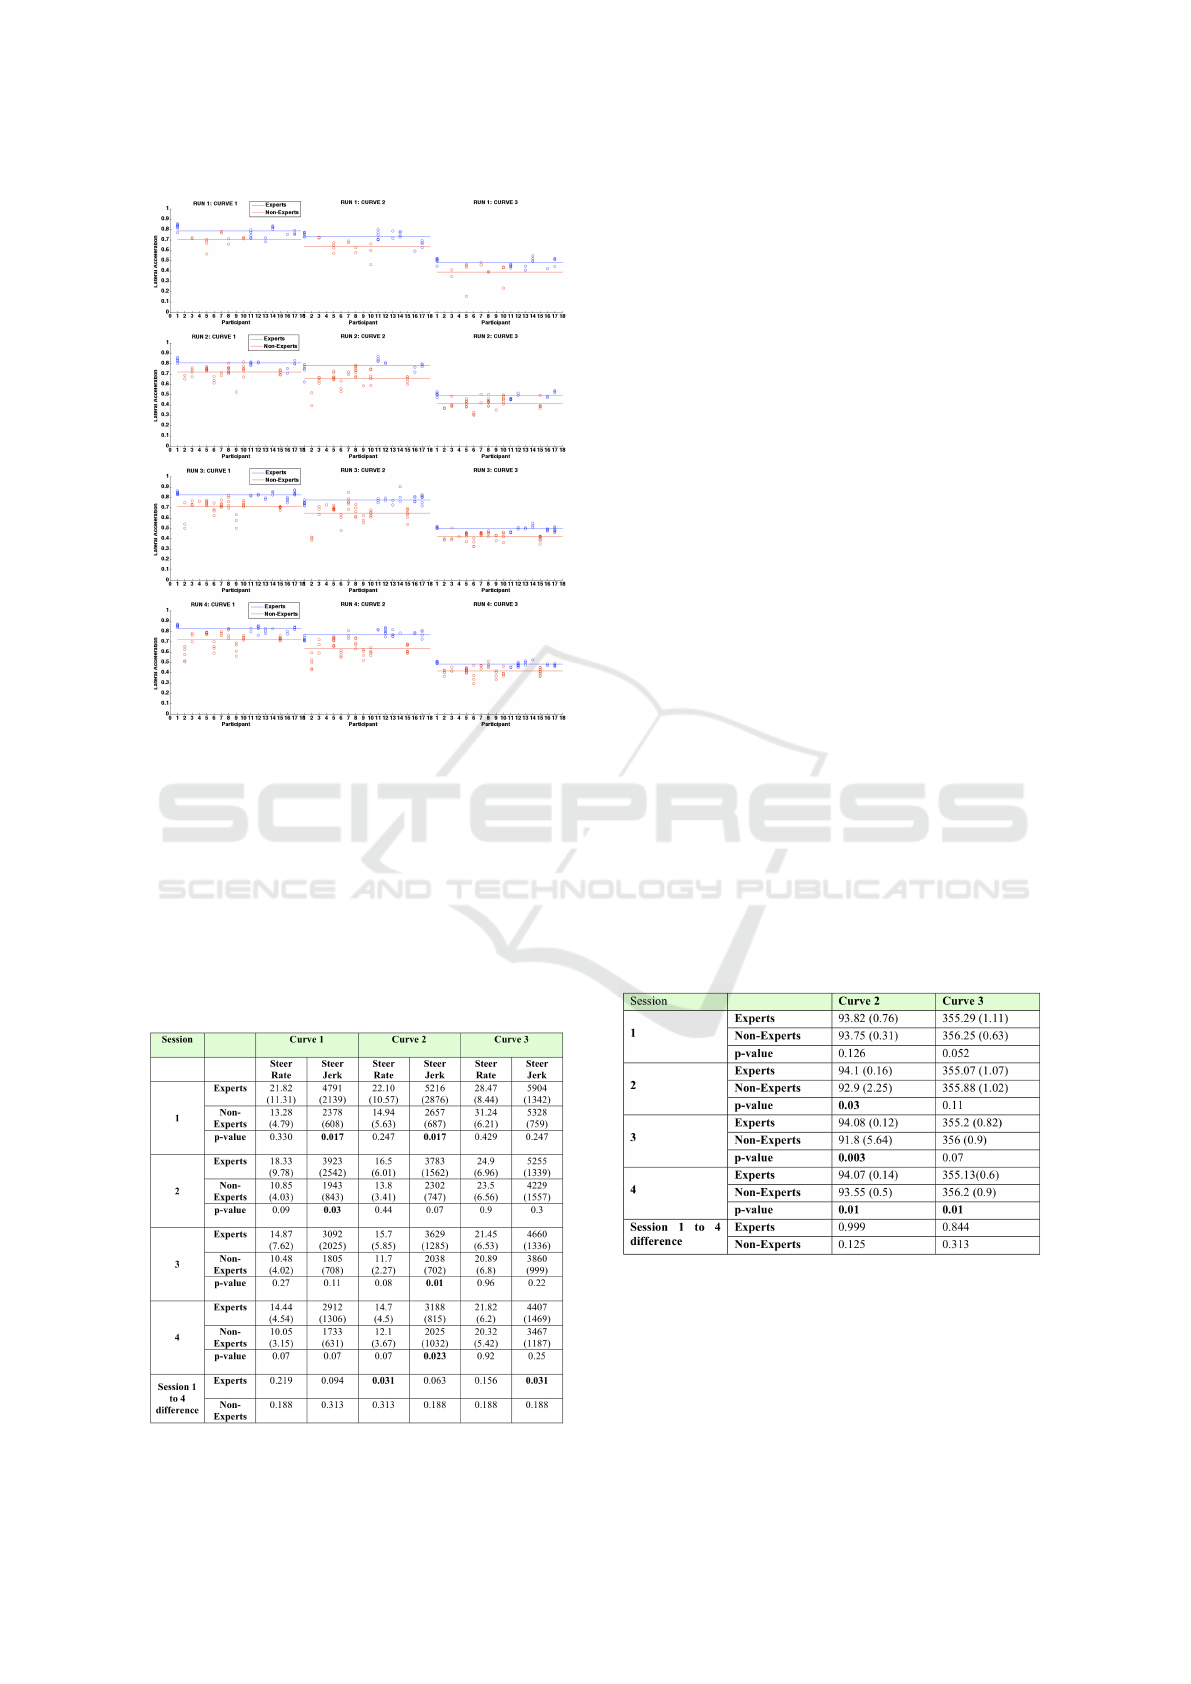
Figure 6: Comparison of average lateral acceleration (g) for
all the curves from session 1 to 4 (blue and red lines rep-
resent the mean curve times for experts and non-experts re-
spectively). Each circle represents the mean lateral acceler-
ation during a curve section from the respective participant.
times higher than the non-expert drivers for curve 1
and 2. Reduction in the average steering jerk values
can be seen for experts from session 1 to 4 for all the
curves but only curve 3 shows significant difference
(p<0.05).
Table 5: Steering metrics for all sessions and all curves.
non-expert drivers also show reduction in steer-
ing jerk values but it was not statistically significant.
Data also shows high standard deviation among the
experts. non-expert drivers have lower values but also
show smaller deviations in the group, see Table 5
for an overview of the data. Average steering rate
is also higher for the expert group compared to the
non-expert drivers but it is not significantly different.
There is a reduction in average steering rate values
for the non-expert drivers from session 1 to 4 but it
is not statistically significant. Experts also show re-
duction but only curve 2 shows significant difference
(p<0.05).
3.4 Path Strategy
3.4.1 Braking Point
Lower values of standard deviation, especially in
Curve 2, show that experts find a suitable braking
point and follow it consistently. As can be seen from
Table 6, the experts brake approximately 94 meters
before the curve 2 entry point during all the 4 ses-
sions. On the other hand the non-expert drivers brake
later and show variation in the braking point through
the different sessions. non-expert drivers also have a
higher standard deviation within a session compared
to the experts. The braking point in Curve 3 is later
for the experts, and reaches significance in the last
session. No significant difference was seen in experts
or the non-expert drivers from session 1 to 4 (p>0.05).
Table 6: Braking point for all sessions and curves 2&3 (in
curve 1 braking was not always observed).
3.4.2 Path Strategy
In figures 7 to 9 the path taken by experts and non-
expert drivers is shown for all curves in session 4.
Differences in path strategy between the two groups
can be seen from the graphs. In curve 1, as can be
seen from Figure 7, non-expert drivers try to keep the
VEHITS 2019 - 5th International Conference on Vehicle Technology and Intelligent Transport Systems
364
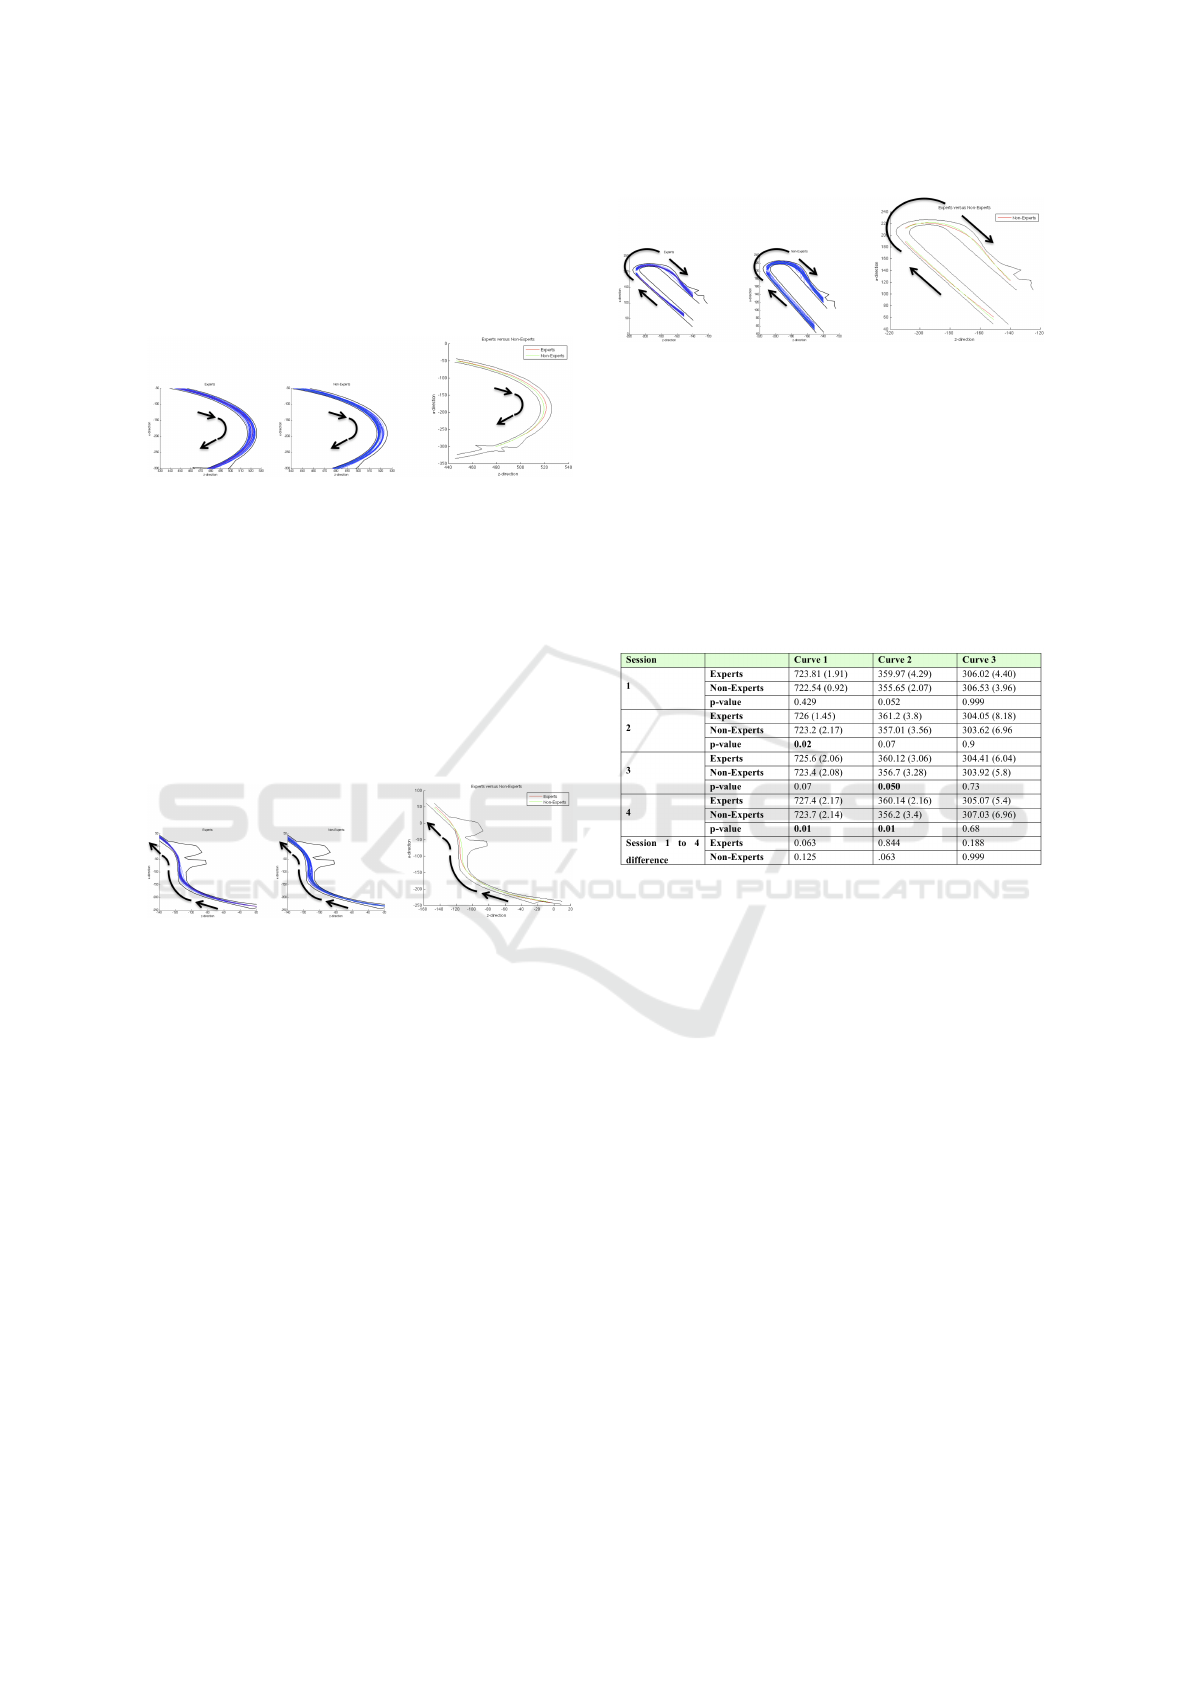
vehicle close to the inside of the track at all times.
Experts on the other hand first go towards the out-
side of the curve and then give a sharp steering input
to exit from the curve. As a result, they maintain a
larger distance from the inside of the curve as com-
pared to the non-expert drivers. In curve 2, as seen
Figure 7: Session 4-Curve 1: Path Followed: Blue lines
indicate the individual paths for the experts (right) and non-
expert drivers (center) in session 4, whereas red line (for
experts) and green line (for non-expert drivers) indicates the
mean path of all the laps. Thin black lines indicate the lane
boundaries of the track and the arrows indicate the direction
of travel.
from Figure 8, non-expert drivers give a higher initial
steering input to keep the vehicle closer to the inside
of the track. Experts, on the other hand, have smaller
steering inputs and keep the vehicle closer to the out-
side of the track while exiting the corner, compared to
non-expert drivers. In Curve 3 as seen from Figure 9,
Figure 8: Session 4-Curve 2: Path Followed: Blue lines
indicate the individual paths for the experts (right) and non-
expert drivers (center) in session 4, whereas red line (for
experts) and green line (for non-expert drivers) indicates the
mean path of all the laps. Thin black lines indicate the lane
boundaries of the track and the arrows indicate the direction
of travel.
the non-experts try to remain close to the inside of the
curve while entering and try to maintain a constant
distance from the inside of the corner. The experts
on the other hand, drive away from the inside of the
curve while entering and remain close to the inside
of the curve while exiting. Difference in path strat-
egy is also represented in the distance travelled by the
two groups while negotiating the corner (Table 7). As
can be seen from Table 7, experts take a longer path
in curve 1 (significantly different for Session 2 and
Session 4 with p<0.05) which is because they main-
tain a higher distance from the inside of the curve (see
Figure 7) as compared to non-expert drivers. Similar
pattern is seen in curve 2 (significantly different for
Session 3 and Session 4 with p<0.05) where the ex-
perts keep the vehicle towards the outside of the curve
Figure 9: Session 4-Curve 3: Path Followed: Blue lines
indicate the individual paths for the experts (right) and non-
expert drivers (center) in session 4, whereas red line (for
experts) and green line (for non-expert drivers) indicates the
mean path of all the laps. Thin black lines indicate the lane
boundaries of the track and the arrows indicate the direction
of travel the track.
while exiting (see figure 8). Curve 3 does not show
any significant difference in terms of distance trav-
elled. There is no significant difference for distance
travelled from session 1 to 4 for both the groups.
Table 7: Distance traveled for all sessions and all curves.
4 CONCLUSION
In this study differences between expert race-car
drivers and non-expert drivers were investigated. As
seen from the data presented in this study, experts
show better performance in terms of lap-times and
higher tire utilization as compared to the non-expert
drivers. Higher lateral acceleration shown by the
expert drivers means that they had a higher speed
throughout and exiting the corner. This enabled them
to maintain a higher straight-line speed, resulting in
faster lap-times achieved by the experts as compared
to the non-expert drivers. non-expert drivers had more
road departures in the first session, which could be
because they were not familiar with the simulator and
took some time to adjust to driving in the simulator
environment, and getting accustomed to the racing
task and the race-track. In sessions 2 to 4 experts
had higher percentage of road departures as com-
pared to the non-experts, which is possibly because
experts took more risk trying to keep the vehicle on
the limit to achieve best performance as can be seen
from the lower lap-times and higher tire utilization
Differences in Driver Behaviour between Race and Experienced Drivers: A Driving Simulator Study
365

values, compared to the non-expert drivers. Proba-
bly, the primary goal of the non-expert drivers was to
successfully negotiate the curve without any road de-
partures, sacrificing some curve time performance.
The results show differences in steering behaviour
between the two groups. Expert drivers show higher
steering activity in terms of steering rate and steering
jerk. These results are consistent with previous re-
search which showed higher steering activity among
expert drivers in terms of steering wheel angle, av-
erage steering jerk and frequency of steering inputs
((Hollopeter, 2011); (Zhang et al., 2008)). Driving
is a combination of open and closed loop processes.
Precise timing and accurate control inputs can enable
the driver to negotiate the race task in a largely open
loop state. While entering a corner a driver anticipates
the speed and steering angle that should be used, rep-
resenting the feed-forward part of the control loop.
But deviation from the desired path (vehicle position-
ing on the track) due to imprecise control inputs, lag
in the system or changing vehicle and environment
conditions, requires additional control inputs to cor-
rect for the deviations from the desired path. This rep-
resents the feedback control of the drivers. Possible
best performance can be achieved with a combination
of feed-forward and feedback control. Therefore, the
higher steering activity shown by the experts might be
attributed to higher feed-forward and feedback gain
as compared to the non-expert drivers. Lower steer-
ing activity shown by the non-expert drivers might
be correlated to lower feed-forward gain, which re-
sulted in poor vehicle positioning while entering the
corner, and lower feedback gain, which resulted in in-
sufficient correction in vehicle path while taking the
corner. Thus higher steering activity shown by the
experts can possibly be attributed to optimizing the
desired path. Another possible explanation for higher
steering activity especially in the racing task can be
that the experts are not only optimizing the path fol-
lowed but are also trying to keep the vehicle at the
traction limit and hence providing continuous steer-
ing corrections to stabilize the vehicle. Overall this
is evidence that experts have a better developed inter-
nal vehicle model, which enables them to understand
what the current situation demands, what should be
the control inputs, and also how the vehicle will re-
spond to the given control inputs. The promptness in
steering action and the ability to provide faster inputs
could be the result of practice. non-expert drivers on
the other hand might not be capable of giving such
fast inputs, lacking motor control skills, or maybe
they do not dare to give faster inputs, as they do
not know how the vehicle might respond, which is
evidence of inferior vehicle dynamics and response
knowledge. This is consistent with the definition of
competency ((Fuller, 2005)), which states that com-
petency is a combination of initial personal biolog-
ical characteristics and knowledge and skill gained
through training and experience.
We also see a difference in strategy between the
two groups in terms of braking point and the path cho-
sen to negotiate the corner. The non-expert drivers
show inconsistency in the braking point. This can be
evidence that the non-experts are inaccurate in per-
ceiving the curvature of the corner and hence are un-
able to judge the correct timing and magnitude of con-
trol action. While cornering, non-expert drivers try to
maintain a constant distance from the inside of the
corner whereas the experts tried to follow the rac-
ing lane, keeping towards the outside of the corner
while entering and exiting and going close to the in-
side of the corner in the mid-section. The different
path strategies of the two groups is similar to the one
found by (Treffner et al., 2002).
In summary, it can be concluded that experts who
had greater experience in the racing environment per-
formed better than the non-expert drivers in terms of
lower lap-times. Higher steering activity, different
braking and path following strategy and consistency
in following the chosen strategy significantly differ-
entiated the two groups. The data also showed that
lap-time, steering jerk and distance travelled metrics
could be used to differentiate between expert and non-
expert drivers. Steering jerk metric showed the largest
difference between the two groups with experts ap-
proximately 1.5-2 times higher than the non-expert
drivers for curve 1 and 2.
REFERENCES
Brookhuis, K. and Smiley, A. (1987). Alcohol, drugs
and traffic safety. Road users and traffic safety. J.A.
Rothengatter & R.A. de Bruin (Eds.), Assen: Van Gor-
cum, 83-105.
Fildes, B. and Lee, S. (1994). The Speed Review: Road En-
vironment, Behavior, Speed Limits, Enforcement and
Crashes. Report No. CR 127, Federal Office of Road
Safety, Canberra, Australia.
Fuller, R. (2005). Towards a general theory of driver behav-
ior. Accident Analysis and Prevention, 37 461-472.
Hollopeter, J. (2011). Response of novice and experienced
drivers to lateral control intervention to prevent lane
departures. Master’s thesis, University of Iowa. Re-
trieved from http://ir.uiowa.edu/etd/984.
Katzourakis, D., Velenis, E., and Happee, R. (2011). Driver
control actions in high-speed circular driving. Pro-
ceedings of the Sixth International Driving Sympo-
sium on Human Factors in Driver Assessment, Train-
ing and Vehicle Design.
VEHITS 2019 - 5th International Conference on Vehicle Technology and Intelligent Transport Systems
366

Malik, H. (2011). An assessment system for evalua-
tion of driving competencies. PhD thesis, Queens-
land University of Technology. Retrieved from http://
eprints.qut.edu.au/view/person/Malik,.Husnain.html.
NHTSA (2009). National Highway Traffic Safety Adminis-
tration 2009 Data: Overview - CrashStats. NHTSA.
Treffner, P., Barrett, R., and Peterson, A. (2002). Stabil-
ity and skill in driving. Human movement science,
21. Retreived from http://www.biomedsearch.com/
nih/Stability-skill-in- driving/12620719.html.
Weiner, E. and Curry, R. (1980). Fight-deck automation:
promises and problems. Ergonomics, 23(10), 995-
1011.
Zhang, Y., Lin, W., and Chin, Y. (2008). Driving skill char-
acterization: A feasibility study. IEEE International
Conference on Robotics and Automation.
Differences in Driver Behaviour between Race and Experienced Drivers: A Driving Simulator Study
367
