
A Systematic Approach to Choose the Data Warehouse Architecture
Antonello Venditti
a
and Fausto Fasano
b
Department of Bioscience and Territory, University of Molise, Pesche, Italy
Keywords:
Data Warehouse, Architecture, Cloud Computing, Big Data, Software Engineering, Software Security.
Abstract:
In the design phase of a data warehouse, an appropriate architecture must be selected. To this aim, the engi-
neer assesses various alternatives, depending on the requirements of the specific context. Usually, he chooses
it heuristically, based on his experience. However, it must be considered that there are many parameters to be
taken into consideration.
In this regard, many security problems are due to poor design, as well as the performance may not be appro-
priate to the reference context, or the expected costs and implementation times could be exceeded. A method
of choosing the architecture based on heuristics does not always require a prior and systematic evaluation of
all the parameters that distinguish the different architectures and, therefore, the system is easily exposed to
various problems, the first of which is the system security. Instead, all these parameters should always be
considered in a systematic way, without excluding anyone, to define the importance they have in the reference
context.
In this paper, we propose a systematic approach to support the students and engineers during the choice of the
data warehouse architecture, taking into account the needs of the specific context in which the data warehouse
will be used. This approach requires a prior detection of the importance of the parameters characterizing the
different architectures in the reference context. Then, a global value is defined for each architecture, which
allows to compare them. Furthermore, we present an empirical evaluation of the effectiveness of the proposed
approach.
1 INTRODUCTION
Data warehouses are very important in many areas,
such as cryptographic algorithm for security (Chowd-
hury et al., 2014), big data (Sun et al., 2013), cloud
computing (Sharma et al., 2012), air traffic manage-
ment (Eshow et al., 2014), e-government (Moham-
med et al., 2012), medical (Redzanovic et al., 2011),
electronic (Saravanamuthu and Nawaz, 2015) and so
on.
One of the first issue faced during the design of
a data warehouse is the choice of the most suitable
architecture.
As in software design, the architecture must be
chosen in the initial phase of data warehouse design.
This choice is crucial and the success of the entire
project depends on it.
The designer is faced with a great responsibility,
since the impact of a wrong choice can have signifi-
cant consequences (such as the loss of profit oppor-
a
https://orcid.org/0000-0001-8671-1812
b
https://orcid.org/0000-0003-3736-6383
tunities, the loss of jobs for workers, the closure of a
company sector).
To the best of our knowledge, there is no formal
method to choose the most suitable architecture and
therefore this choice is fundamentally related to the
designer’s experience.
Consequently, a designer could identify an archi-
tecture that does not completely respond to the needs
of the reference context in which the data warehouse
will be used.
This is even easier for inexperienced designers
who may not understand all the consequences of
choosing a specific data warehouse architecture.
Nowadays, we have to think about the consequen-
ces of underestimating the importance of system se-
curity, compared to other parameters such as expected
performance, costs and implementation times.
We are interested in tackling this problem and we
tried to offer our contribution in this direction.
In this paper, we propose a systematic approach to
guide the data warehouse designer to identify the op-
timal architecture, based on a set of parameters cha-
racterizing the different architectures, selecting those
Venditti, A. and Fasano, F.
A Systematic Approach to Choose the Data Warehouse Architecture.
DOI: 10.5220/0007700307110718
In Proceedings of the 5th International Conference on Information Systems Security and Privacy (ICISSP 2019), pages 711-718
ISBN: 978-989-758-359-9
Copyright
c
2019 by SCITEPRESS – Science and Technology Publications, Lda. All rights reserved
711
useful in the context in which the data warehouse will
be used. In particular, we take into account the rela-
tive importance of each parameter compared to the ot-
hers, based on the requirements identified in the soft-
ware engineering analysis phase.
The proposed approach requires the prior asses-
sment of parameters considered important in the refe-
rence context, so that aspects such as security, perfor-
mance, costs and implementation times are highligh-
ted in their order of importance. Thus, the approach
allows to assign a ”weight” to each architecture, in
order to be able to compare the architectures in an ob-
jective way to identify the optimal architecture.
The organization of the paper is as follows.
Section 2 discusses background and presents com-
parison parameters of data warehouse architectures.
Section 3 presents our systematic approach. Section
4 describes the experiment design, while Section 5
shows the experimental results. Section 6 discusses
the results and Section 7 concludes the paper provi-
ding final remarks.
2 BACKGROUND AND RELATED
WORK
2.1 Data Warehouse Architectures
In the literature, many types of data warehouse ar-
chitectures are mentioned (Alsqour et al., 2012; Blai
et al., 2017; Qiang and Liu, 2009; Ariyachandra and
Watson, 2010; Kashfi and Hajmoosaei, 2014; Haj-
moosaei et al., 2011). However, we can refer to the
following five main architectures, considering other
architectures as variants.
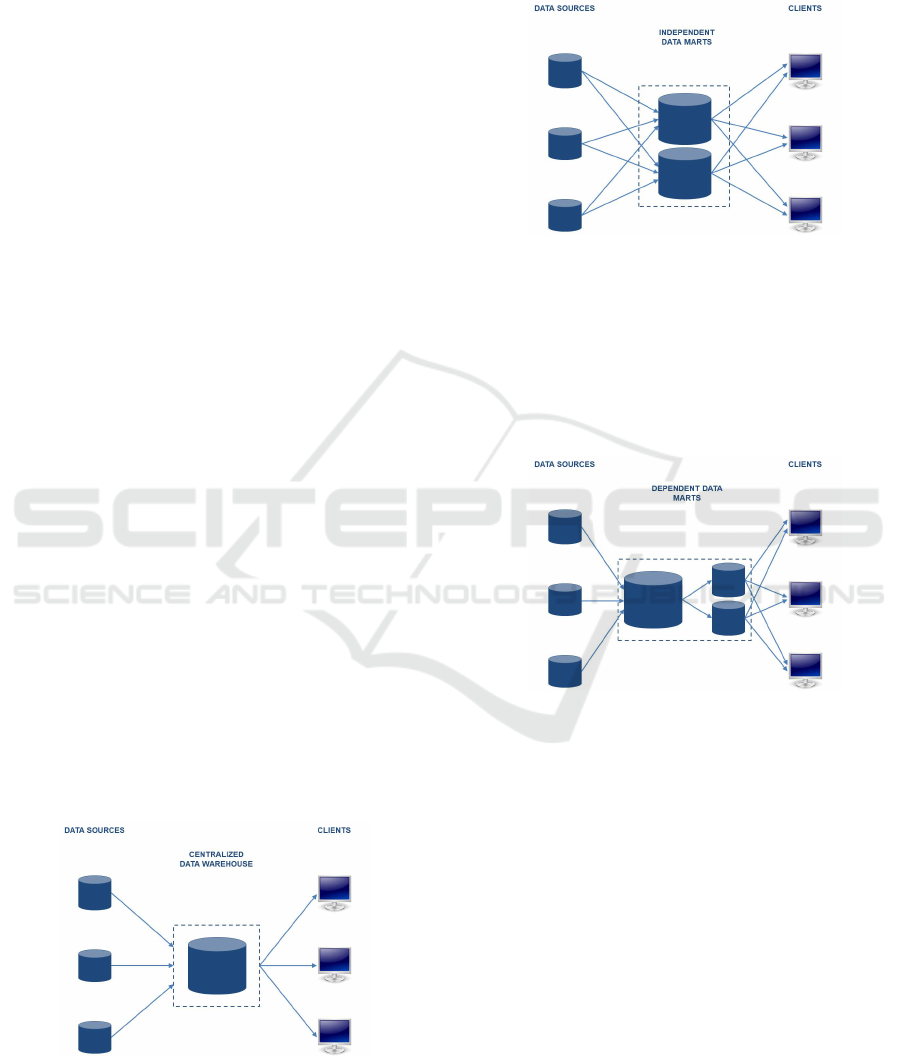
In the centralized architecture (Figure 1) there is
a single location in which all data from the operati-
onal data sources converge. This is the most classic
architecture, where there is no data mart.
Figure 1: Centralized data warehouse architecture.
In the independent data marts architecture (Figure
2) there are many data marts, one for each business
process which has required the knowledge extraction
from operational data sources. In this solution, there
isnt a single location in which data converge and, pro-
bably, each data mart is born for a different purpose.
Figure 2: Independent data marts architecture.
Even in the dependent data marts architecture (Fi-
gure 3) there are many data marts, but they source
from a central data warehouse, in which data con-
verge from operational data sources. This architec-
ture is different from the previous one, as it requires a
great planning effort, with a considerable investment
in terms of time and money.
Figure 3: Dependent data marts architecture.
Finally, in the distributed data warehouse archi-
tecture the data are distributed across the network no-
des which communicate with each other. They can
be classified into homogeneous distributed data ware-
house (Figure 4) and heterogeneous distributed data
warehouse (Figure 5), which differ for nodes having
homogeneous and heterogeneous database respecti-
vely. These solutions are suitable in those contexts
in which data are distributed and should remain so,
because there is an equal level of importance between
the nodes. Consequently, all the elaborations are dis-
tributed among the nodes, for a considerably higher
complexity.
2.2 Related Work
In a real context, the engineer has to choose the data
warehouse architecture (Blai et al., 2017; Qiang and
ForSE 2019 - 3rd International Workshop on FORmal methods for Security Engineering
712
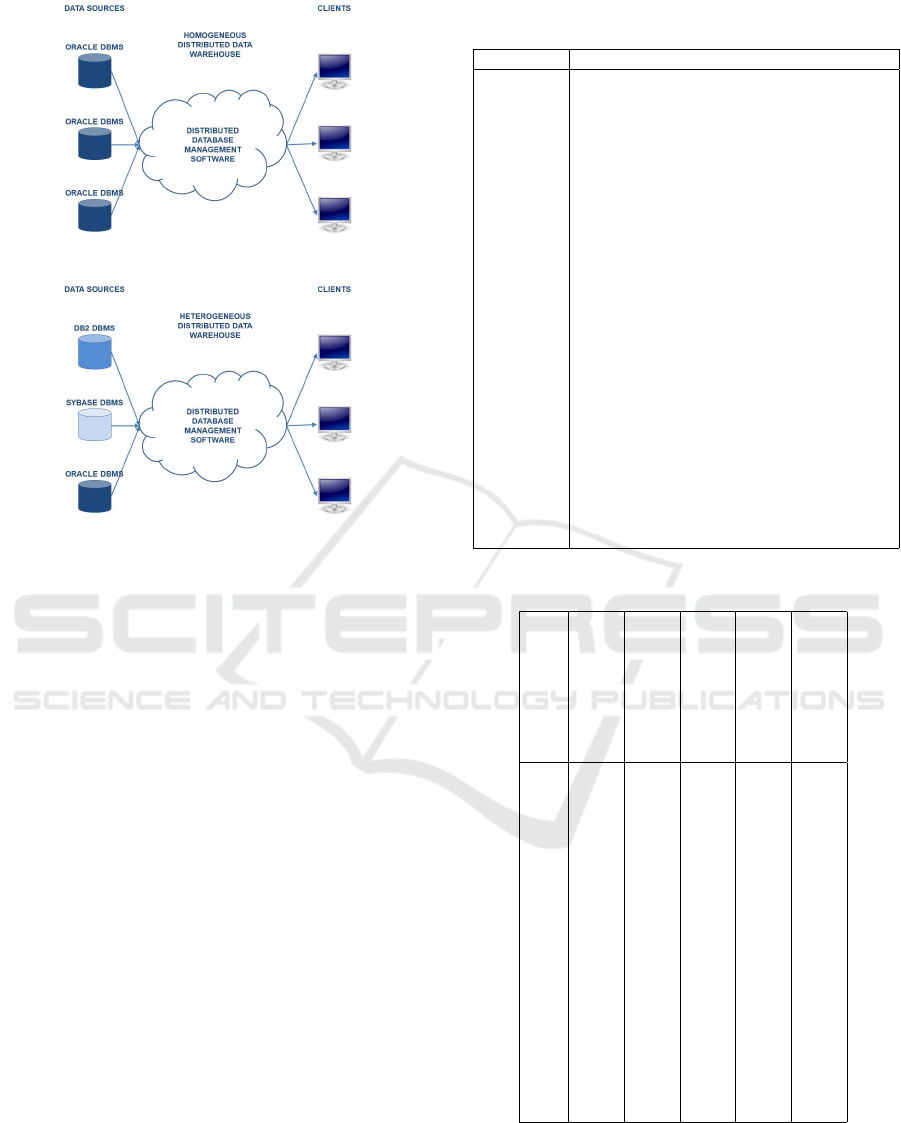
Figure 4: Homogeneous distributed data warehouse.
Figure 5: Heterogeneous distributed data warehouse.
Liu, 2009; Ariyachandra and Watson, 2010; Kashfi
and Hajmoosaei, 2014; Hajmoosaei et al., 2011). He
makes a choice based on his experience, evaluating
primarily times and costs for the solution. In particu-
lar, the engineer should take into account many para-
meters. Eighteen parameters have been proposed in
the literature to compare data warehouse architectu-
res, which we show in Table 1 (Kashfi and Hajmoos-
aei, 2014; Hajmoosaei et al., 2011).
The impact of each parameter on data warehouse
architectures is reported in Table 2. In particular, for
each architecture, the parameter is evaluated depen-
ding on how the specific architecture satisfies it, pro-
viding three different levels (high, average, low).
The comparison studies between the different ar-
chitectures consider the ideal architecture the one that
satisfies the greatest number of parameters. To this
aim, they convert the high, average and low levels
to the 1, 0.5, 0 values and sum them for each archi-
tecture. The global values thus obtained represent an
evaluation of the architectures.
In this way, they obtained the values shown in Ta-
ble 3, in which the first row indicates the sum of the
values 1, 0.5, 0 corresponding to the high, average
and low levels of all 18 parameters and the second
row indicates the percentage compared to the maxi-
mum value obtained in the previuos row.
We observe that this comparison approach:
i) tend to propose an ideal architecture, regardless
of the importance that some parameters have in the
Table 1: Parameters to compare data warehouse architectu-
res.
Parameter Description
p
1
Local Independent
p
2
High-efficiency
p
3
Short-term Implementation
p
4
Early return on investment
p
5
Low Risk
p
6
Flexibility in local and global changes
p
7
Low cost of implementation
p
8
Low cost of management and maintenance
p
9
Low cost of communication for local que-
ries
p
10
Having an integrated vision (Data Inte-
grity)
p
11
High tolerance against system failures
p
12
No adjustment for data models / meta data
with data model / global meta data
p
13
Low network traffic for global queries
p
14
No need for high-speed, stable and safe
communication lines
p
15
No redundancy
p
16
No restriction on storage space
p
17
No conflict between local and global que-
ries
p
18
Low geographical distance of the local
operating systems with data storage
Table 2: Comparison plan of data warehouse architectures.
Parameter
Centralized d.w.
Depend. data marts
Indep. data marts
Homog. distributed
Heterog. distributed
p
1
high low high avg high
p
2
avg high high high high
p
3
low low avg avg high
p
4
low low avg avg high
p
5
low low high avg high
p
6
low low high low avg
p
7
low low avg avg high
p
8
low low high high high
p
9
low high high high high
p
10
high high high high high
p
11
low high high high high
p
12
- high low low low
p
13
high high high low low
p
14
high high high low low
p
15
high avg low low low
p
16
low low high high high
p
17
low high high low low
p
18
low low low high high
specific context in which the data warehouse will be
used. We believe that in some situations some para-
meters are very important, while others are not;
ii) about each parameter, it supposes that the high
level has a double weight compared to the average
A Systematic Approach to Choose the Data Warehouse Architecture
713

Table 3: Context-independent comparison between archi-
tectures.
Parameter
Centralized d.w.
Depend. data marts
Indep. data marts
Homog. distributed
Heterog. distributed
Sum 6 8.5 13.5 9.5 12.5
Percentage 44.44 62.96 100 70.37 92.59
level, while the low level always has a zero value.
Instead, we believe that the ratio between these le-
vels depends on the context. For some parameters,
both the high and average levels could be considered
acceptable in a particular context, just as the average
and low levels could be in another context.
Our approach is based on the parameters above
discussed, but we also take into account the context
in which the data warehouse will be used, according
to the requirements defined in the analysis phase. We
will compare the architectures by defining a ”weight”
for each architecture.
3 OUR SYSTEMATIC APPROACH
AND RESEARCH QUESTIONS
It is important to highlight that the architectural para-
meters must be evaluated by the designer, on the ba-
sis of the functional and non-functional requirements
identified during the analysis phase.
In practice, the approach consists of several steps.
At the beginning, a weight must be assigned to
each of the eighteen parameters. We define w
i
∈ R
+
0
where i ∈ {1, 2, .., 18}, as a value of the importance
that the parameter takes in the specific context. The
highest values are assigned to the most significant pa-
rameters.
We illustrate the rule for assigning weights to pa-
rameters marked as meaningful to the context. When
the requirements indicate that the i
th
parameter has no
importance in the context, it is assigned w
i
= 0.
Instead, regarding the parameters considered sig-
nificant in the context, we must take into account the
importance highlighted by the requirements. In par-
ticular, the analysis phase discussed the importance
of the parameters for the context and, therefore, must
have defined the order of importance between them.
Consequently, we can assume we have n disjoint
sets of parameters, where s
1
is the most important set
of parameters and s
n
is the less important set of pa-
rameters. Obviously, we assume that all the parame-
ters in the same set have the same importance among
them.
Without losing generalities, we can say that the
sets were constituted by the parameter indices (for ex-
ample s
1
= {1, 13, 15} indicates that s
1
is composed
of the parameters p
1
, p
13
, p
15
).
Therefore, we assign the unit weight to the para-
meters of the set s
n
. Then, to the parameters of the
set s
n−1
we assign a weight twice the sum of the pa-
rameters weights of the set s
n
(or equivalently twice
the weight of one of the parameters of the set s
n
mul-
tiplied by the cardinality of the same set s
n
), and so
on.
We summarize in formulas:
w
i
= 1 for each i ∈ s
n
w
i
= 2 ∗ weight(s
k+1
) for each i ∈ s
k
where k ∈
{n − 1, n − 2, , 1}
where the weight(s
k
) function returns the sum of
the weights of the parameters of the set s
k
and is defi-
ned as follow:
weight(s
k
) =
∑
i∈s
k
w
i
At this point, we can show the formula
ArchWeight(A
k
) that computes the weight of the k
th
architecture, where k ∈ {1, 2, .., 5}.
In formulas, named A
k
, where k ∈ {1, 2, .., 5},
the architectures above mentioned, defined f
k
(i) the
function that returns, for the k
th
architecture, the le-
vels in the Table 2 (high, average, low) correspondent
to the i
th
parameter, with i ∈ {1, 2, .., 18}, we can de-
fine the weight of the entire architectures, as follow.
ArchWeight(A
k
) =
∑
18
i=1
g
k
(i) with k ∈ {1, 2, .., 5}
g
k
(i) =
w
i
h
i
if f
k
(i) = ”high”
w
i
a
i
if f
k
(i) = ”average” or ” − ”
w
i
l
i
if f
k
(i) = ”low”
where h
i
, a
i
, l
i
values, with 0 ≤ l
i
≤ a
i
≤ h
i
≤
1, for each i ∈ {1, 2, ..,18}, corresponding to the
high, average and low levels of the Table 2.
It is worth noting that, generally, our approach as-
sign the 0, 0.5 and 1 values to the l
i
, a
i
and h
i
levels
respectively (in the same way that allowed to define
values in Table 3).
However, if the requirements show that both the
high and the average levels are equivalently accepta-
ble for the i
th
parameter, it is possibile to assign the
value 1 both to h
i
and a
i
.
Similarly, if the requirements show that both the
low and the average levels are equivalently unaccep-
table for the i
th
parameter, it is possibile to assign the
value 0 both to l
i
and a
i
.
Finally, it is possible to assign to l
i
, a
i
, h
i
, any va-
lues between 0 and 1, to cope with specific context-
based situations.
Below we present a very simple example, in which
the parameter sets are presented in order of impor-
ForSE 2019 - 3rd International Workshop on FORmal methods for Security Engineering
714

tance:
s
1
= {1,13,15} ; s
2
= {2,4,12} ; s
3
= {7,9,10}
We show the weights assigned to the correspon-
ding parameters, according to the mechanism above
described, as follow:
p
7
=p
9
=p
10
=1 ; p
2
=p
4
=p
12
=6 ; p
1
=p
13
=p
15
=36
We assign 1, 0.5, 0 values to the high, average and
low levels, respectively. Then, we multiply this va-
lues by the weight assigned to each parameter. Sum-
ming, for each architecture, the values thus obtained,
we identify the optimal architecture.
In this way, we obtain the values shown in Table
4, where the penultimate row indicates the sum of the
values obtained by multiplying the weight to the va-
lues of each parameter, while the last row indicates
the percentage compared to the value obtained from
optimal architecture (that is the one with the highest
weight), thus identified.
We observe that, in this particular context, we
obtained that the centralized data warehouse is the op-
timal architecture (while Table 3 shows that this archi-
tecture is clearly opposed to the ideal one, as it satis-
fies fewer parameters than all the others).
Finally, we observe that our solution is easily ex-
tensible to other architectures, because, with another
architecture, will be sufficient to evaluate the corre-
sponding parameters. Similarly, if an additional pa-
rameter needs to be assessed, over to the 18 already
mentioned, it will be sufficient to evaluate it for all
architectures to compare.
Thus, we defined the context-dependent weight of
the architectures.
We formulate the following research questions:
RQ
1
: Does the use of the proposed systematic ap-
proach allow to identify more effectively the optimal
data warehouse architecture compared to the use of
a standard approach, based only on knowledge of the
parameters?
RQ
2
: Does the use of the proposed systematic ap-
proach allow to identify more efficiently the optimal
data warehouse architecture compared to the use of
a standard approach, based only on knowledge of the
parameters?
4 EXPERIMENTATION DESIGN
We designed specific activities related to the design of
data warehouses, in order to choose the optimal data
warehouse architecture.
We proposed these activities to the students of our
University who are about to deal with data warehouse
issues. In particular, the participants were students
of the Bachelor program and Master program, en-
rolled in the 2015/2016 academic year. We divided
the 58 participants in two groups of equal number
of students, the control group and the experimental
group. In addition, we replicated the experiment in
the 2016/2017 academic year, which was attended by
82 students, always constituting the control and expe-
rimental groups with equal number of students.
We monitored the way in which the students car-
ried out their work, supervising the activities in order
to avoid collaboration.
To ensure that there were no differences between
the groups about knowledge and skills on data wa-
rehouse design, we asked students to fill in a pre-
questionnaire to assess their knowledge and skills on
these topics, which confirmed that there were no sta-
tistically significant differences between the groups.
The tasks we proposed to the students consist of
activities in which they had to identify the optimal
data warehouse architecture, in different contexts.
In the training phase, we presented to the stu-
dents the different data warehouse architectures and
we shown the specificity of each parameter. Then,
design exercises were tackled in different contexts, so
that they acquire a practical skill. In practice, first the
students faced the exercises to get to the solution in-
dividually and, at the end, the correct development of
the exercises was shown to them.
After this phase, the experimentation started. We
proposed a series of individual design exercises ai-
med at identifying the optimal architecture of the data
warehouse in different contexts, with increasing com-
plexity. The control group carried out these activities
based only on knowledge of the parameters, just as
a professional designer thinks to get to the solution.
Instead, the experimental group carried out the activi-
ties based on our systematic approach.
The activities of each student have been conti-
nuously monitored. The evaluation was carried out
using the 0-30 scale in which the passing grade is 18
and the execution time has been taken to be compared.
Moreover, at the end of this experimentation student
comments were collected.
We highlight that volunteers were engaged in the
experimentation, as they are more motivated and sui-
ted. Consequently, their interest has ensured the max-
imum participation and an exemplary respect for the
modalities to carry out all the planned activities.
5 EXPERIMENTATION RESULTS
To answer the research questions presented in Section
3, we defined the following null hypotheses to assess
A Systematic Approach to Choose the Data Warehouse Architecture
715
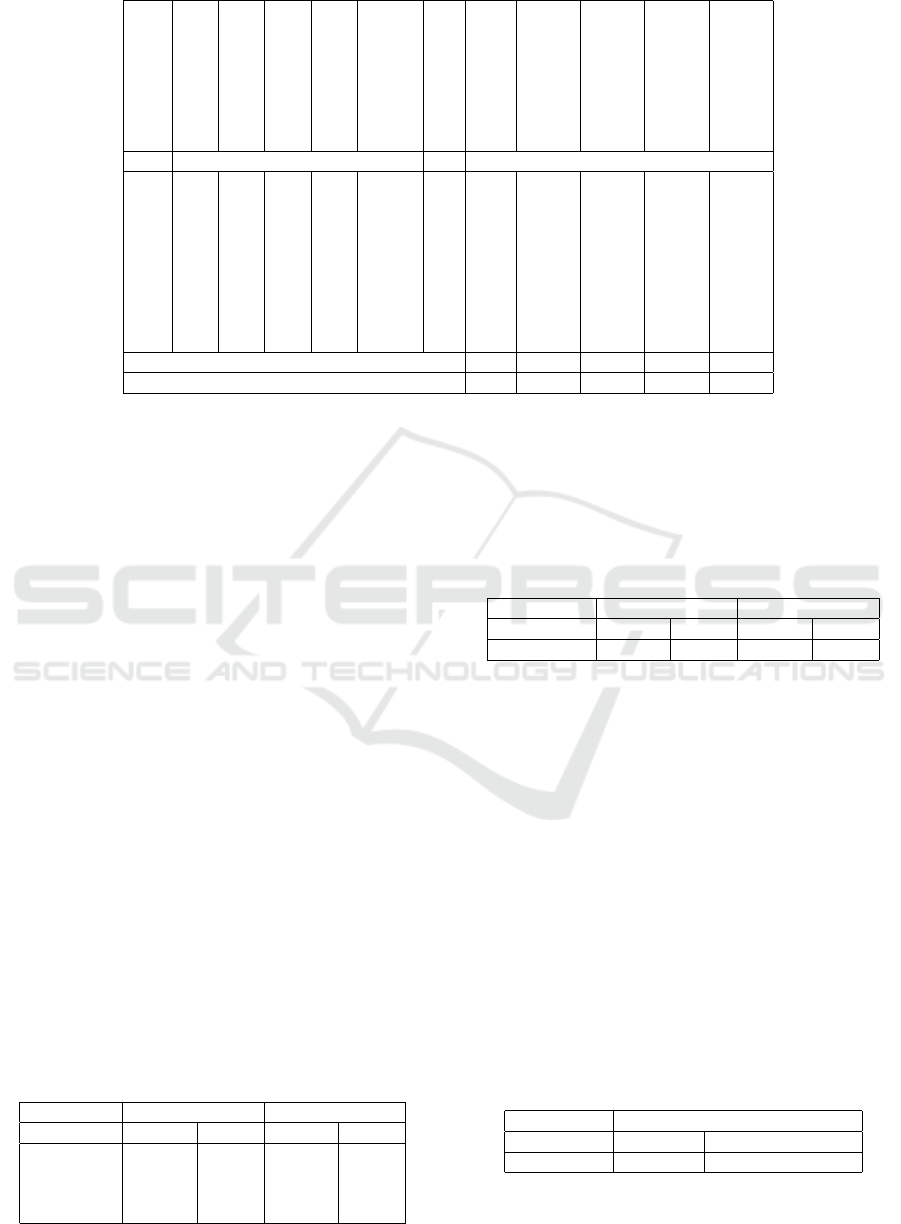
Table 4: Context-dependent comparison between architectures.
Parameter
Centralized d.w.
Depend. data marts
Indep. data marts
Homog. distributed
Heterog. distributed
Weight
Centralized d.w.
Depend. data marts
Indep. data marts
Homog. distributed
Heterog. distributed
p
i
(values related to high/avg/low) w
i
(values multiplied by the weight)
p
1
1 0 1 0.5 1 36 36 0 36 18 36
p
2
0.5 1 1 1 1 6 3 6 6 6 6
p
4
0 0 0.5 0.5 1 6 0 0 3 3 6
p
7
0 0 0.5 0.5 1 1 0 0 0.5 0.5 1
p
9
0 1 1 1 1 1 0 1 1 1 1
p
10
1 1 1 1 1 1 1 1 1 1 1
p
12
0.5 1 0 0 0 6 3 6 0 0 0
p
13
1 1 1 0 0 36 36 36 36 0 0
p
15
1 0.5 0 0 0 36 36 18 0 0 0
Sum 115 68 83.5 29.5 51
Percentage 100 59.13 72.61 25.65 44.35
the efficacy of the proposed systematic approach:
H
1
: The use of the proposed systematic approach
does not significantly allow to identify more effecti-
vely the optimal data warehouse architecture, compa-
red to the use of a standard approach, based only on
knowledge of the parameters.
H
2
: The use of the proposed systematic approach
does not significantly allow to identify more efficiently
the optimal data warehouse architecture, compared to
the use of a standard approach, based only on know-
ledge of the parameters.
The experimentation is based on the assumption
that there were no significant differences between the
two groups about knowledge and skills on data ware-
house design, according to the pre-questionnaire re-
sults, as reported in the previous section.
Participants carried out the planned activity. In
particular, the students carried out the design activi-
ties aimed at identifying the optimal data warehouse
architecture using based only on knowledge of the pa-
rameters in the control group, while the experimental
group used the proposed systematic approach.
In Table 5 we show results of descriptive statisti-
cal analysis for the complete experiment. The values
are related to the evaluation of the student design acti-
vities, according to the 0-30 evaluation scale used.
Table 5: Results of descriptive statistical analysis for the
complete experiment; values are relative to the 0-30 evalu-
ation scale.
Acad. year 2015/2016 2016/2017
Group control exper. control exper.
Minimum 10 20 10 0
Maximum 30 30 30 30
Mean 20.56 27.38 18.10 25.75
Std. dev. 6.39 4.36 6.34 7.21
The results achieved by the experimental group
are, on average, higher than the control group, both
in the first experiment and in its replication.
We analyze the collected data using the
D’Agostino-Pearson normality test (Fraenkel
et al., 2012) and we show them in Table 6.
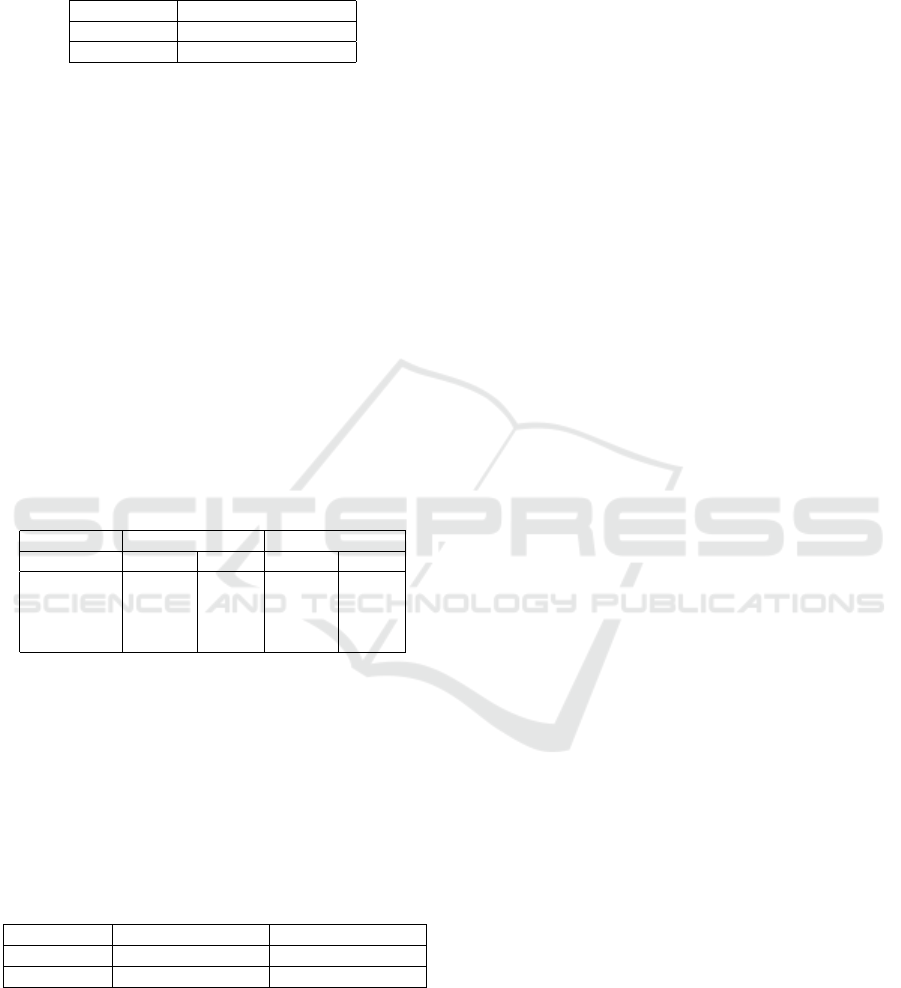
Table 6: Results of D’Agostino-Pearson test (p-value).
Acad. year 2015/2016 2016/2017
Group control exper. control exper.
Assessment 0.812 0.055 0.706 0.001
This results highlight a normal distribution in all
cases, except in the case of the experimental group of
the academic year 2016/2017. So, we continue our
analysis considering parametric independent sample
tests in the case of the academic year 2015/2016 and
considering non parametric independent sample tests
in the case of the academic year 2016/2017 (Fraenkel
et al., 2012).
Therefore, in the case of the academic year
2015/2016 we proceed to calculate the p-value rela-
ted to the difference of two means previously shown.
The choice of test to be performed was carried out
according to the result of the F-test of equality of va-
riance. Depending on the results obtained, Student t-
test is used in case of equal variances, while the Welch
t-test is used in case of unequal variances (Fraenkel
et al., 2012). Table 7 shows results of these tests.
Table 7: Results of F-test and Student t-test (p-value).
Acad. year 2015/2016
Test type F-test Student t-test
Assessment 0.104481 0.000346 (< 0.01)
Instead, in the case of the academic year
2016/2017 we proceed to calculate the p-value related
ForSE 2019 - 3rd International Workshop on FORmal methods for Security Engineering
716
to the Mann Whitney U test (Fraenkel et al., 2012).
Table 8 shows result of this test.
Table 8: Results of Mann Whitney U test (p-value).
Acad. year 2016/2017
Test type Mann Whitney U test
Assessment 0.000006 (< 0.01)
In conclusion, a statistically significant diffe-
rence is highlighted between measures of central ten-
dency. In fact, both for 2015/2016 academic year and
2016/2017 academic year, results highlight p<0.01
significance level.
Therefore, the null hypothesis H
1
can be rejected,
to accept the alternative hypothesis. Consequently,
we can conclude that the use of the proposed systema-
tic approach significantly affect the result to identify
the optimal data warehouse architecture.
Now, we analyze the corresponding time taken to
carry out the design activities.
In Table 9 we observe that the corresponding time
taken is lower in the experimental group than the con-
trol group, both in the first experiment and in its repli-
cation.
Table 9: Results of descriptive statistical analysis for the
complete experiment; values are relative to the time taken
to carry out the design activities (minutes).
Acad. year 2015/2016 2016/2017
Group control exper. control exper.
Minimum 46 45 50 41
Maximum 65 60 66 61
Mean 53.41 50.71 55.40 51.50
Std. dev. 5.54 4.20 3.80 5.22
For brevity, we avoid showing the details and sum-
marizing by saying that the D’Agostino-Pearson test
highlights to normal distribution in all cases, while
the F-test shows equal variance in the first experiment
and unequal variance in the second experiment. Thus,
in Table 10 we show the results of the Student t-test
for the first experiment and the Welch t-test for the
second experiment.
Table 10: Results of Student t-test and Welch t-test (p-
value).
Acad. year 2015/2016 2016/2017
Test type Student t-test Welch t-test
Assessment 0.080724 (> 0.05) 0.000251 (< 0.01)
In conclusion, a statistically significant difference
cannot be observed between measures of central
tendency for 2015/2016 academic year because re-
sults highlight p>0.05 significance level, while a sta-
tistically significant difference can be observed for
2016/2017 academic year, because results highlight
p<0.01 significance level.
Therefore, the null hypothesis H
2
cannot be re-
jected. Consequently, we can conclude that the use
of the proposed systematic approach does not signifi-
cantly affect the time necessary to identify the optimal
data warehouse architecture.
At the end of the experiment we proposed a final
questionnaire related to the used systematic approach,
in which the students confirmed that they identified
the solution with greater awareness.
6 DISCUSSION OF THE RESULTS
The fundamental difference is that the experimental
group had the possibility to use a systematic approach
to individuate the optimal architecture of the data wa-
rehouse. The approach provides a procedure to assign
weights to the parameters that differentiate the archi-
tectures and, consequently, allows to assign a weight
to the entire architecture, in order to make the compa-
rison more objective and easier.
Designers who know perfectly all the architectu-
ral parameters, when faced with a real case in which
there are many parameters that contribute to the iden-
tification of architecture, can follow different reaso-
ning. As a result, different designers can identify dif-
ferent architectures.
The use of a systematic approach allows the de-
signer to be guided through steps to be taken, in order
to make the choice of architecture in a more objective
and simple way.
The experimental results show how this approach
has significantly allowed to reach the correct result
more effectively. In fact, we observed a significant
positive difference in the results of the experimental
group students compared to the control group.
Furthermore, time savings were also highlighted
in both the experiments shown, although a significant
positive difference was highlighted only in one of the
two experiments.
Finally, the results of the final questionnaire con-
firmed the validity of the approach, which makes it
possible to arrive to a reasoned choice with greater
awareness.
7 CONCLUSIONS
We defined a simple systematic approach to obtain a
weight for each data warehouse architecture useful to
compare them. Weight assignments take place depen-
ding on the context in which the data warehouse will
be used.
A Systematic Approach to Choose the Data Warehouse Architecture
717

Our approach indicates the analysis phase as that
moment in which it is necessary to highlight which
are the most important architectural parameters, such
as system security, expected performance, time and
costs of implementation. This ensures greater objecti-
vity in the choice, which can be better documented to
be shared with the client, so that there is greater awa-
reness.
A systematic approach allows the expert designer
to evaluate all the architectural parameters conside-
red important in the reference context. In this regard,
we can refer to those cases in which the problem of
system security has been underestimated, or to those
cases in which the performance was inadequate, or
to those in which the costs and implementation times
exceed all expectations.
Furthermore, our proposal is useful in teaching
area, when we have to face the data warehouse stu-
dies. Students will be able to better understand the
way in which they arrive to the architectural choice.
In addition, they will have a greater awareness of what
they are doing, in order to acquire the necessary skill.
Statistical analysis confirm the effectiveness of
our proposal, as the results of the experimental group
were better in terms of correctness compared to the
control group, for both proposed experiments. With
regard to efficiency, we noticed a time saving in the
experimental group, even if the statistical analysis de-
tect a significance for only one of the two proposed
experiments.
Finally, the post-experiment questionnaire confir-
med that students identified a more convincing solu-
tion and were enthusiastic to have had the chance to
learn this approach.
REFERENCES
Alsqour, M., Matouk, K., and Owoc, M. L. (2012). A
survey of data warehouse architectures preliminary
results. In 2012 Federated Conference on Compu-
ter Science and Information Systems (FedCSIS), pages
1121–1126.
Ariyachandra, T. and Watson, H. (2010). Key organizati-
onal factors in data warehouse architecture selection.
Decision Support Systems, 49(2):200 – 212.
Blai, G., Poi, P., and Jaki, D. (2017). Data warehouse archi-
tecture classification. In 2017 40th International Con-
vention on Information and Communication Techno-
logy, Electronics and Microelectronics (MIPRO), pa-
ges 1491–1495.
Chowdhury, R., Datta, S., Dey, S. K., and Shaw, S. (2014).
Design and implementation of proposed drawer mo-
del based data warehouse architecture incorporating
dna translation cryptographic algorithm for security
enhancement. In 2014 International Conference on
Contemporary Computing and Informatics (IC3I), pa-
ges 55–60.
Eshow, M. M., Lui, M., and Ranjan, S. (2014). Architec-
ture and capabilities of a data warehouse for atm rese-
arch. In 2014 IEEE/AIAA 33rd Digital Avionics Sys-
tems Conference (DASC), pages 1E3–1–1E3–14.
Fraenkel, J., Wallen, N., and Hyun, H. (2012). How to De-
sign and Evaluate Research in Education. McGraw-
Hill, New York, NY, USA, 8th edition.
Hajmoosaei, A., Kashfi, M., and Kailasam, P. (2011). Com-
parison plan for data warehouse system architectures.
In The 3rd International Conference on Data Mining
and Intelligent Information Technology Applications,
pages 290–293.
Kashfi, M. and Hajmoosaei, A. (2014). Optimal distri-
buted data warehouse system architecture. In 2014
IEEE Fourth International Conference on Big Data
and Cloud Computing, pages 110–115.
Mohammed, M. A., Hasson, A. R., Shawkat, A. R., and
Al-khafaji, N. J. (2012). E-government architecture
uses data warehouse techniques to increase informa-
tion sharing in iraqi universities. In 2012 IEEE Sympo-
sium on E-Learning, E-Management and E-Services,
pages 1–5.
Qiang, S. and Liu, L. (2009). Research on the design of a
new data warehouse system. In 2009 2nd IEEE Inter-
national Conference on Computer Science and Infor-
mation Technology, pages 462–465.
Redzanovic, S., Chountas, P., Chaussalet, T., Fouladinejad,
F., and Tadjer, M. (2011). Data warehousing based
architecture for the reporting of the nhs primary care
prescribing. In 2011 24th International Symposium
on Computer-Based Medical Systems (CBMS), pages
1–6.
Saravanamuthu, M. and Nawaz, G. M. K. (2015). Max-
imum performance with minimum cost in data mi-
ning applications through the novel online data ware-
house architecture by using storage area network with
fibre channel fabric. In 2015 International Confe-
rence on Circuits, Power and Computing Technologies
[ICCPCT-2015], pages 1–7.
Sharma, Y., Nasri, R., and Askand, K. (2012). Building
a data warehousing infrastructure based on service
oriented architecture. In 2012 International Confe-
rence on Cloud Computing Technologies, Applicati-
ons and Management (ICCCTAM), pages 82–87.
Sun, L., Hu, M., Ren, K., and Ren, M. (2013). Present
situation and prospect of data warehouse architecture
under the background of big data. In 2013 Interna-
tional Conference on Information Science and Cloud
Computing Companion, pages 529–535.
ForSE 2019 - 3rd International Workshop on FORmal methods for Security Engineering
718
