
Monitoring of Non-functional Requirements of Business Processes based
on Quality of Service Attributes of Web Services
Evando S. Borges
1
, Marcelo Fantinato
1
,
¨
Unal Aksu
2
, Hajo A. Reijers
2
and Lucin
´
eia H. Thom
3
1
School of Arts, Sciences and Humanities, University of S
˜
ao Paulo, S
˜
ao Paulo, Brazil
2
Department of Information and Computing Sciences, Utrecht University, Utrecht, The Netherlands
3
Institute of Informatics, Federal University of Rio Grande do Sul, Porto Alegre, Brazil
Keywords: Business Processes, Monitoring, Business Level Agreement, Service Level Agreement, Quality of Service.
Abstract:
Business monitoring approaches usually address indicators associated with processes only at the service level;
i.e., related to the services implementing the processes. Monitoring at the service level raises technical mea-
sures geared to Information Technology (IT) managers. Monitoring of Key Performance Indicators (KPIs)
is usually carried out at a higher level, but transversely to the organization’s processes, i.e., uncoupled from
the processes. We present a component designed to aid in strategic alignment between business and IT by
monitoring Non-Functional Requirements (NFR) of processes based on Quality of Service attributes. This
component aims to allow business managers to monitor process executions by focusing on the indicators that
truly respond to the execution of such processes. We evaluated the component via a proof of concept.
1 INTRODUCTION
In the global corporate landscape, with wide com-
petition among organizations, real-time monitoring
of Non-Functional Requirements (NFR) of business
processes are a competitive edge, complementing the
monitoring of functional requirements of processes.
An organization that quickly realizes that a part of its
process is not responding as expected, in terms of exe-
cution time, for example, can decide before a negative
process outcome (Lubinski, 2008). Several types of
NFRs can be typically associated with processes, such
as those related to performance, security, availability,
parallelism and cost (Presman and Maxim, 2014).
To monitor process NFRs, these requirements
need to be specified systematically. The solution cho-
sen to implement the processes can cause an impact
on how monitoring of process NFRs can be carried
out. Process automation and execution are commonly
supported by Service-Oriented Architecture (SOA),
using web services technology (Curbera et al., 2002;
Sheng et al., 2014; Fahad et al., 2015). Service Level
Agreement (SLA) are defined in terms of QoS at-
tributes, which are the NFRs per se. QoS attributes
and levels are commonly called Service Level Objec-
tives (SLO). NFRs for process models can be defined
as Business Level Agreements (BLAs) – like SLAs,
but at the process level – as proposed as in the ba-
sis of this work (Salles et al., 2013; Barros et al.,
2014; Salles et al., 2018). Business Activity Monitor-
ing (BAM) refers to real-time access to critical busi-
ness performance indicators to improve the viability
of business operations (Lubinski, 2008).
Existent approaches aimed at the monitoring of
process NFRs purely work from the technical point
of view; i.e., they address the individual monitor-
ing of each of the services that implement a process.
This technical point of view is useful for the Informa-
tion Technology (IT) team, which needs to follow the
performance of the services that implement the pro-
cesses. For business areas, this view is overly detailed
and needs to be translated into a high level view for
them to understand (Salles et al., 2018). A particular
business area may be interested in a part of a critical
process that will only present a problem if a full set of
services presents any problem (Dumas et al., 2018) 1.
There are approaches to monitoring indicators at
the highest organizational level – the Key Perfor-
mance Indicators (KPIs) (Carmo et al., 2017). How-
ever, KPI monitoring is usually carried out cross-
cutting the organization’s processes. Thus, this moni-
toring specifically targeted to business managers is of-
ten decoupled from processes. In addition, KPI mon-
itoring is often not aligned with monitoring the ser-
vices used to implement the processes.
Consider the loan process model in Figure 1.
588
Borges, E., Fantinato, M., Aksu, Ü., Reijers, H. and Thom, L.
Monitoring of Non-functional Requirements of Business Processes based on Quality of Service Attributes of Web Services.
DOI: 10.5220/0007700605880595
In Proceedings of the 21st International Conference on Enterprise Information Systems (ICEIS 2019), pages 588-595
ISBN: 978-989-758-372-8
Copyright
c
2019 by SCITEPRESS – Science and Technology Publications, Lda. All rights reserved
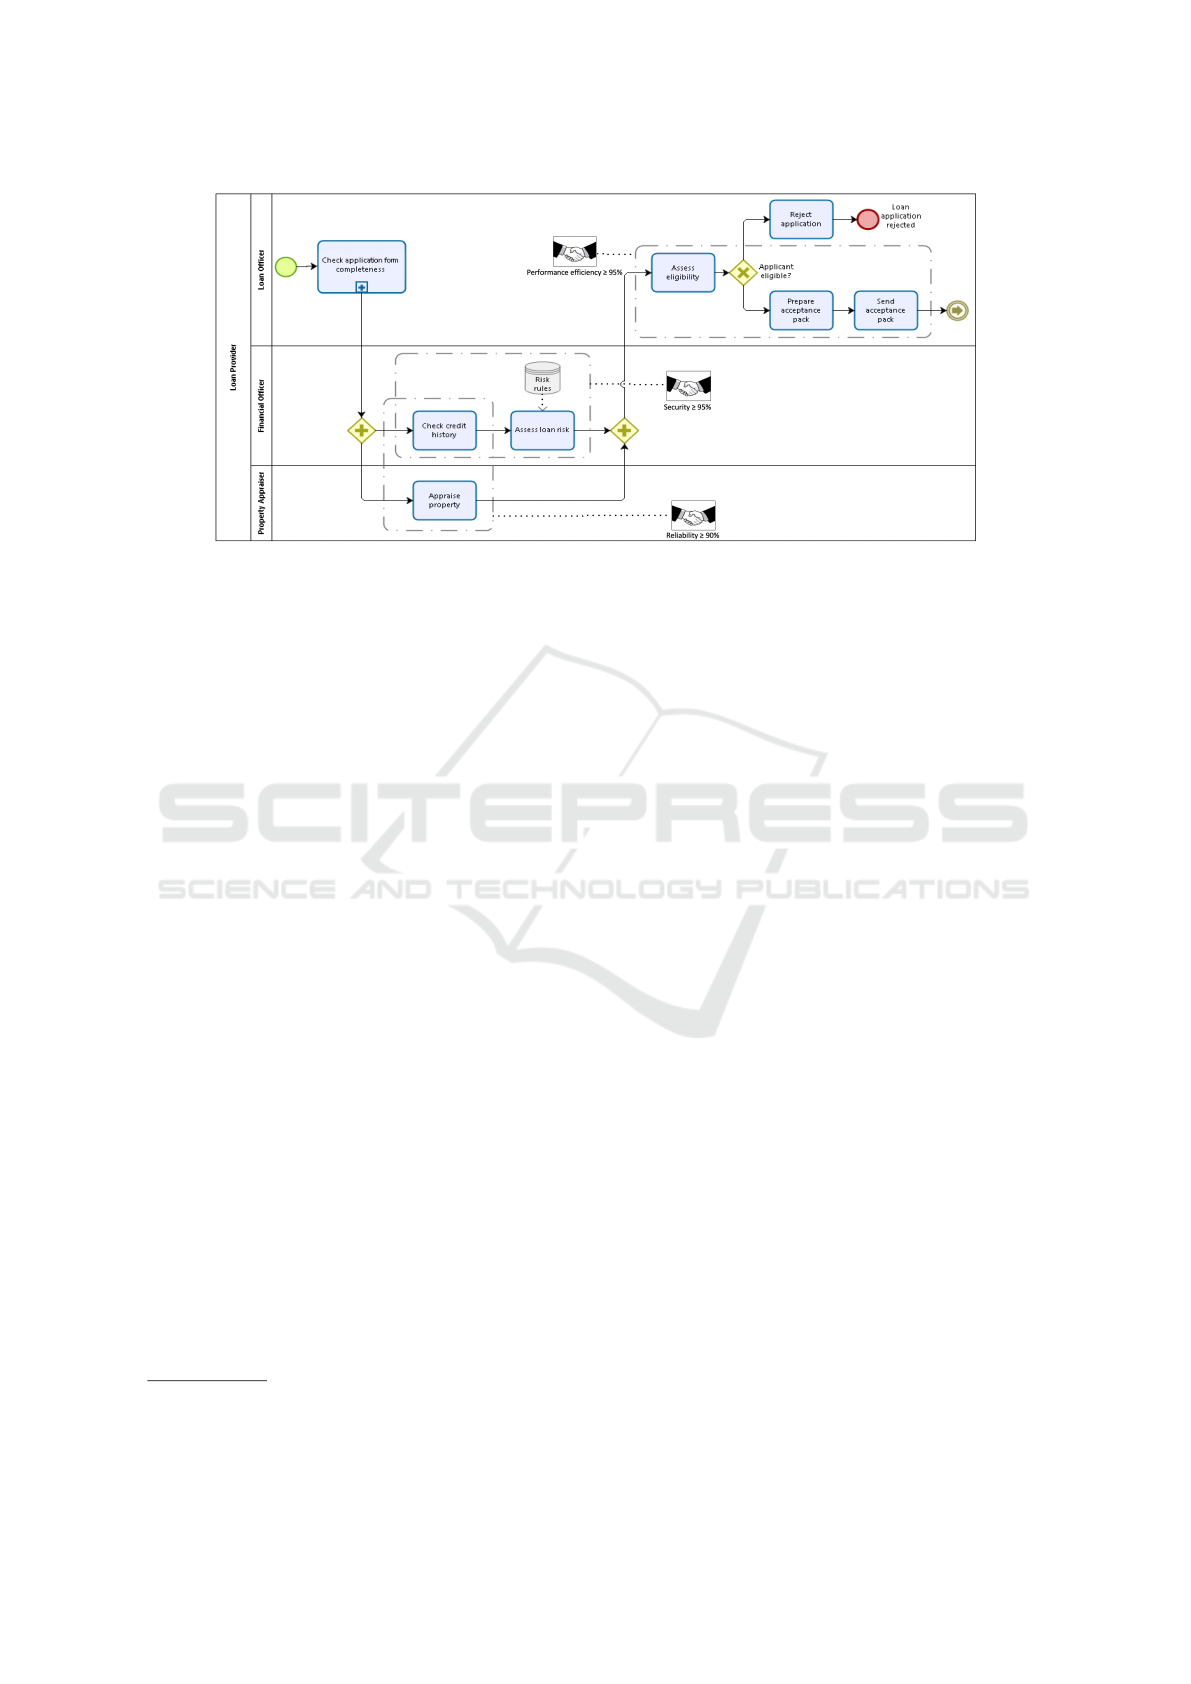
Figure 1: Loan business process model – scenario example of process-level NFRs [(Dumas et al., 2018), page 111, adapted].
In Figure 1, business managers (i.e., the “process
owners”) should be able to verify whether specific
parts of the process are operating according to their
goals. It may be relevant for the “Financial Officer” to
execute the activities “Check credit history” and “As-
sess loan risk” having security
1
as an NFR. This NFR
is needed to guarantee a high level of data integrity
and access control in this part of the process because
of the sensitivity of the information involved. From
the business manager’s perspective, this is what mat-
ters in terms of NFRs involving these two tasks, and
for which they would like to be informed about the
process’s ability to comply with. Technical details
of services implementing these tasks, such as those
involving scalability, testability, operability or stabil-
ity are not their focus of interest but rather of the IT
team. Similar cases in Figure 1 relate to requirements
“Performance efficiency” and “Reliability” and the
corresponding set of activities aggregated by each of
them. Considering monitoring levels, business man-
agers would not like to be awakened at dawn because
some service is down. However, they would like so if
this incident had a major impact on delivering a criti-
cal part of the process under their responsibility.
A comprehensive solution for monitoring NFRs
that considers both business and IT perspectives
should rely on the definition of NFRs at both levels.
Based on this goal, the StrAli-BPM (Strategic Align-
ment with Business Process Management) framework
was proposed before (Salles et al., 2013; Barros et al.,
2014; Salles et al., 2018). The StrAli-BPM frame-
work requires that NFRs are first specified in process
models by business analysts. Later, NFRs at the pro-
1
The NFR nomenclature adopted in this paper, for both
process and service levels, is based on a dictionary proposed
specifically for this purpose (Castro et al., 2019).
cess level are then used as the basis for defining the
Quality of Service (QoS) attributes of the services by
IT experts. These services are those that will imple-
ment the process activities. In this way, NFRs at pro-
cess and service levels relate to each other.
This paper proposes a component for the moni-
toring of process NFRs as part of StrAli-BPM. The
proposed component is called StrAli-BAM – Strate-
gic Alignment with Business Activity Monitoring. Al-
though StrAli-BAM is designed as a StrAli-BPM
component, it is adaptable to similar contexts. The
proposed component can monitor NFRs at the pro-
cess level based on QoS attributes. This is possible
given that StrAli-BPM first uses NFRs at the process
level to derive the QoS attributes of the corresponding
services. StrAli-BAM aims to enable different areas
and organizational levels to share a common cockpit
or dashboard for real-time monitoring, providing an
additional contribution to strategic alignment.
This paper presents in the following sections the
proposed component and its evaluation.
2 THE StrAli-BAM COMPONENT
In the broader context of the StrAli-BPM framework
(cf. Figure 2), the new component was designed to
enhance strategic alignment between business and IT
by the monitoring of process NFRs. The monitoring
of process NFRs is carried out via the monitoring of
BLAs associated with business processes modeled in
BPMN. This monitoring is also associated with mon-
itoring SLAs and should be associated with KPI mon-
itoring in the future.
Figure 2 shows the original framework (white el-
ements) extended with the new component (gray ele-
Monitoring of Non-functional Requirements of Business Processes based on Quality of Service Attributes of Web Services
589

Figure 2: Extended StrAli-BPM framework.
ments). The gray double-dashed arrow shows the in-
tention to add the monitoring of the KPIs used in the
creation of the BLAs being monitored.
The primary intent of the monitoring offered by
the proposed component is targeted to process NFRs,
i.e., to BLAs. BLAs fill the gap between all lev-
els of NFRs – from those extracted from KPIs to
those derived to SLAs. As processes are run via their
‘executable’ versions in Web Service Business Pro-
cess Execution Language (WS-BPEL), the SLAs of
the corresponding web services are the directly mon-
itorable elements in this infrastructure. Thus, BLAs
are monitored only indirectly, since they are associ-
ated with BPMN process models in a non-executable
version. As a result, the monitoring strategy of
the proposed component considers the ‘top-down’
creation history of SLAs from BLAs to conduct a
‘bottom-up’ monitoring of BLAs based on SLAs.
Figure 3 shows the component architecture, com-
prising a process execution infrastructure (Oracle
SOA Suite 12c) and a monitoring module (BLA Mon-
itor). Via the execution infrastructure, the process
is carried out using the Oracle BPEL 12c and Ora-
cle Mediator 12c platforms integrated via Oracle In-
stance. The BLA Monitor must process SLOs (SLO
Processor) and display BLA reports (BLA Report
Viewer). It receives the SLOs from the execution in-
frastructure via the SLO Collector interface.
Figure 3: Architecture of the StrAli-BAM component.
2.1 BLA Monitor
Aiming at strategic alignment, the monitoring of pro-
cess NFRs should be offered to different organiza-
tional areas and levels via an integrated dashboard,
with distinct levels, types and groupings of informa-
tion. Figure 4 shows, via an ArchiMate model (TOG,
2018), the architecture of the designed BLA monitor,
based on SLAs and their respective SLOs.
Per Figure 4, the main elements of the BLA Mon-
itor component are SLO Processor and BLA Report
Viewer. Although this component works directly with
StrAli-BPM, it has been designed in a decoupled way,
assuming it can be used in other similar contexts.
The first step of SLO processing is to Register
BLA. In this step, the BLA and SLA artifacts – i.e.,
the monitoring targets, generated by the other compo-
nents of the StrAli-BPM framework – should be con-
sumed as the initial input. The registration of a BLA
to be monitored with its respective SLAs is then car-
ried out. This action is carried out via the Import BLA
interface, for the Register BLA service, generating the
SLO data object in the database. For each SLO within
an SLA, a unique identifier is generated and its QoS
attribute and level are identified and also stored in the
database. The BLA register must consider all the con-
tent (of a BLA and its respective SLAs) needed to en-
able the correct and complete BLA monitoring, ac-
cording to the meta-models proposed in earlier works
(Salles et al., 2018). For example, different penalty
and bonus thresholds for each BLA (when applica-
ble) and the number of runs to be taken for averages
calculations must be brought in properly.
The second step of SLO processing is to Collect
SLO Result. This processing is triggered whenever
a service with at least one associated SLO runs for
the process being monitored. The associated service
Collect SLO Result stores the measured value of the
QoS attribute for the corresponding SLO; this value
is stored in the database as the SLO Monitoring Re-
sult data object. The SLO Record interface receives
requests for SLO result collection.
The third step of SLO processing is to Process
SLO Result by comparing the measured value (stored
in the SLO Monitoring Result) with the expected level
of SLO. This comparison results in the BLA indicator
data object, which serves as input to the service BLA
Report Viewer. As each SLO is processed, its SLAs
and BLAs must have their execution results set to –
passed, failed or warning. Depending on the number
of penalty or bonus thresholds associated with a cor-
responding BLA, distinct levels of results should be
used for the passed and failed options, since moni-
toring may show passed results with different bonus
ICEIS 2019 - 21st International Conference on Enterprise Information Systems
590
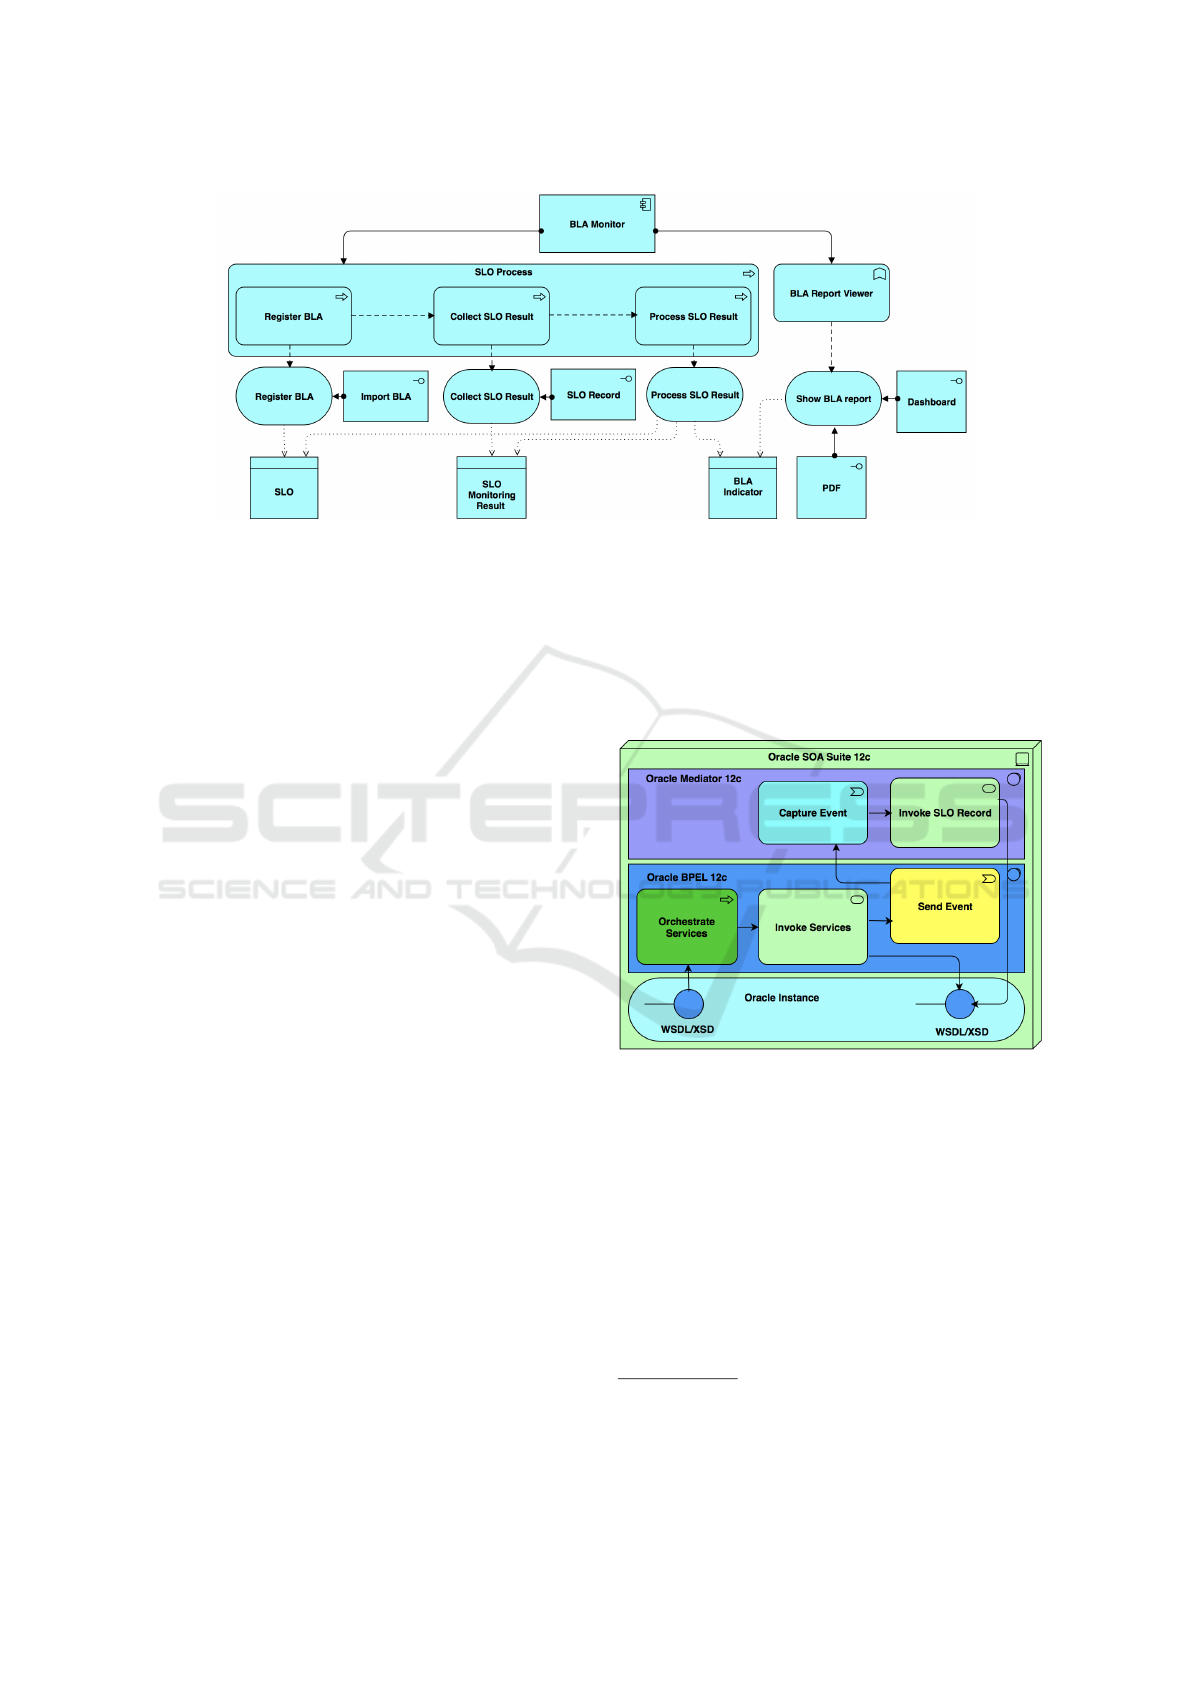
Figure 4: BLA monitor architecture.
levels (passed level 1, passed level 2 etc.) or failed re-
sults with different penalty levels (failed level 1, failed
level 2 etc.). The numbers of runs to be taken for av-
erages calculations, as registered during the Register
BLA for each BLA and SLA, must be considered.
BLA Report Viewer shows the results to users
via Dashboard and PDF interfaces. The BLA Re-
port Viewer service uses the indicators generated by
the SLO processing to display, in real-time, the in-
formation of the BLA monitored and its respective
SLAs. The dashboard should allow the visualization
of the generated data via distinct perspectives and de-
tail levels. General indicators can be merged on the
main screen, useful for both business and IT man-
agers. From the overview, managers should be able
to view details via distinct perspectives, such as by
process, by activity, by service, by BLA, by SLA, by
NFR type. Managers should also be able to choose,
for example, criticality levels, i.e., processes with a
high warning or failed degree. Given a process and
its BLAs, responsible managers should be able to do
a top-down reading to understand which SLAs are
causing their BLAs to break. Similarly, a bottom-up
view can also be used; for example: from a service
whose SLA is not being met, it should be possible
to view which processes and BLAs are affected. Fi-
nally, managers should be able to access data related
to penalties and bonuses resulting from executions,
also via distinct perspectives and levels of detail.
2.2 Event-based Monitorable Execution
Infrastructure
For the monitorable execution of processes, an event-
based processing infrastructure is proposed. The tech-
nical solution adopted as a proof of concept is based
on the Oracle SOA Suite 12c
2
platform, which offers
comprehensive integration. The following platform
components were used: Oracle BPEL 12c and Or-
acle Mediator 12c. Integration between the compo-
nents was done via Oracle Instance as presented via
an ArchiMate diagram in Figure 5.
Figure 5: Event-based monitorable execution infrastructure.
Oracle BPEL 12c orchestrates the services com-
posing the process and thus receives as input the WS-
BPEL file to be executed. To enable the monitoring
of the process execution, the services to be monitored
need to be first identified for monitoring. The WSDL
interface of each service with an associated SLA is
extended with a canonical scheme fragment for mon-
itoring, for each SLO in the SLA associated with it.
A canonical scheme
3
was used to ease interac-
tion between services, enabling reuse. The canonical
scheme is defined via XSD, cf. Figure 6. It spec-
ifies the general structure of an SLA goal – i.e., an
2
License for development, testing and prototyping.
3
Canonical scheme is a design pattern applied in SOA
to ease the exchange of data between services (Erl, 2005).
Monitoring of Non-functional Requirements of Business Processes based on Quality of Service Attributes of Web Services
591
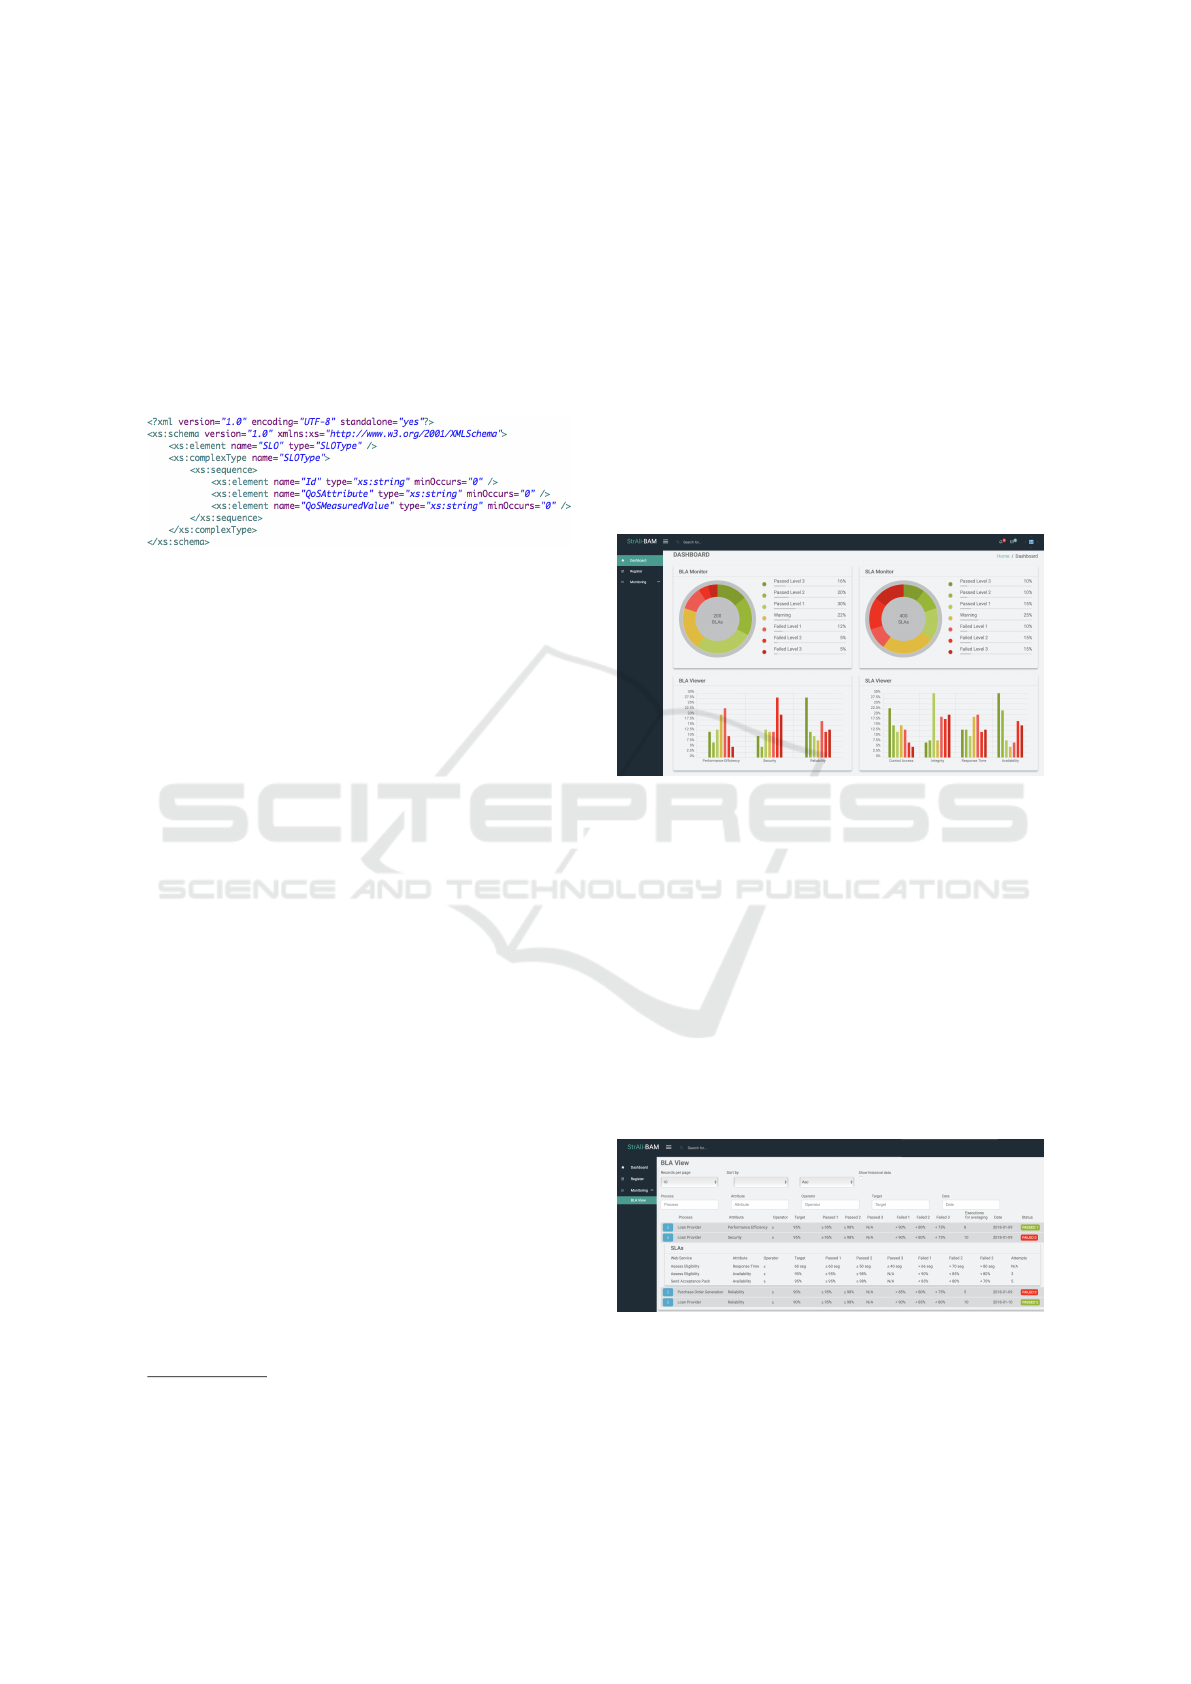
SLO – to be reused in the WSDL interface of the ser-
vices to be monitored. For each SLO to be measured
in the same service, a canonical scheme must be in-
stantiated and embedded as an extension of its WSDL
interface. An SLO is composed of: Id (identifier of
the SLO to be monitored); QoSAttribute (type of the
NFR to be monitored, such as response time, avail-
ability, throughput); and QoSMeasuredValue (result
of the attribute measured when the service runs).
Figure 6: Canonical scheme for monitoring.
per Figure 5, the execution and monitoring of a
process begin with Orchestrate Services receiving the
set of WSDL/XSD interfaces. The service orches-
tration needs to Invoke Services, which makes a re-
quest to the services presented by the platform in-
stance via WSDL/XSD interfaces. Services that are
identified for monitoring, via one or more instances of
the canonical scheme, trigger events. This is done via
Event Definition Language (EDL) – an XML dialect
of the Oracle SOA Suite 12c platform. As a result,
Send Event is triggered via defined rules for sending
events, which are captured in the Oracle Mediator 12c
layer by Capture Event. Finally, the Capture Event
module gets the event request and triggers the Invoke
SLO Record module. Then, the Invoke SLO Record
module forwards the corresponding SLO so that mon-
itoring is continued by the proposed component, as in
Figure 4 (via the SLO Record interface).
2.3 Prototype Tool
To show the component feasibility, functional tests
were carried out via a prototype to perform a proof
of concept of the component. The prototype allowed
to simulate the execution and monitoring of a process
according to the proposed component.
The prototype was developed with Oracle Java 8
(for back-end development), Spring Boot
4
(for con-
figuration management), Spring Tool Suite
5
(as IDE)
and Angular JS
6
(for the front-end development).
Figures 7–9 show examples of the developed
dashboard prototype. They were designed follow-
ing the specification presented in Section 2.1 for the
Dashboard interface of the BLA Report Viewer.
4
http://spring.io/projects/spring-boot
5
http://spring.io/tools
6
http://angular.io
Figure 7 shows the screen proposed to consolidate
the results. The two charts at the top show a sum-
mary of cumulative results for all the organization’s
processes for BLAs and SLAs, including the percent-
ages of passed, failed and warning results. Consider-
ing the BLA and SLA meta-models on which the pro-
posed component is primarily based (cf. Section 2.1),
there may be different levels of passed and failed for
some BLAs and SLAs. The two bottom charts show
a summary of the cumulative results but separated by
BLA and SLA, including all those being used by the
organization’s processes at that time. This same con-
solidation structure can be used to show, for example,
the data of a single process of the organization.
Figure 7: Dashboard prototype – indicators overall.
Figure 8 shows data detailed by BLA. For each
BLA of a process, its basic information such as name
and description (i.e., NFR type, operator and main tar-
get) is shown. It is also possible to check its current
status in terms of passed, failed or warning consoli-
dated result, based on the last average calculation. It
is also possible to consult the historical basis for each
BLA. For each BLA, one can also view the data of
the SLAs derived from it and hence associated with
it, as in the figure for BLA Security and process Loan
Provider. SLAs are shown followed by their basic in-
formation. Thus, if a BLA has failed or is on warning,
it is possible to verify the root cause for this.
Figure 8: Dashboard prototype – BLA view.
Figure 8 shows the option to fully detail one BLA.
The BLA Performance Efficiency is illustrated here.
The first two data frames show the same data as the
previous screen. The following frames detail the
ICEIS 2019 - 21st International Conference on Enterprise Information Systems
592

monitoring results for each process instance execution
considering the data shown in the first two frames.
Figure 9: Dashboard prototype – BLA monitoring details.
3 EVALUATION
The loan process model in Figure 1 was explored to
evaluate the proposed component. The BLA “Perfor-
mance efficiency
7
≥ 95%” (associated with the activ-
ities Assess elegibility, Prepare acceptance pack and
Send acceptance pack) was chosen for this evalua-
tion. This BLA was defined considering the rules de-
fined by the BLA meta-model on which the proposed
component is primarily based (cf. Section 2.1). The
details of the BLA are not shown graphically in the
process model, but only in terms of the element prop-
erties in the tool. Some of these details can be seen
in the prototype presented herein (cf. Figure 8). In
Figure 8, it is possible to consult, for example, the
different thresholds for the application of penalties in
case of non-compliance with the target and different
thresholds to be awarded bonuses in case the goal is
reached more satisfactorily than expected. For exam-
ple, for this BLA, the target is 95%, with a tolerance
of 5% and three penalty levels (< 90%, < 80% and <
75%). The lower the level of performance obtained,
the higher the penalty applied. On the other hand,
there are two levels of bonus (≥ 95% and ≥ 98%);
the higher the level, the higher the bonus.
Using the proposed infrastructure (cf. Figure 5)
and component (cf. Figure 4), the process was exe-
cuted and monitored. The process model in Figure 1
7
Per the adopted NFR nomenclature, “performance ef-
ficiency” means: degree to which a process can efficiently
use an amount of resources (such as software, products and
hardware) under stated conditions (Castro et al., 2019).
was implemented in WS-BPEL as in Figure 10. The
dotted red line highlights the code fragment corre-
sponding to the implementation of the three process
activities associated with the BLA under analysis.
Four services were used to perform these three activ-
ities (two services for activity Assess elegibility, one
service for Prepare acceptance pack and one service
for Send acceptance pack). To achieve the target of
this BLA, three SLAs were defined: ‘response time’
and ‘availability’ for the first service used to exe-
cute Assess eligibility and ‘availability’ for the service
used to execute the activity Send acceptance pack
8
.
Some details of each SLA are in Figures 8 and 9, in-
cluding their targets, different penalty thresholds and
different thresholds for granting bonuses, and maxi-
mum number of attempts per process instance. The
Fixture Factory
9
tool was used to generate random
data (i.e., the mocks) to simulate the SLA processing.
Figure 11 shows a consolidated view of the re-
sults of the monitoring simulation for the loan pro-
cess. The BLA is considered failed for an instance
execution if any of the associated SLAs are finalized
failed for that execution. The third SLA, referring to
the second service, is only evaluated if the first ser-
vice could be executed, i.e., if it was available. Per
Figure 11, one can observe that the scenarios relevant
for the business areas are different from IT. For ex-
ample, an SLA that fails may not necessarily reflect
a failure in the corresponding BLA. Thus, the busi-
ness area needs not to be involved in minor technical
issues, which can be handled in isolation by IT. The
calculations of each BLA and each SLA is performed
independently although the BLA calculation consid-
ers the result of SLAs that are associated with it. Each
SLA presents an isolated view specific to IT manage-
ment and the calculation to determine whether its tar-
get is being reached is performed in a parametrized
way for each SLA. For example, for the SLA Re-
sponse Time, the calculation is being done every five
executions of the associated service. The same is oc-
curs for BLAs, which in this case is being done every
10 process instance executions. In Figure 11, results
are shown for 20 instance executions, which enabled
to calculate the BLA average value twice, whose re-
sults were 90% (Warning) and 70% (Failed Level 3).
Also, depending on the nature of the service, it is pos-
sible to parametrize the maximum number of attempts
it will retry, in case its SLA is failed, before the cor-
responding BLA is considered having failed.
An example of a situation where a technical prob-
8
The definition of which services should have SLAs as-
sociated and the QoS attributes and levels best suited to
achieve a BLA goal are outside the scope of this paper.
9
http://github.com/six2six/fixture-factory
Monitoring of Non-functional Requirements of Business Processes based on Quality of Service Attributes of Web Services
593
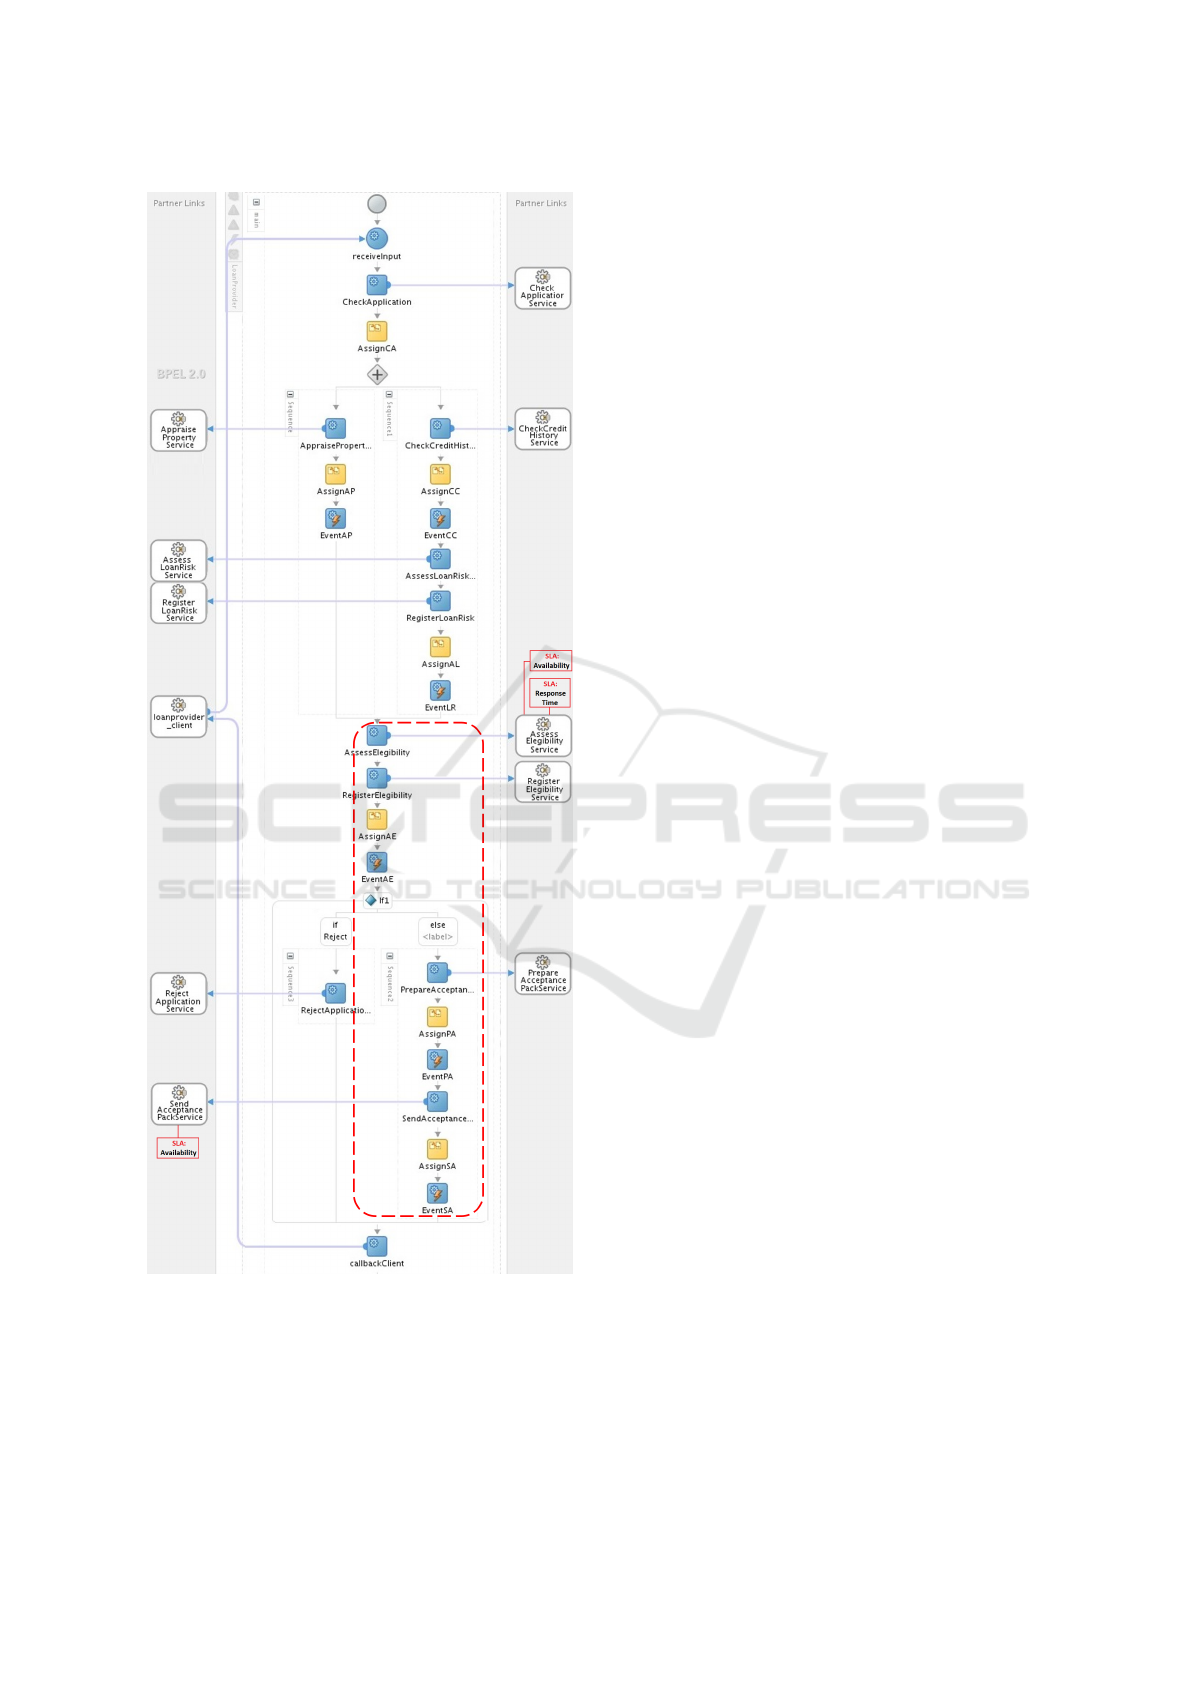
Figure 10: Executable version in WS-BPEL of the loan
business process (for validation of the proposed compo-
nent).
lem is not reflecting in the process is represented in
the instance #4, where there was an availability prob-
lem for the service Assess eligibility, but the sec-
ond attempt was successful. In addition, considering
also the second and successful attempt, the reply was
above the 60-second goal, albeit within the 6-second
tolerance. In despite of this, the activity ended up be-
ing executed in 64 seconds, i.e., below the expected of
66 seconds including the tolerance, even in the face of
an availability issue. Business managers may not be
interested if a service is experiencing availability is-
sues, but they may be interested if they find that this
problem is affecting their business, which was not the
situation in this instance execution. In addition, even
the two services showing poor availability rates, the
BLA is only on warning at the end of the first cycle of
10 instance executions, since the BLA has failed for
only one of these executions according to its settings.
For the second cycle of 10 instance executions, the
BLA evaluation deteriorates and is assessed below the
lower threshold. One of the reasons is that the SLA re-
sponse time behaved worse. However, this simulation
presents only a proof of concept of how NFR moni-
toring can be treated at two different and complemen-
tary levels, with insights that may interest managers
and teams of different areas and organizational levels.
The way the data is presented in this table sought to
present an overview of all the results of the simulation
in a grouped form, which makes it difficult to under-
stand. The emphasis is for a graphical tool to provide
specific views for each profile, following guidelines
for appropriate user experience.
The data in Figure 11 are not considering penalty
and bonus values (individual or accumulated). The
prototype still does not carry out them.
4 CONCLUSION
The objective of this paper was to present the StrAli-
BAM component, designed to allow the StrAli-BPM
framework monitoring process NFRs at both process
and service levels. The component proposed is split
into a monitoring architecture and an event-based in-
frastructure for execution and monitoring. While
most approaches focus exclusively on web service
monitoring and few others address business process
monitoring only in terms of KPIs, the component pre-
sented herein aims at integrated monitoring.
For future work, we plan to: to finish the develop-
ment of the indicator dashboard to view the data being
monitored in real-time; include support for monitor-
ing KPIs besides BLAs and SLAs; and conduct eval-
uations with scenarios closer to the actual settings in
organizations dealing with this type of scenario.
ICEIS 2019 - 21st International Conference on Enterprise Information Systems
594
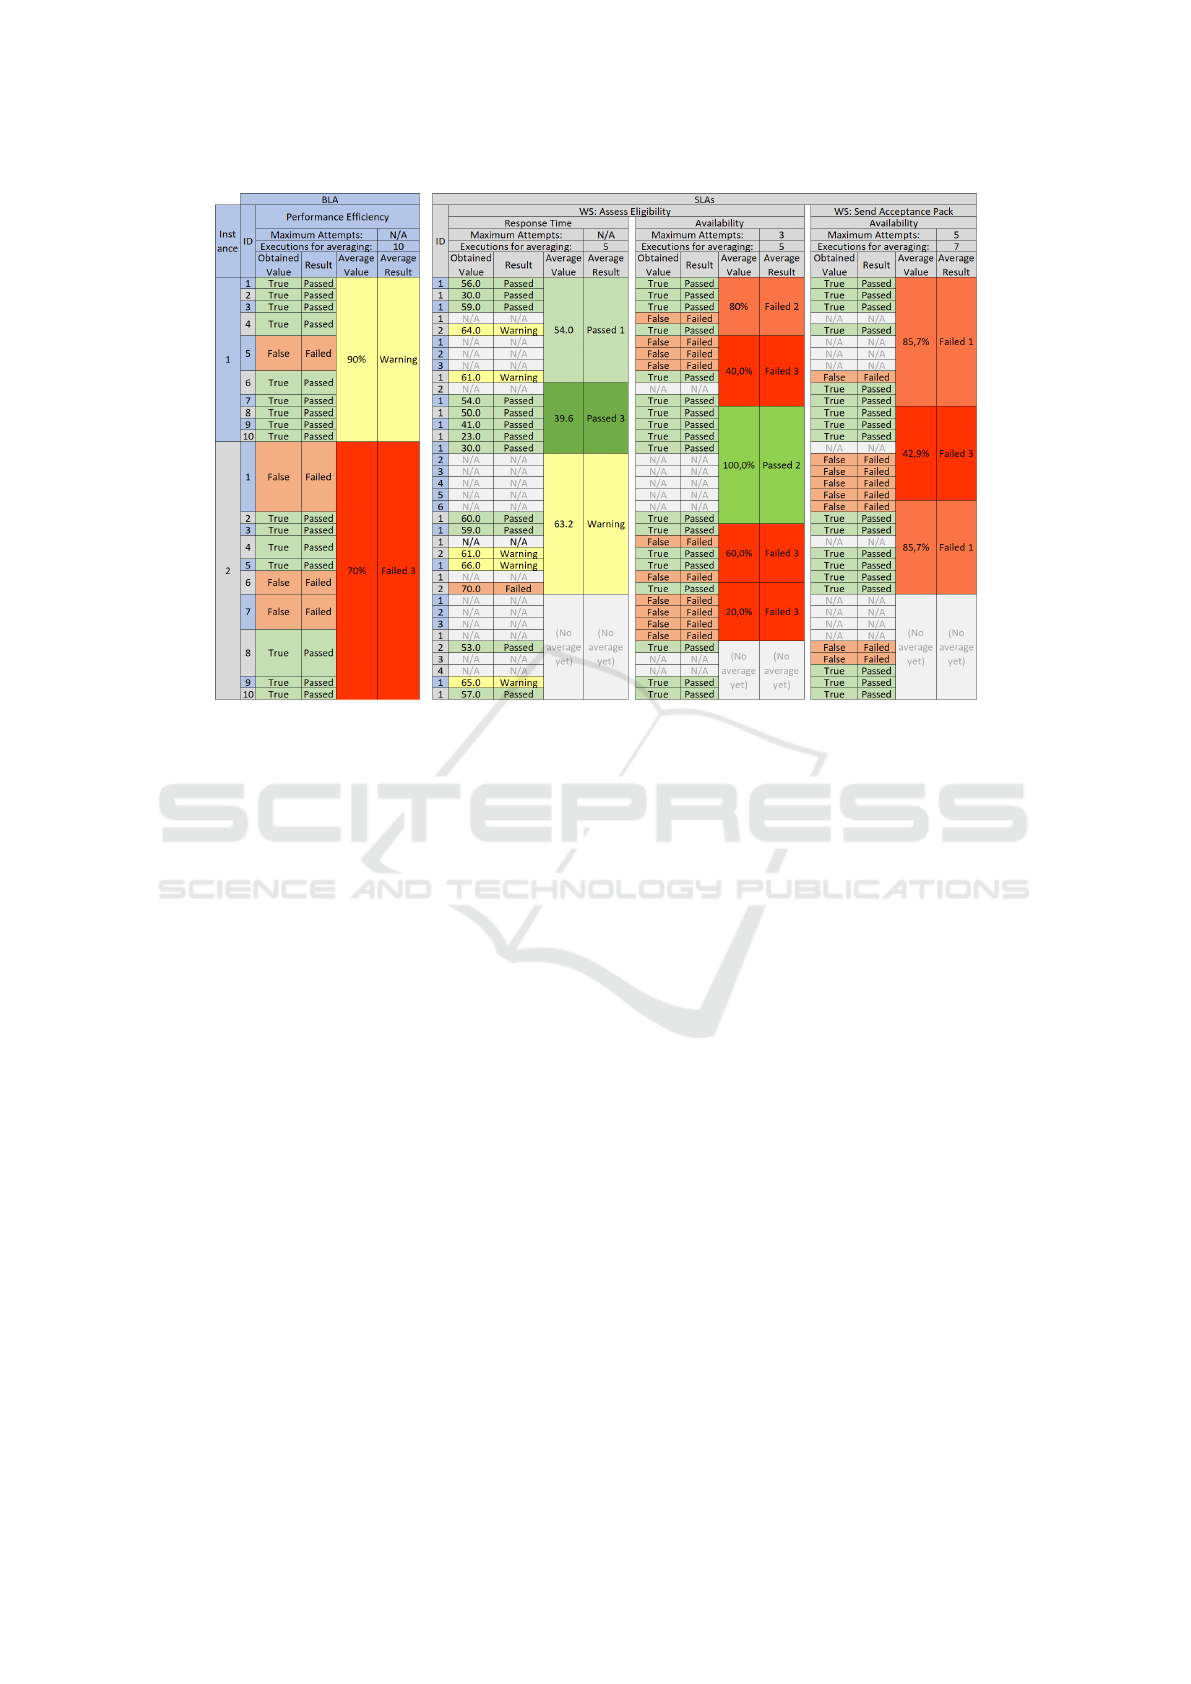
Figure 11: Monitoring simulation results.
ACKNOWLEDGEMENTS
This work was funded by Fapesp, Brazil
(grants 2017/26491-1 and 2017/26487-4, holder
Marcelo Fantinato) and Capes, Brazil (grants
88881.172071/2018-01, holder Lucin
´
eia H. Thom).
REFERENCES
Barros, V. A., Fantinato, M., Salles, G. M. B., and de Al-
buquerque, J. P. (2014). Deriving service level agree-
ments from business level agreements: An approach
towards strategic alignment in organizations. In 16th
Int. Conf. on Enter. Inf. Syst., pages 214–225.
Carmo, A., Fantinato, M., Thom, L., Prado, E. P. V.,
Sp
´
ınola, M., and Hung, P. C. K. (2017). An analy-
sis of strategic goals and non-functional requirements
in business process management. In 19th Int. Conf. on
Enter. Inf. Syst., pages 262–273.
Castro, C. F., Fantinato, M., Aksu, U., Reijers, H. A., and
Thom, L. H. (2019). Towards a conceptual framework
for decomposing non-functional requirements of busi-
ness process into quality of service attributes. In 21st
Int. Conf. on Enter. Inf. Syst.
Curbera, F., Duftler, M., Khalaf, R., Nagy, W., Mukhi, N.,
and Weerawarana, S. (2002). Unraveling the web ser-
vices web: An introduction to SOAP, WSDL, and
UDDI. Int. Comp., 6(2):86–93.
Dumas, M., La Rosa, M., Mendling, J., and Reijers, H. A.
(2018). Fundamentals of Business Process Manage-
ment. Springer, 2nd edition.
Erl, T. (2005). Service-Oriented Architecture – Concepts,
Technology, and Design. Prentice Hall.
Fahad, M., Moalla, N., and Ourzout, Y. (2015). Dynamic
execution of a business process via web service selec-
tion and orchestration. In Int. Conf. on Comp. Sci.,
pages 1655–1664.
Lubinski, T. (2008). Business activity monitoring: Pro-
cess control for the enterprise. SL Corporation, Corte
Madera, CA.
Presman, R. S. and Maxim, B. (2014). Software Engineer-
ing: A Practitioner’s Approach. McGraw-Hill Educa-
tion, 8th edition.
Salles, G. M. B., Fantinato, M., Barros, V. A., and de Al-
buquerque, J. P. (2018). Evaluation of the strali-bpm
approach: Strategic alignment with bpm using agree-
ments in different levels. Int. J. of Bus. Inf. Syst.,
27(4):433–465.
Salles, G. M. B., Fantinato, M., de Albuquerque, J. P., and
Nishijima, M. (2013). A contribution to organiza-
tional and operational strategic alignment: Incorpo-
rating business level agreements into business process
modeling. In Int. Conf. on Serv. Comp., pages 17–24.
Sheng, Q. Z., Qiao, X., Vasilakos, A. V., Szabo, C., Bourne,
S., and Xu, X. (2014). Web services composition: A
decade’s overview. Inf. Sci., 280:218–238.
TOG (2018). The archimate enterprise architecture mod-
eling language. http://www.opengroup.org/ subjectar-
eas/ enterprise/archimate-overview. The Open Group.
Monitoring of Non-functional Requirements of Business Processes based on Quality of Service Attributes of Web Services
595
