
Development of Agents for Creating Melodies and Investigation of
Interaction between the Agents
Hidefumi Ohmura
1
, Takuro Shibayama
2
, Keiji Hirata
3
and Satoshi Tojo
4
1
Department of Information Sciences, Tokyo University of Science, 2641 Yamazaki, Noda-shi, Chiba, Japan
2
Department of Information Systems and Design, Tokyo Denki University,
Ishizaka, Hatoyama-cho, Hikigun, Saitama, Japan
3
Department of Complex and Intelligent Systems, Future University Hakodate,
116-2, Kamedanakano-cho, Hakodate-shi, Hokkaido, Japan
4
Graduate School of Information Science, Japan Advanced Institute of Science and Technology,
1-1 Asahidai, Nomi-shi, Ishikawa, Japan
Keywords:
Music, Melody, Lattice Space.
Abstract:
In this study, we attempted to construct computational musical theory by creating musical structure using
physical features of sound without relying on the existing musical theory. Subsequently, we developed an
agent system to create melodies. The agents can select the next note (a sound timing and a pitch) depending
on the lattice spaces consisting of physical relationships (ratios) and probabilities. Further, we improve the
agents which are interacting with each other in the system, and the system outputs various sounds such as
music. We confirmed that the system could create structures of musical theory, such as mode, scale, and
rhythm. The advantages and disadvantages of the lattice spaces are discovered.
1 INTRODUCTION
Most human beings can hum and whistle melodies in
an improvisational way in their daily lives. This gen-
eration of melodies is considered a beneficial human
quality for surviving in society (Jordania, 2010). In-
terestingly, children can also hum melodies without
music education.
We considered how they create melodies and de-
veloped an agent system creating melodies (Ohmura
et al., 2018). The system can provide computational
musical structures such as musical scale and mode in
music theory because we adopted lattice spaces de-
pending on the physical relationships of sounds to the
system.
In this study, we aim to improve the agent sys-
tem including the three agents that interact with each
other. We herein detail the basic elements of the pre-
vious system in creating melodies, and demonstrate
the improved features. Subsequently, we discuss the
outputs from the system as the music is created by the
interactions between agents.
First, we propose a hypothesis on how humans
create melodies such as humming and whistling, and
demonstrate the physical features of sounds underly-
ing the hypothesis. Next, we show the agent system
creating melodies, and how agents interact with each
other. Subsequently, we describe the system with
agents and the operation of the system. Finally, we
discuss music as the output of the system.
2 MUSICAL FEATURES
2.1 Hypothesis of Creating Melodies
It is typical for a musically educated person to eas-
ily select the next pitch and next sound timing of ap-
propriateness of a present note. However, the ques-
tion arises as to why both adults and children with-
out musical education can hum or whistle melodies.
We generate the following hypothesis regarding the
selection of the next note except in the case of recol-
lecting a melody. “They select purely a note of physi-
cal proximity to the present note.” Physical proximity
includes two elements. The first element is the rela-
tionship between the sound timings of notes. The sec-
ond element is the relationship between the pitches of
notes. We considered how they create the melodies
and developed an agent system creating melodies
Ohmura, H., Shibayama, T., Hirata, K. and Tojo, S.
Development of Agents for Creating Melodies and Investigation of Interaction between the Agents.
DOI: 10.5220/0007702303070314
In Proceedings of the 11th International Conference on Agents and Artificial Intelligence (ICAART 2019), pages 307-314
ISBN: 978-989-758-350-6
Copyright
c
2019 by SCITEPRESS – Science and Technology Publications, Lda. All rights reserved
307
based on the hypothesis(Ohmura et al., 2018). In this
section, we explain their relationships and detail the
theories of musical expectation to demonstrate how
an agent selects a note.
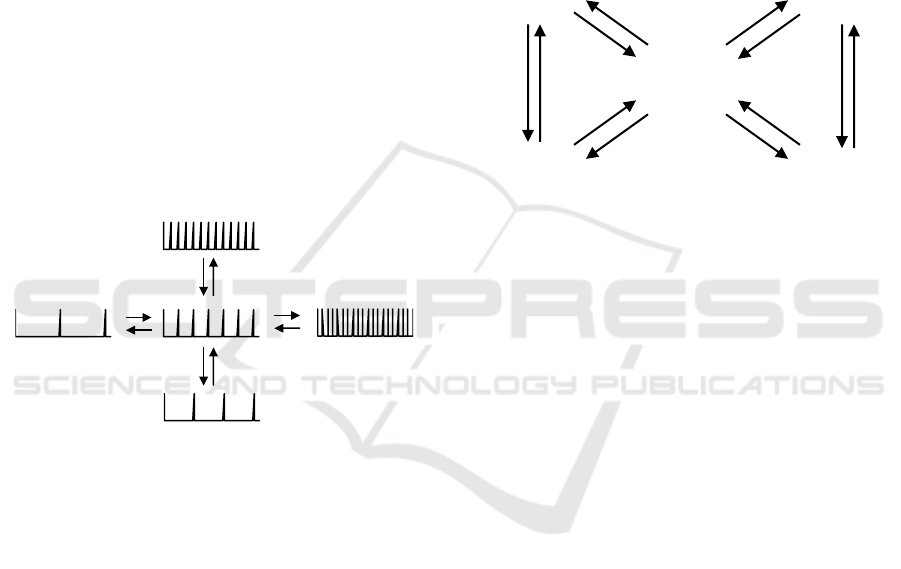
2.2 Relationships between Pulses (Note
Values)
In music, an iteration is an important primitive pat-
tern, and a pulse is the most primitive element in a
rhythm.
For example, when a listener hears two pulses
(whose relationship is 1:2), he/she may feel a duple
meter (see Figure 1). When a relationship is 1:3, a
listener may perceive a triple meter.
Next, we consider 2:3 and 3:2 ratios combining
duple and triple meters. These relationships provide
the listener with a polyrhythm. A listener perceives
one basic pulse as an upbeat, and another as a down-
beat. In the cases of 3:4 and 4:3, a listener perceives a
polyrhythm consisting of triple and quadruple meters.
× 1/2
× 2
× 1/2
× 2
× 1/3
× 3
× 1/3
× 3
Figure 1: Relationships between pulses (note values).
Actual music consists of many pulses. A listener per-
ceives the strongest or most-frequent pulse as the me-
ter of the music, and less-frequent pulses as weak
beats and up beats. Monophony, however, lacks beats,
such that a listener at times may not perceive any me-
ter. This is true in the melodies of humming.
2.3 Relationships between Pitches
(Intervals)
In music, patterns consisting of pitches are important.
These patterns are explained in musical theories of
temperament (how to determine the frequency of each
note) and mode (which notes to use). The value of
a pitch depends on the vibrational frequency of air.
Real sound consists of multiple frequencies, and we
perceive the lowest frequency as the pitch, also called
as the fundamental frequency. As with rhythm, the
patterns of two pitches are called musical intervals,
and are defined by the relationship between the fre-
quencies.
A relationship of 1:2 creates an interval of a per-
fect octave, and a relationship of 1:3 creates an inter-
val of a perfect fifteenth, which is two octaves. The
relationship of 2:3 and 3:2 are combined duple and
triple frequencies (see Figure 2). This pattern is called
a perfect fifth. The relationships of 3:4 and 4:3 are
combined triple and quadruple (see Figure 2). This
pattern is called a perfect fourth, which is a consonant
interval following a perfect fifth.
880Hz
(A5)
990Hz
(B5)
660Hz
(E5)
440Hz
(A4)
495Hz
(B4)
! 3/2
! 2/3
! 3/4
! 4/3
! 3/4
! 4/3
! 2/3
! 3/2
! 2
! 1/2 ! 2
! 1/2
Figure 2: Relationships between pitch (intervals).
The Pythagorean scale (and principle of the Sanfen
Sunyi) involve only the relationships of duples and
triples. However, depending on temperament, some
intervals are imprecise.
In the case of intervals, a quintuple is important.
In particular, in a relationship between three pitches, a
3:4:5 creates a consonance code, called a major triad.
A relationship consisting of a double, triple, and quin-
tuple creates intonation. In this study, however, we
employ only the double and triple for a simple and
easy operation.
2.4 Theories of Musical Expectation
We attempted to control the musical expectations
based on the theories of musical expectations
(Ohmura et al., 2016). Here, we introduce these theo-
ries that provide how an agent selects the next note.
Meyer demonstrated that the deviations in ex-
pectations arouse emotions when listening to music
(Meyer, 1956). This concept is based on Dewey’s
theory, according to which conflict causes emotions
(Dewey, 1894). The deviation from the listeners’ ex-
pectation when listening to music arises from a par-
tial or complete disregard of rules that were accepted
in advance. This indicates an increase in contingency
because of augmented uncertainties. These uncertain-
ties present a commonality with complexity in the
optimal complexity model (Berlyne, 1971) that illus-
trates the relationship between complexity and hedo-
HAMT 2019 - Special Session on Human-centric Applications of Multi-agent Technologies
308
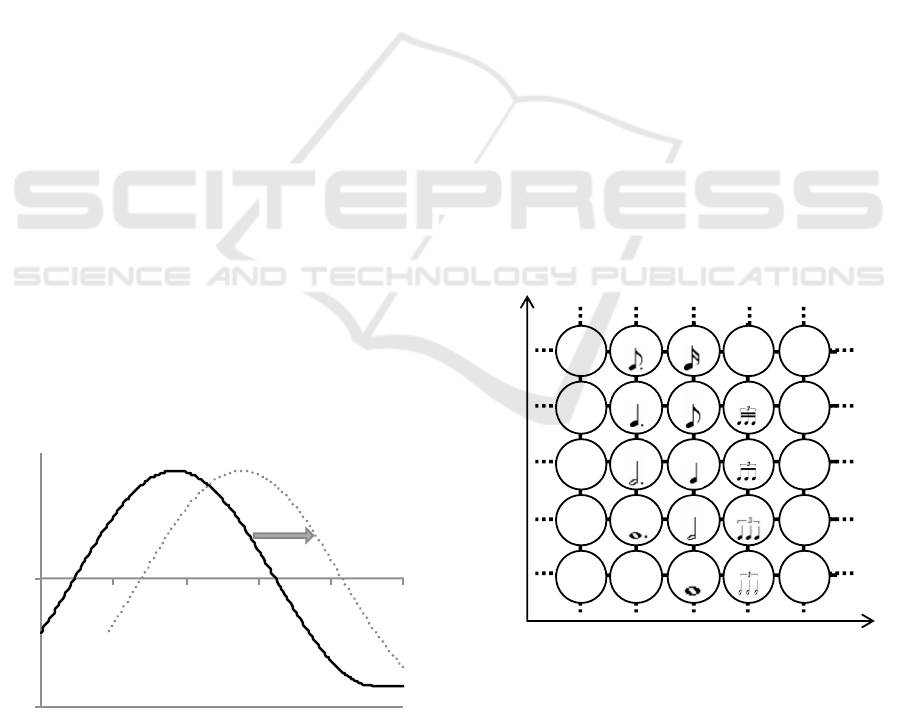
nic values (Figure 3). This commonality suggests the
existence of a relationship between uncertainty and
emotion. Comparing sounds in our everyday life and
their relationships reveals interesting viewpoints. We
shall survey the points in Figure 3. At Position
1
, the
complexity is relatively low. A listener can easily pre-
dict the features of the sound, and a prediction event
is likely to arise in the proposed system. For example,
the pure tick-tock beat of a clock not only sounds bor-
ing, but also causes displeasure in listeners. Indeed,
some clock users cannot sleep with this sound. Po-
sition
2
has a higher complexity than Position
1
,
thus eliciting pleasure in the listener. The listener
can predict the next sound, and recognize both real-
izations and deviations from expectation at that posi-
tion. Listeners may regard sounds as musical, because
the sounds comprise rules as well as deviations from
the rules at this position. Different levels of complex-
ity exist in each musical genre. Rhythms, children’s
songs, and folk songs have lower complexities than
pop music, for example. Therefore, a wide range of
sounds are under this position. Position
3
exhibits an
appreciably high complexity. In this case, a listener
cannot predict the next sound and can only recognize
deviations from expectations. Free jazz and contem-
porary music are comparatively new genres that can
be considered in this context. These styles of mu-
sic are unpleasant for some listeners. Non-musical
sounds such as the noise from a crowd at a sports field
may belong to Position
3
. According to Berlyne, the
relationship between complexity and emotion adapts
to the listener’s experiences (the dotted line in Figure
3). That is, music at Position
3
elicits the pleasure of
highly experienced listeners. They may feel displea-
sure from the music at Position
2
. A listener who has
experienced a large amount of music may discover the
complexity in music.
Hedonic value!
Complexity!
!"
#"
$"
Experience!
Figure 3: Optimal complexity model (modified from
(Berlyne, 1971)). When a listener is musically experienced,
his or her function moves to more/less complex.
As we regard complexities as uncertainty, we can cal-
culate the next note with probability density func-
tions. In the next section, we describe how the agent
selects the next note with probability density func-
tions.
3 AN AGENT CREATING
MELODIES
To create a melody, the proposed agent selects a sound
timing, and subsequently selects a pitch. These ac-
tions are based on the relationships as shown in 2.2
and 2.3. The selections depend on the probabilities
that are built on the theory of musical expectation. In
this section, we introduce the theory of musical ex-
pectation, and explain an agent-creating melody.
3.1 Lattice Spaces with Duple and
Triple Relationships
We provide a lattice space for rhythm that consists of
ratios of 1:2 and 1:3 (see Figure 4). The unit in this
lattice space is beats per minute (bpm). In this fig-
ure, 72 bpm is the basic frequency of the pulse, which
is located in the middle of the figure. The x-axis in-
dicates triple relationships, and the y-axis duple rela-
tionships. Each point of intersection is the frequency
of a pulse. In this figure, symbols of musical notes are
depicted; a quarter note is 72 bpm.
! 3
! 2
96bpm 288bpm32bpm 864bpm 2592bpm
48bpm16bpm 432bpm 1296bpm144bpm
24bpm8bpm 216bpm 648bpm72bpm
12bpm 36bpm4bpm 108bpm 324bpm
6bpm 18bpm2bpm 54bpm 162pm
Figure 4: Lattice space for musical values with duple and
triple relationships.
Next, we provide a lattice space for intervals that con-
sists of ratios of 1:2 and 1:3 (see Figure 5). The x-
axis indicates triple relationships, and the y-axis du-
ple relationships. Each point of intersection is the
Development of Agents for Creating Melodies and Investigation of Interaction between the Agents
309

frequency of a note. In this figure, 440 Hz is a ba-
sic frequency that is located in the middle of the fig-
ure. Each frequency value is rounded. Although each
point of intersection indicates a letter notation with
a frequency, the farther the point from the base fre-
quency (in this case 440 Hz), the larger is the error
based on the Pythagorean comma.
× 3!
× 2!
32.6Hz!
C1
97.8Hz!
G2
880Hz!
A5
2640Hz!
E7
7920Hz!
B8
521.1Hz!
C5
1564.4Hz!
G6
130.4Hz!
C3
391.1Hz!
G4
3520Hz!
A7
65.2Hz!
C2
195.6Hz!
G3
1760Hz!
A6
5280Hz!
E8
16.3Hz!
C0
48.9Hz!
G1
440Hz!
A4
1320Hz!
E6
3960Hz!
B7
24.4!
G0
220Hz!
A3
660Hz!
E5
1980Hz!
B6
5940Hz!
G"8
110Hz!
A2
330Hz!
E4
990Hz!
B5
2970Hz!
G"7
55Hz!
A1
165Hz!
E3
495Hz!
B4
1485Hz!
G"6
22.5Hz!
A0
82.5Hz!
E2
247.5!
B3
742.5Hz!
G"5
41.3Hz!
E1
123.8!
B2
371.3Hz!
G"4
260.7Hz!
C4
782.2Hz!
G5
7040Hz!
A8
293.3Hz!
D4
4693.3Hz!
D8
1173.3Hz!
D6
586.7Hz!
D5
146.7Hz!
D3
73.3Hz!
D2
36.7Hz!
D1
2346.7Hz!
D7
18.3Hz!
D0
Figure 5: Lattice space for pitches with duple and triple
relationships.
In the lattice space of Figure 5, the distance between
one frequency and another of close value is long.
Thus, the lattice space of Figure 5 is slanted as in Fig-
ure 6. This will be useful in setting the parameters.
Unfortunately, in the spaces of x-axis (×9/8) and
y-axis (×2), each note does not intersect at right an-
gles. Therefore, we create a space of x-axis (×3/2)
and y-axis (×4/3) as shown in Figure 7).
3.2 Probability Density Functions
The proposed agent uses the probabilities at points
of intersection using a probability density function.
In this study, we employ a two-dimensional Gaus-
sian function for the probability density function. The
function is represented as follows:
×9/8!
× 2!
880Hz!
A5
3520Hz!
A7
1760Hz!
A6
440Hz!
A4
220Hz!
A3
110Hz!
A2
55Hz!
A1
22.5Hz!
A0
2640Hz!
E7
5280Hz!
E8
1320Hz!
E6
660Hz!
E5
330Hz!
E4
165Hz!
E3
82.5Hz!
E2
41.3Hz!
E1
7920Hz!
B8
3960Hz!
B7
1980Hz!
B6
990Hz!
B5
495Hz!
B4
247.5Hz!
B3
123.8Hz!
B2
5940Hz!
G"8
2970Hz!
G"7
1485Hz!
G"6
742.5Hz!
G"5
371.3Hz!
G"4
32.6Hz!
C1
521.1Hz!
C5
130.4Hz!
C3
65.2Hz!
C2
16.3Hz!
C0
260.7Hz!
C4
97.8Hz!
G2
1564.4Hz!
G6
391.1Hz!
G4
195.6Hz!
G3
48.9Hz!
G1
24.4Hz!
G0
782.2Hz!
G5
7040Hz!
A8
293.3Hz!
D4
4693.3Hz!
D8
1173.3Hz!
D6
586.7Hz!
D5
146.7Hz!
D3
73.3Hz!
D2
36.7Hz!
D1
2346.7Hz!
D7
18.3Hz!
D0
1043.0Hz!
C6
2085.9Hz!
C7
4171.9Hz!
C8
3128.9Hz!
G7
6257.8Hz!
G8
260.7Hz!
B1
20.6Hz!
E1
260.7Hz!
B0
185.6Hz!
G"3
92.8Hz!
G"2
46.4Hz!
G"1
23.2Hz!
G"0
× 4/3
! × 3/2!
Figure 6: Lattice space of slanted Figure 5.
× 3/2!
× 4/3!
4693.3Hz!
D8
2085.9Hz!
C7
3128.9Hz!
G7
1390.6Hz!
F6
927.1Hz!
B"6
618.1Hz!
E"5
412Hz!
A"5
586.7Hz!
D5
1043Hz!
C6
782.2Hz!
G5
440Hz!
A4
660Hz!
E5
330Hz!
E4
247.5Hz!
B3
185.6Hz!
G"3
1113.8Hz!
D"6
173.8Hz!
F3
880Hz!
A5
3520Hz!
A7
1760Hz!
A6
220Hz!
A3
110Hz!
A2
55Hz!
A1
2640Hz!
E7
1320Hz!
E6
165Hz!
E3
82.5Hz!
E2
41.3Hz!
E1
1980Hz!
B6
990Hz!
B5
495Hz!
B4
123.8Hz!
B2
1485Hz!
G"6
742.5Hz!
G"5
371.3Hz!
G"4
521.1Hz!
C5
130.4Hz!
C3
260.7Hz!
C4
97.8Hz!
G2
1564.4Hz!
G6
391.1Hz!
G4
195.6Hz!
G3
293.3Hz!
D4
1173.3Hz!
D6
146.7Hz!
D3
73.3Hz!
D2
2346.7Hz!
D7
260.7Hz!
B1
92.8Hz!
G"2
556.9Hz!
D"5
278.4Hz!
D"4
139.2Hz!
D"3
835.3Hz!
A"5
417.7Hz!
A"4
208.8Hz!
A"3
626.5Hz!
E"5
313.2Hz!
E"4
469.9Hz!
B"4
347.7Hz!
F4
695.3Hz!
F5
463.5Hz!
B"5
231.8Hz!
B"4
309Hz!
E"4
Figure 7: Lattice space of rotated Figure 6.
f (x,y) =
1
2πσ
x
σ
y
p
1 − ρ
2
× exp
−
1
2(1 − ρ
2
)
(x − µ
x
)
2
σ
2
x
− 2ρ
(x − µ
x
)(y − µ
y
)
σ
x
σ
y
+
(y − µ
y
)
2
σ
2
y
!
HAMT 2019 - Special Session on Human-centric Applications of Multi-agent Technologies
310

This equation describes a two-dimensional normal
distribution with mean µ and variance σ
2
in each axis.
ρ means the coefficient of correlation between values
on the x- and y-axis. Assigning values to x and y, the
probabilities are calculated from µ
x
, µ
y
, σ
x
, σ
y
, and ρ.
Adjusting σ, the shape of the function changes as
shown in Figure 8.
probability!
× 3 (× 3/2)
!
× 2 (× 4/3)
!
probability!
× 3 (× 3/2)
!
× 2 (× 4/3)
!
Increasing σ
!
Figure 8: Shapes of the function depening on σ.
In the lattice space of pitch, when we apply a mix-
ture distribution to a probability density function, the
model expresses musical modes such as major and
minor (Ohmura et al., 2016).
The agent selects a pulse based on the probabili-
ties of the lattice space for the musical values at each
step. When the selecting pulse is the timing of sound,
the agent selects a pitch based on the probabilities of
the lattice space for pitches. The default cycle of steps
is 25 ms, which is the pulse of the least frequency in
the lattice space for musical values.
3.3 Features of Multiagent System
The agents have functions of the lattice space for mu-
sical values and the lattice space of the pitch. When
multiple agents exist on each lattice space, we con-
sider two modes: (i) they use a common function, and
(ii) they use an independent function. The system pro-
vides each mode.
In the independence mode of the system, each
agents Gaussian functions are probability density
functions. The relationships between the agents are
calculated from the parameters of the functions on
each lattice space. The relationship rules are deter-
mined by calculating the values. The changing pa-
rameters based on the rules can provide the interac-
tions between agents. Herein, we define the distances
and degrees between the average (µ) as the relation-
ships between agents. We rotate the functions coun-
terclockwise about µ of the primary function of the
first melody line. We regard the transformations of
the outputs as interactions between agents.
When the agents follow the hypothesis faithfully,
selecting purely a physically proximate note to the
present note, the system must update the methods of
their functions with the present note. The system pro-
vides that as the following mode.
4 IMPLEMENTATION
We implemented the proposed agent using HTML
and JavaScript for a music generation system
1
. We
confirmed the operation of the system in the lat-
est version of Google Chrome. An agent creates a
melody line. The system outputs up to three melody
lines because the system includes three agents. Users
can control various settings including the parameters
of the probability density functions for pitches and
rhythm.
The system contains the lattice space for pitches
such as those shown in Figure 7, and the lattice space
for musical values such as those in Figure 4.
These lattice spaces contain probability density
functions. The controllable parameters of the func-
tions are the mean (µ
x
, µ
y
), variance (σ
x
, σ
y
), and cor-
relation (ρ). Furthermore, users can also control the
parameters of the subfunctions. The parameters of a
subfunction includes a weight (w), which is the ra-
tio of a subfunction to a primary function. When the
weight (w) is 0, the subfunction is ignored. When the
independent flag is true, users can control the param-
eters of three functions on each lattice space. Mean-
while, if it is false, users can control the parameters of
a function because the agents use a common function
on each lattice space.
When the following flag is true, it implies that the
functions of the lattice space of the pitch is to be up-
dated. We did not implement this workings in the lat-
tice space of value because the mean is converged on
the high-frequency pulses.
When the rotation flag for each lattice space is
true, each µ is rotated any given degree counter-
clockwise about µ of the primary function of the first
melody line.
We explain the flow of execution through the pro-
gram. When users push a play button, the program
executes iterative processing as follows:
1. Select a pulse from the lattice of value notes ac-
cording to the probability density function.
2. Is the timing of the pulse hitting a note?
yes: Select a pitch from the lattice of pitches ac-
cording to the probability density function and
output it.
no: Do nothing.
3. Is it the step of rotation?
yes: Rotate each µ on any given degree counter-
clockwise about µ of the primary function of
the first melody line.
1
https://sites.google.com/site/hidefumiohmura/home/
program/icaart2019
Development of Agents for Creating Melodies and Investigation of Interaction between the Agents
311
no: Do nothing.
4. Is the following flag true?
yes: Update µ of the lattice space of the pitch with
the position of the present note.
no: Do nothing.
5. Go to 1 as the next step
The iterative processing executes at intervals ac-
cording to the tempo whose initial value is 2592 bpm.
4.1 System Operating Instructions
The operation screen consists of four panels: sound
control panel, rotation control, pitch control panel,
and note value control panel. Herein, we provide a
step-by-step explanation on their usage.
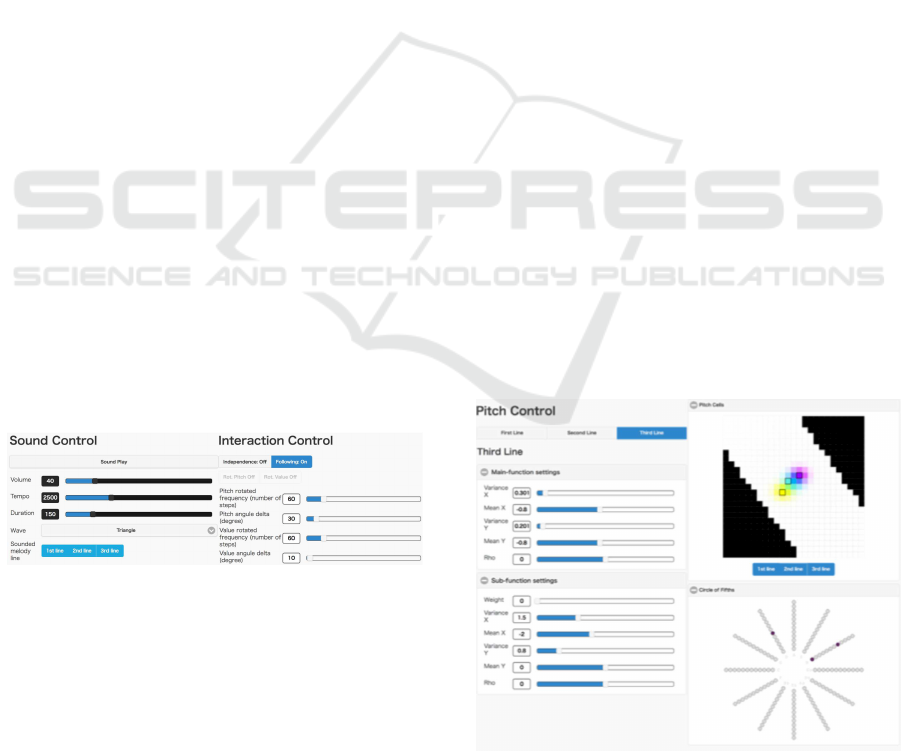
4.1.1 Sound Control Panel
At [sound control] (Figure 9), users can control the
play/stop, volume, tempo, duration, waveform, and
melody lines of the outputs. The header of the op-
eration screen includes a play/stop button. The val-
ues of volume, tempo, and duration are controlled
by the sliders. The tempo value indicates the pro-
gram cycle time in bpm. The duration value is the
length of time of each note. By controlling this value,
melodies show articulations as staccato and tenuto.
With the waveform selector, users can select from
“sin,” “square,” “sawtooth,” and “triangle.” moreover,
users can select “bongo” and “piano” as actual sound
source samples. Although each pitch is calculated by
a duple and triple, the pitches of the bongo and pi-
ano are defined by 12 equal temperaments. Moreover,
the [sound control] includes a preset selector that pro-
vides each setting for discussion.
Figure 9: Sound control panel and interaction control panel.
4.1.2 Interaction Control Panel
At the [interaction control panel] (Figure 9), when
users change over to the independence mode, fol-
lowing mode, and rotation states with the indepen-
dence button, following button, Rot.Pitch button, and
Rot.Value button. The header of the operation screen
also includes the Rot.Pitch button and Rot.Value but-
ton. Users can set the interaction parameters between
agents. Users can control the value of a rotated circle
(number of steps) for a pitch with a slider. Each func-
tion of the lattice space for pitch rotates every value.
Users can control the value of angular delta (degree)
for pitch with a slider. The value is limited from 0
to 360. The direction of positive rotation is counter-
clockwise. The value of 180 means an opposite side.
Similarly, users can control the parameters of the lat-
tice space for musical values with sliders.
4.1.3 Pitch Control Panel
At [pitch control] (Figure 10), users can control the
parameters of each probability density function for
pitches of melody lines using sliders. Each value of
the probability density function is shown in the up-
per right [pitch cells]. The values of the melody lines
are shown in different colors: The first line is cyan,
the second line is magenta, and the third line is yel-
low. A darker colour indicates a higher value. Cells
representing less than 20 Hz and greater than 22050
Hz are blacked out because the system cannot out-
put these pitches. The initial values of the means are
set to 440 Hz (A). Using buttons at the bottom in the
[pitch cells], each probability density function is set
as visible or invisible. The operations of the melody
lines are independent. Using the upper left buttons,
the users select an operating melody line. The param-
eters of the primary function are controlled by sliders
at the [Main-function Settings]. The parameters of the
subfunction are controlled by the sliders at the [sub-
function settings]. During system execution, the se-
lected pitches are shown at the bottom right [circle of
fifth]. Therefore, users can confirm the output pitches
in real time.
Figure 10: Pitch control panel.
HAMT 2019 - Special Session on Human-centric Applications of Multi-agent Technologies
312
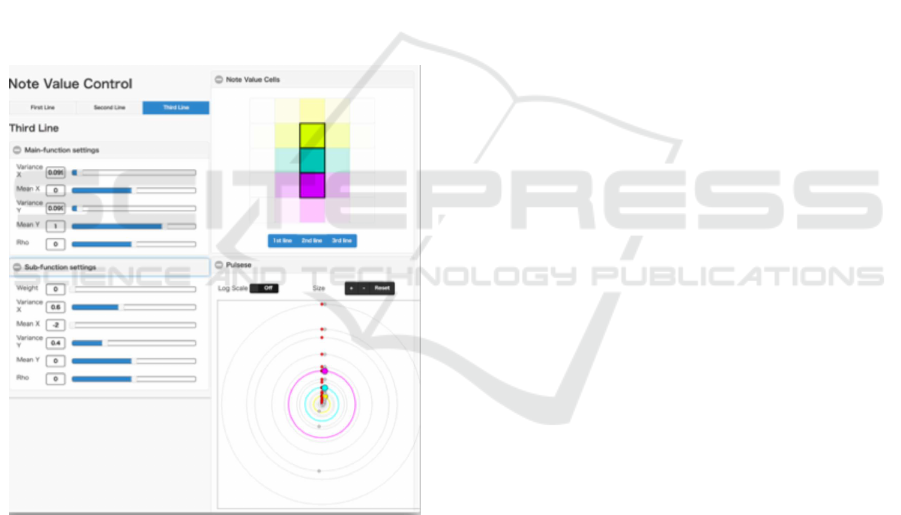
4.1.4 Note Value Control Panel
At [note value control] (Figure 11), users can con-
trol the parameters of each probability density func-
tion for the note values of the melody lines using slid-
ers. Each value of the probability density function
is shown in the upper right [note value cells]. As is
the case with [pitch control], the values of the melody
lines are shown in different colours: the first line is
cyan, the second line is magenta, and the third line
is yellow. A darker colour indicates a higher value.
Using the buttons at the bottom in the [note value
cells], each probability density function is set as vis-
ible or invisible. The operations of the melody lines
are independent, as in the case with [pitch control].
During system execution, the selected note values are
shown at the bottom right [pulses]. Therefore, users
can confirm the output pulses of the note values in
real time. The pulses can be zoomed using buttons
and displayed on a log scale using a toggle button.
Figure 11: Note value control panel.
5 DISCUSSION
We prepared the example settings of the parameters
as presets and discuss them herein.
As for the hypothesis, when lower values of σ
exist comparatively, the outputs resemble humming
melodies. [Humming (a melody line)] provides only
one melody line such as a humming melody. Further,
[humming (three melody lines)] provides music with
three humming melody lines. The variances of the
function in the lattice space of the pitches are com-
paratively low values, and the means are set near A.
Depending on the settings, the system outputs A, E,
D, B, and G frequently.
The output sounds include melodies of the pen-
tatonic scale, which are used in the folk songs of
Scotland, East Asia, and other areas. The rhythms
of [humming (a melody line)] resemble duples or
quadruples. The rhythms of [humming (three melody
lines)] resemble music in six-eight time.
Using ρ, users can obtain the various shapes of the
function. For example, when ρ is set as 0.5 in the lat-
tice of the pitches, dispersion occurs from the lower
right to upper left. If a user can control ρ freely, the
system does not require transformation from Figure 5
to Figure 6 or 7. However, Figure 6 and 7 are bet-
ter because users can control the important relation-
ships between notes such as a perfect fifth and a per-
fect fourth. In this system, as shown in Figure 7, it is
easy to calculate next note because of the intersection
at right angles. However, the controlling parameters
in Figure 7 are more difficult than those in Figure 6
because we are accustomed to using the relationships
of 1:2.
The previous presets used only the primary func-
tion in the lattice space of the pitch. Therefore,
the outputs sound like melodies of the Dorian mode.
Herein, we discuss the presets using two functions in
the lattice space of the pitch. In the [positive mode],
the variance in the primary function is a compara-
tively low value, and the variance in the subfunction
is higher than that of the primary function. Moreover,
the mean of the subfunction moves to the bottom right
from the mean of the primary function. The outputs
sound like melodies of the Ionian or Lydian mode.
Meanwhile, in the [negative mode], the mean of the
subfunction is set opposite to the values of the [pos-
itive mode]. The other parameters of the [negative
mode] are the same as those of the [positive mode].
The outputs sound like melodies of the Aeolian or
Phrygian mode.
The previous two presets are symmetrical. [Ro-
tated sample1] provides the sounds of positive modes
and negative modes, alternately using half-turns. In
music theory, the transformation is called relative
keys. [Rotated sample2] provides some effects of ro-
tated angles. Initially, the subfunctions are set at the
lower left of the primary function. The angular vari-
ation is 45 degrees In the lattice space of the pitches,
a relationship to a right cell means an upper perfect
fifth, a relationship to a left cell means a lower per-
fect fourth, a relationship to an upper cell means an
upper perfect fourth, and a relationship to a lower cell
means a lower perfect fifth. That is, a direction to the
Development of Agents for Creating Melodies and Investigation of Interaction between the Agents
313

lower right provides positive modes, and a direction
to the upper left provides negative modes. Directions
to the upper right and lower left provide octaves.
[Okinawa ¡=¿ Miyako-bushi] provides sounds
such as Okinawa (Ryukyuan) music and Japanese tra-
ditional music alternately. Interestingly, they are sym-
metric about the mean of the primary function.
[Following a line] provides only one melody line
such as a humming melody. [Following three lines]
provides music with three humming melody lines.
When the system activates for a long time, these out-
puts sound like transposes increasingly. However,
these transposes are slightly exponential because the
updates of means depend only on the present note.
The updates may need to bypass more sounded notes.
As can be heard from the presets, the system out-
puts not only simple melodies (such as humming and
whistling), but also melodies with musical elements
such as scale, mode, rhythm, and metrical structure.
These outputs reveal that the musical mode and scale
are not discrete but continuous, and that rhythm struc-
tures without sequences exist such as musical scores.
Moreover, some of them are symmetrical.
6 CONCLUSION
In this study, we demonstrated an agent system to
generate three melodies that were based on the rela-
tionships between the physical features of notes. Fur-
ther, we proposed the interactions between agents.
We confirmed that the system could create structures
of musical theories, such as mode, scale, and rhythm.
We discovered the advantages and disadvantages of
the lattice spaces. As future work, we will investigate
more interaction patterns between agents, and update
the lattice spaces.
ACKNOWLEDGEMENTS
This work was supported by JSPS KAKENHI Grant
Numbers JP17K12808 and JP16H01744.
REFERENCES
Berlyne, D. E. (1971). Aesthetics and psychobiology. Ap-
pleton Century Crofts.
Dewey, J. (1894). The theory of emotion: I: Emotional atti-
tude. Psychological Review, 1(6):553–569.
Jordania, J. (2010). Music and emotions: humming in hu-
man prehistory. Proceedings of the International Sym-
posium on Traditional Polyphony (Tbilisi), pages 41–
49.
Meyer, L. B. (1956). Emotion and meaning in music. Uni-
versity of Chicago Press.
Ohmura, H., Shibayama, T., and Hamano, T. (2016). Gener-
ative music system with quantitative controllers based
on expectation for pitch and rhythm structure. Pro-
ceeding of The Eighth International Conference on
Knowledge and Systems Engineering (KSE2016).
Ohmura, H., Shibayama, T., Hirata, K., and Tojo, S. (2018).
Music generation system based on a human instinc-
tive creativity. Proceedings of Computer Simulation
of Musical Creativity (CSMC2018).
HAMT 2019 - Special Session on Human-centric Applications of Multi-agent Technologies
314
