
A Real-time Big Data Framework for Network Security
Situation Monitoring
Guanyao Du, Chun Long, Jianjun Yu, Wei Wan, Jing Zhao and Jinxia Wei
Computer Network Information Center, Chinese Academy of Sciences, 4 Zhongguancun Nansijie,
Haidian District Beijing 100190, China
Keywords: Network Security Situation Monitoring, Big Data, Real Time Computation, Visualization.
Abstract: In this paper, we provide a real-time calculation and visualization framework for network security situation
monitoring based on big data technology, and it mainly realizes the real-time massive multi-dimensional
network attack dynamic display with Data-Driven Documents (D3). Firstly, we propose an integration and
storage management mechanism of massive heterogeneous multi-source data for the network security data
fusion. Then, we provide a general real time data computation and visualization framework for massive
network security data. Based on the framework, we use the real security data of the network security cloud
service platform of Chinese Academy of Sciences (CAS) to realize the visualization monitoring of network
security dynamic attacks nationwide and worldwide, respectively. Experiment results are given to analyze the
performance of our proposed framework on the efficiency of the data integration and computation stages.
1 INTRODUCTION
With the increase of the amount of network security
devices, the collected network traffic is also growing,
and the requirement of the network security situation
monitoring is becoming much higher. Although the
extensive security systems, devices and platforms
deployed in the network are able to provide a large
number of data which can be used to analyze the
network security situation, these data are usually
widely distributed, heterogeneous, and in large
volume (Álvarez et al., 2018). This brings great
challenges to monitor the network security situation
in real time, accurately and steadily.
How to calculate and analyze the massive network
security data from the tremendous amount of real-
time heterogeneous data sources efficiently, so as to
monitor the real-time network security situation,
becomes a critical technical problem. Network
security situation monitoring aims to intuitively
reflect the network security situation, help the
administrators forecast the trend of the network
security situation, send warnings and take
corresponding measures (Huffer et al., 2017).
To monitor the network security situation, it
requires effective integration of heterogeneous multi-
source security data and efficient calculation
capability of big data technology. There are three key
issues that need to be addressed:
Firstly, how to converge and store mass
heterogeneous network security data in real time from
multiple sources. As the real-time network security
information can be obtained from widely distributed
security equipment, e.g. the intrusion prevention
system (IPS), firewalls, mail protection system, and
so on. The security information is a typical “Big Data”
which is in high-volume and in great variety. So, it is
important to use distributed real-time data collection
tools to realize the access of heterogeneous multi-
source data, and the unified format pre-processing on
different kinds of the integrated data. Besides, the
real-time data cache and the distributed storage
system are also needed to manage the historical data
classification storage.
Secondly, how to realize the real time
computation effectively for the real-time network
security data. As the security information is in high-
volume and in great variety, it is necessary to design
a real-time data distributed computer system to
execute the real time extraction and the classified
storage for the unified formatting pre-processed data
from different sources.
Thirdly, how to realize the real time data driven
visualization for the real-time network security data.
In the field of network security monitoring, it will
Du, G., Long, C., Yu, J., Wan, W., Zhao, J. and Wei, J.
A Real-time Big Data Framework for Network Security Situation Monitoring.
DOI: 10.5220/0007708301670175
In Proceedings of the 21st International Conference on Enterprise Information Systems (ICEIS 2019), pages 167-175
ISBN: 978-989-758-372-8
Copyright
c
2019 by SCITEPRESS – Science and Technology Publications, Lda. All rights reserved
167

produce a large number of network security data
every day, such as the system logs of multiple
network security equipment and the alarm
information. To efficiently visualize the dynamic
network attack, can not only help reflect the network
security situation vividly, but also help the
administrators forecast the trend of the network
security situation, find the implicit patterns and rules
send warnings and take corresponding measures.
Thus, in this paper, we investigate the integration
and storage management mechanism of massive
multi-source heterogeneous data, and propose a
general framework of the real time data computation
and visualization. Based on the framework, we realize
the visualization monitoring of network security
dynamic attacks nationwide and worldwide,
respectively. It supports the display of the TOP N
attackers, targets, attack types and so on. The
contributions can be summarized as follows.
We propose an integration and storage
management mechanism of the massive
heterogeneous multi-source data for the security
data fusion. We use the distributed real-time data
collection tool Flume for the massive multi-
source heterogeneous data aggregation, and
realize the access of heterogeneous multi-source
network security data. Then, do the unified format
pre-processing on all kinds of data integration,
and a data stream is performed based on the
extraction time.
We provide a general real time data computation
and visualization framework to realize the real-
time computing. For different sources of security
data, such as the IPS, or the firewall data, we
design different data access method to make the
real time extraction and classification of storage
for unified formatting pre-processed data. The
data stream is calculated and buffered by the
cache mechanism, which is convenient for the
subsequent visualization application.
With the proposed real time data computation and
visualization framework, we use the real security
data of the network security cloud service
platform of Chinese Academy of Sciences (CAS),
and realize the real-time massive multi-
dimensional network attack display with Data-
Driven Documents (D3).
Experiment results are given to analyze the
performance of our proposed framework on the
efficiency of data integration stage and
computation stage. We also analyze the overall
efficiency of the real-time calculation and
visualization framework.
2 RELATED WORK
This paper mainly involves the real-time data
processing (which is based on the stream processing)
and the network security information processing and
visualization. In the following, we would separate the
related work into these two parts.
The real time stream data processing can be
applied in various applications, such as social
networks (Kulkarni et al., 2015), Web Observatory
(Tinati et al., 2015), business decision (Pareek et al.,
2017), etc. The performances of the data capture, data
storage, and data computation in real time can all
affect the performance of the stream data processing.
In recent years, the study of the streaming data
processing has attracted much attention. In
(Toshniwal et al., 2014), it described the architecture
of Storm, and introduced its application in Twitter,
where Apache Storm is an open source, fault-tolerant
and distributed real-time stream data processing
system. In (Kulkarni et al., 2015), a real-time stream
data processing system for large data scale named
Heron was proposed, which was also the stream data
processing engine used inside Twitter due to its better
debug-ability and scalability. In (Yang et al., 2018), a
robust, scalable and real-time event time series
aggregation framework called TimeSeries
AggregatoR (TSAR) was presented to realize the
engagement monitoring. In (Pareek et al., 2017), a
data management platform named Striim was
described for the end-to-end stream processing,
which could enable business users to easily develop
and deploy analytical applications over real-time
streaming data by using a SQL-like declarative
language.
As for the network security information
processing and visualization, some works can be
found. In (Fischer et al., 2014), a visual analytics
system, called NStreamAware was proposed to gain
situational awareness and enhance the network
security, where distributed processing technologies
were used to analyze streams with stream slices, and
NStreamAware was also presented to analysts in a
web-based visual analytics application named
NVisAware. In (Mckenna et al., 2015), three design
methods, the qualitative coding, personas, and data
sketches were described to inform the real-world
cyber security visualization projects from a user-
centered perspective. In (Mckenna et al., 2016), a
dashboard BubbleNet was provided to visualize
patterns in cyber security data by incorporating user
feedback throughout the design.
ICEIS 2019 - 21st International Conference on Enterprise Information Systems
168
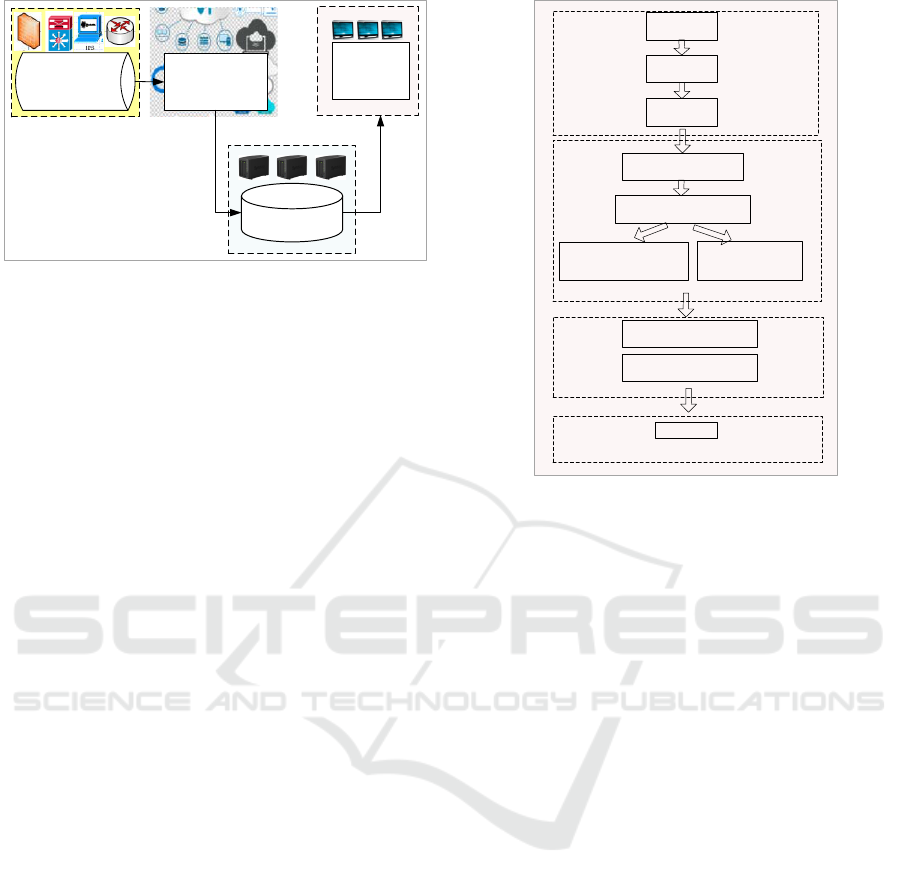
Figure 1: The overall framework of the real time data
computation and visualization.
Although the area of stream processing systems is
active and evolves fast, in this work, we choose Storm
as the tool to process our network security data in real
time because it is mature, extensible, fault-tolerant,
and suitable for our data scale.
3 THE REAL TIME DATA
COMPUTATION AND
VISUALIZATION
FRAMEWORK
3.1 The Overall Framework
Description
The overall framework of the proposed real time data
computation and visualization is showed in Figure 1.
In the module of data fusion, according to the
characteristics of real-time heterogeneous data, we
build and deploy a distributed data collection
platform. By collecting the multi-source real-time
data and import it to the middleware, it realizes the
aggregation and access of massive heterogeneous
real-time data. Besides, the unified format processing
is implemented for different kinds of collected data,
and a time queue of data streams is formed according
to the extraction time.
In the module of real time data computation for
massive data, we design a real-time big data
distributed computing mechanism. For different
sources of data, such as Syslog, customized data flow,
it can extract and realize the classified storage for
unified formatting pre-processed data by different
data access methods. The data stream is calculated
and cached by the cache mechanism, which is
convenient for the subsequent visualization.
Figure 2: The architecture of the network security situation
monitoring.
In the module of the real-time data driven
visualization, it dynamically displays the mass multi-
dimension data with D3. The real-time transmission
data is received through the data service interface
DataService. As for the dynamic display of data,
other tools such as Web GIS, Echarts, and ArcGIS
can also be used.
In the module of data storage for multi-source
heterogeneous data, we build the Redis memory
database for real time data cache, and construct the
distributed platform HDFS (Hadoop distributed file
system) or storing historical data. Redis is an open
source (BSD licensed), in-memory data structure
store, used as a database, cache and message broker.
It supports data structures such as strings, hashes,
lists, sets, sorted sets with range queries, bitmaps,
hyperloglogs and geospatial indexes with radius
queries. In addition, the middleware Kafka is built
and configured for the data collection and data
calculation. The real-time data cache and the
distributed storage system are establishment to meet
the classification, storage and management of all
kinds of historical data.
Real Time Data
Computation Of
Massive Data
Data Fusion of Real
Time Multi-Source
Heterogeneous Data
Visualization
of Real Time
Massive Data
Data Storage based on
Memory
Data sending
Converting IP address into
longitude and latitude
Information extraction
Storm receives data
Kafka topic
Flume
Visualization of Real Time Data
D3
Redis
Hdfs
Real Time Computation
Top N computation
Data Storage
Data Fusion
A Real-time Big Data Framework for Network Security Situation Monitoring
169
3.2 The Realization of Network
Security Attack Display for
Real-time Multi-source
Heterogeneous Data
We use the Flume-Kafka-Storm framework to realize
the acquisition, buffer and process for the real-time
data in the network security situation monitoring.
Specifically, Flume is responsible for the real-time
data acquisition of each node, and Kafka is used as
the message middleware to buffer the data that Flume
push. Then, the collected data is imported to Storm to
be processed. Finally, the processed data which is
needed to be exhibited will be imported to Redis for
fore-end display. The architecture is shown in Figure
2.
The real time multi-source heterogeneous data
aggregation module: Flume is used to collect the
logs from massive probes (e.g., the IPS and the
firewalls). We compile the configuration file of
Flume to configure the sources, sinks and
channels. System logs of IPS are used to simulate
the real-time network attack data, and the
collected data is sent to the corresponding
TOPICs of Kafka.
The real time heterogeneous data computation
module: Storm receives the data that sent to the
TOPICs of Kafkaspout, and transports the raw
data to the Bolt. The raw data is processed and
archived in ReadBolt. It extracts the IP address of
the attacker, the IP address of the target, the type
of attack, and sends them to the ConversionBolt
and CountBolt. In ConversionBolt, the IP
addresses of the attackers and the targets will be
converted into the longitudes and latitudes of
them, then, all the information of IP addresses, the
longitudes and latitudes will be passed to the
Redis for display. Finally, the top N of the
attackers, targets and the type of attack are
calculated in CountBolt, RankBolt and
MergeBolt, and the results are also imported to
Redis.
The real time heterogeneous data storage module:
the real-time data which is needed to be displayed
is pushed to Redis for cache, and the historical
data is put into HDFS for storage.
The real time data driven visualization module:
D3 is used to realize the visualization. We use
DataService to extract the data transferred to
Redis, and use Websocket to display it.
3.3 The Realization of the Storm
Topology for the Network Security
Situation Monitoring
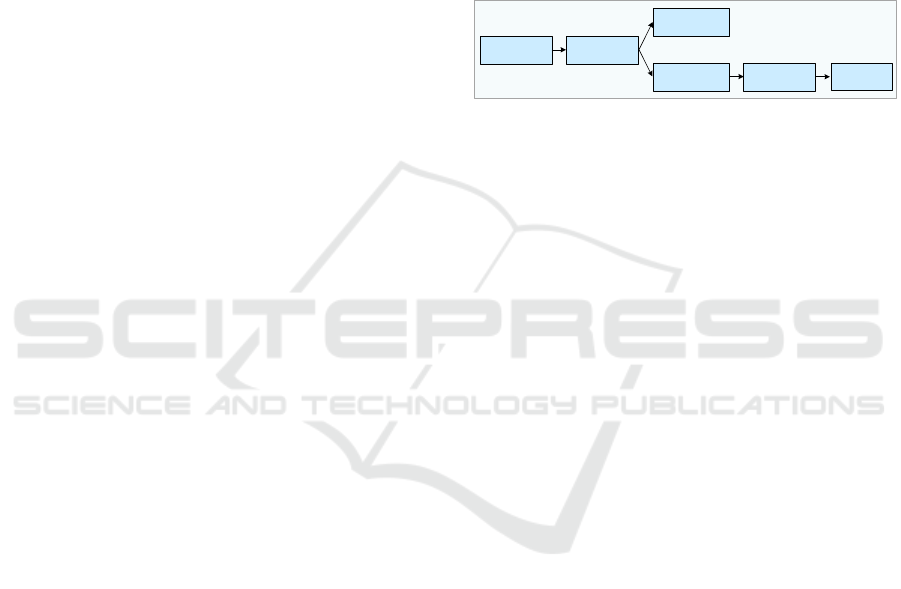
In this paper, we use the real log data obtained from
the network security equipment belonged to the cloud
service platform of the research institutes of CAS and
other national scientific research institutions.
According to the collection time in the log, the actual
traffic data can be simulated. The topology of
function modules for the network security situation
monitoring is shown in Figure 3.
Figure 3: The topology for the network security situation
monitoring.
The data collected by Flume is sent to Kafka to
buffer and form the data flow with time sequence.
So Spout in Storm can read the real time data by
connecting Kafka, and transport the raw data to
the Bolt for further process.
The original data stream is sent to ReadBolt to be
processed and archived. The string is divided into
many fields, including the IP address of the
attacker, the IP address of the target, the type of
attack, the affected port numbers, attack time and
so on, which are stored in HDFS as historical data.
Three fields are extracted and generate the
outputs, i.e., “src” (which is the IP address of the
attacker), dst (which is the IP address of the
target), and type (which denotes the type of
attack).
In ConversionBolt, the IP addresses of the
attackers and targets are converted into the
latitudes and longitudes by querying the
conversion table in the database. The results of
latitudes and longitudes are output in the form of
JSON, and imported to Redis to be displayed in
the front-end.
In CountBlot, the data flow output from ReadBolt
is received to count the numbers of the IP address
of the attacker, the IP address of the target and the
type of attack. We use fieldsGrouping to process
the fields of “dst”, “src” and“type” to ensure that
the same attacker (or target, or type) will be sent
to the same Bolt. The counts will be generated and
output as the data flow “srccount”, “dstcount”,
and “typecount”.
In RankBolt, according to the incoming flow
“srccount”,
“dstcount”, and “typecount”, it
CountBolt
ReadBoutKafkaspout
ConversionBolt
RankBolt
MergeBolt
ICEIS 2019 - 21st International Conference on Enterprise Information Systems
170
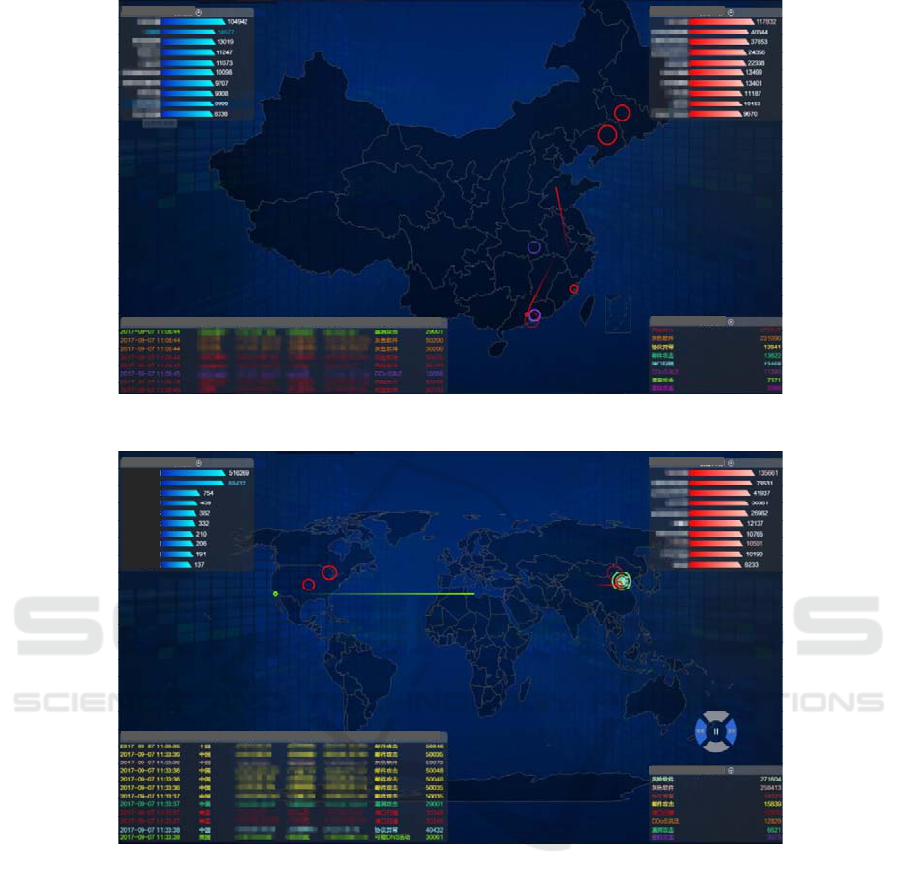
Figure 4: Real-time network attack monitoring visualization based on D3 (nationwide).
Figure 5: Real-time network attack monitoring visualization based on D3 (worldwide).
computes and stores the Top N attack types, IP
addresses of the attackers and the targets in the
lists. When an attack type or IP address from the
incoming flow enters Top N, it will delete the last
items in the list, and insert the new coming item
in the appropriate position. A new ordered data
stream is output in fields of “srclist”, “dstlist”, and
“typelist”.
In MergeBolt, the outputs “srclist”, “dstlist”, and
“typelist” from RankBolt are received, which will
be processed by globleGrouping. The results from
all the RankBolts are converged into the same
Bolt, and the final Top N will be obtained.
3.4 Visualization Implementation of
the Network Security Situation
Real-time network attack display is an important
reflection of the network security situation. We use
D3 to realize the visualization. DataService is used to
extract real-time data transferred to Redis, and
Websocket is used to display the real-time data. The
display effect is shown in Figure 4 and 5. Here, we
set the number of TOP N as 10. As is shown, each
network attack can be monitored in real time, by
showing the IP information of the attacker and the
attack target, as well as their specific country and
location. And the information of the attackers and the
targets can be updated in real time.
Attack Source
Time Attacker Attacker IP Target Target IP Attack Type Port
Attack Targets
Attack Types
Attack Source
Attack Targets
Attack Types
Time Attacker Attacker IP Target Target IP Attack Type Port
China
USA
Netherlands
Russia
Japen
Canada
India
Germany
UK
Turkey
A Real-time Big Data Framework for Network Security Situation Monitoring
171
4 EXPERIMENTAL SETUP
4.1 Data Sources
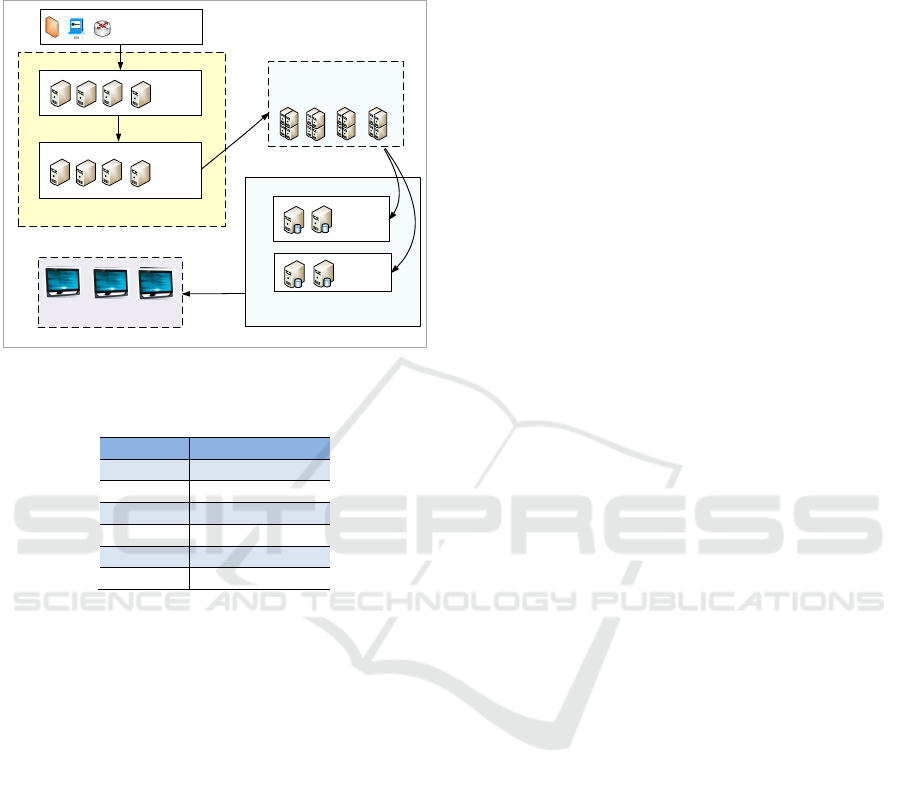
Figure 6: The hardware topology.
Table 1: Software versions.
Software version
Jdk Java 1.7
Flume Flume 1.5.2.2.2
Kafka Kafka 0.8.1
Storm storm 0.9.3
HDFS hadoop 2.6.0.2.2
Redis Redis 3.0.1
CAS has deployed a network security cloud service
platform to improve the network security
infrastructure of the China Scientific and
Technological Network (CSTNet). The platform
centralizes and unifies the monitoring and
management of related network security systems, and
collects, aggregates and processes the decentralized
security information. The security data used in this
paper come from the cloud service platform of the
research institutes of CAS and other national
scientific research institutions, which provides a good
data base for us.
According to the statistics of the information
quantity of the existing network security cloud
service platform, the original log volume of ten sets
of equipment systems in one research institute is
about 177,778 in 24 hours per day. After processing
and merging, it becomes about 116,667, and the
number of security incidents is about 20,000. The
original 24-hour log volume of 200 research institutes
is about 3.553 million, after processing and merging,
it becomes about 2.333 million, and the number of
security incidents is about 400,000, which provides a
good data foundation for this paper.
4.2 Hardware and Software
Environment
Real-time multi-source heterogeneous data
aggregation: We use 4 servers configured with Flume
to consolidate the system logs of network security
devices in real time. Then, Kafka is used as the
middleware to form the time queue of data streams,
and publish the streams of the records.
Data computation: 4 servers equipped with Storm
cluster are used for the real-time calculation of big
data, where 1 server acts as Nimbus, and the
remaining 3 servers as supervisors.
Data storage: Among the 3 supervisor's servers
which is used for the data computation, 2 servers of
them are installed HDFS for storing historical data,
and the remaining one installs Redis for storing real-
time data.
The network bandwidth in our experiment
environment is Gigabit. All the servers we used are
configured with 500G disk and 8GB memory. The
hardware topology is displayed in Figure 6, and the
versions of the software are shown in Table 1.
5 PERFORMANCE
EVALUATION
5.1 The Performance of Multi-Source
Heterogeneous Data Collection
Logs of the security equipment are used to simulate
the real-time network attack data. Each piece of data
in a log has eight fields, including ID, the attacker, the
IP address of the attacker, the target, the IP address of
the target, the type of attack, the time of the attack
occurs, and the port number. We measure the amount
of data collected by Flume clusters in one second. We
choose the collected data in 60s~120s after the
experiment starts, which is in a minute, and 10
experiments are carried out to take the average. The
results of the experiment are shown in Table 2.
Another advantage of Flume is that it can directly
collect data through simple configuration, and the
data acquisition and transmission can be realized by
compiling the configuration file.
The module of the real-time
data driven visualization
The data Fusion of Real Time Multi-Source
Heterogeneous Data
The storage module of real time
multi-source heterogeneous data
Fume
The big data processing
module for real time
computing
Kafka
HDFS
Redis
Data Sources
ICEIS 2019 - 21st International Conference on Enterprise Information Systems
172
5.2 The Performance of Real-Time
Processing for Network Security
Big Data
5.2.1 Comparison of Computing Efficiency
between Storm Cluster and Single
Machine
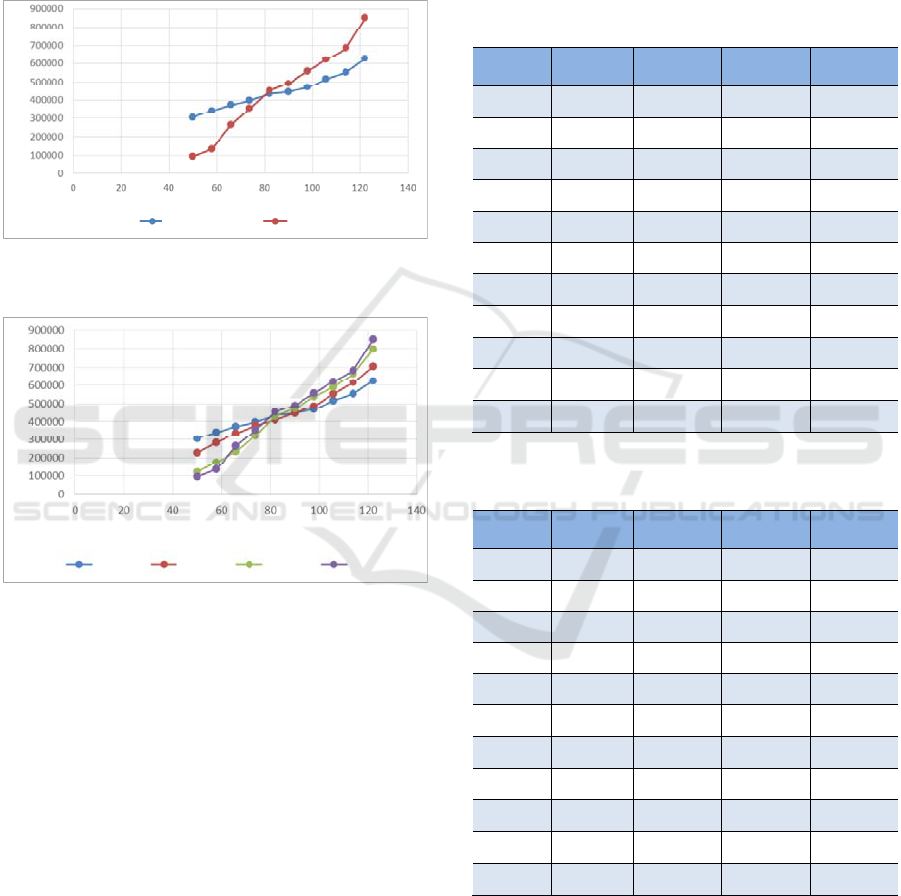
Figure 7: Processing efficiency between single machine and
cluster.
Figure 8: Computing efficiency versus the machine
number.
We will calculate the amount of the network security
data which is processed during a certain period of
time, and compare the data processing efficiency
between the single machine and the Storm clusters.
We guarantee that the data in the collection phase is
larger than the data in the real-time processing phase.
As is shown in Figure 7, in the first 80 seconds, the
single machine can process more pieces of network
security data than the Storm cluster. But 80 seconds
later, the cluster can compute more pieces of data than
the single machine, and the gap between them is
constantly growing as the time increases.
The reason is that, the Storm cluster takes longer
time to start up than the single machine. We found
that, when it uses the single machine to process the
data, the results will be output in 10 seconds after the
system starts, whereas when it uses the Storm cluster,
it needs 40 seconds to output the processed results.
That is to say, the start-up time of the Storm cluster
has an effect on the calculation efficiency. So, it is not
a wise decision to use clusters all the time, but to
choose the single machine or the clusters according to
the data size, requirements of the computational
efficiency and the project cost.
Table 2: Collection efficiency of Flume (pieces of data
collected per second).
1
Machine
2
Machines
3
Machines
4
Machines
1
3001 5679 8571 11435
2
2656 5345 8799 11567
3
2755 5576 8321 11234
4
2832 5879 8543 11992
5
2933 5788 8875 11076
6
3098 5699 8700 11334
7
2865 5488 8602 11748
8
2588 5788 8761 12409
9
2754 5572 8430 10990
10
2872 5720 8616 10823
Average
2835.4 5653.4 8621.8 11460.8
Table 3: Computational efficiency (pieces of data computed
per second).
1
Machine
2
Machines
3
Machines
4
Machines
1
4462 6642 9442 10497
2
5098 7008 10080 11920
3
3889 6854 8790 11234
4
4078 6293 9234 10989
5
5123 6473 11220 11234
6
4788 6778 9188 10567
7
4323 6522 9509 12190
8
4611 6688 10098 11908
9
4512 6712 9637 10501
10
4416 6570 10334 10708
Average
4530 6654 9753.2 11174.8
The amount of data (piece)
Time (Second)
Singlemachine Cluster
The amount of data (piece)
Time (Second)
Machine1 Machine2 Machine3 Machine4
A Real-time Big Data Framework for Network Security Situation Monitoring
173
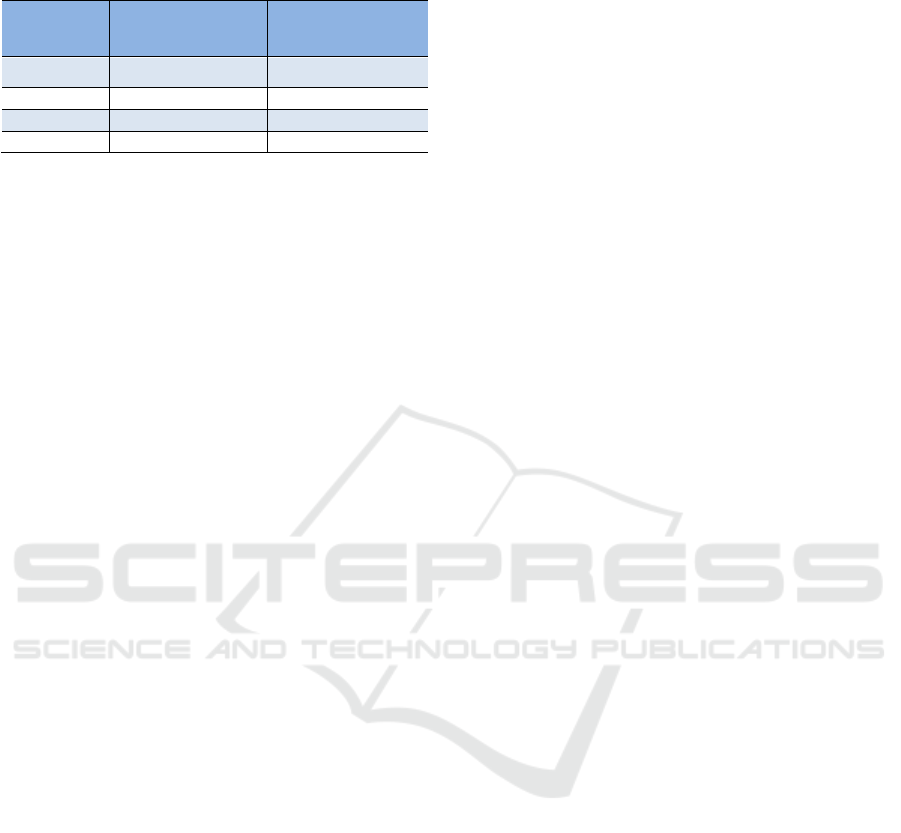
Table 4: Data acquisition and computation efficiency
(pieces of data per second).
Collection
Efficiency in Data
Collection
Computational
Efficiency in Data
Processing
1 Machine
2835.4 4530
2 Machines
5653.4 6654
3 Machines
8621.8 9753.2
4 Machines
11460.8 11174.8
5.2.2 Computational Efficiency of Clusters
of Different Machine Numbers
We can also observe in Figure 8 that, although the
start-up time increases as the machine numbers grow,
the amount of the processed data also increases. In
order to further study the influence of machine
number on data processing efficiency, we calculate
the amount of data that cluster can be processed in
one second. We choose the collected data in 60s after
the experiment starts to eliminate the influence of the
start-up time, and we calculate the amount of data that
can be calculated per second of different number of
machines.
5.2.3 The Performance of Real-time
Calculation and Visualization
Framework
In Table 3, we can observe the amount of processed
data in one second. Specifically, we choose the
processed data in 60s~120s after the experiment starts,
which is in a minute, and 10 experiments are carried
out to take the average. It can be seen that, the amount
of the calculated data in a second increases
significantly as the number of machines grows.
In Table 4, we compare the data acquisition
efficiency and the computing efficiency of the two
phases, i.e., the data collection stage and real time
data processing stage by exhibiting the number of
pieces of data that are collected and processed
respectively in one second. It can be observed that,
when the machine number of the Storm cluster is less
than 4, the data computing efficiency is higher than
the data collection efficiency, and there is no problem.
But when the number of machines increases to 4, the
cluster collect more data than that it can process,
which means that, the data processing speed cannot
keep up with the speed of the data collection. In order
to avoid the data congestion and make the real-time
framework operate normally, it is necessary to
configure more machines to calculate the collected
data.
6 CONCLUSIONS
In this paper, we realized the visualization monitoring
for the network security situation monitoring based
on the proposed real-time calculation and
visualization framework. Experiment results showed
that, the calculation efficiency of the proposed real-
time calculation framework has been greatly
improved compared with traditional single machine.
The proposed real-time calculation and visualization
framework can also be applied to other areas which
require information visualization of massive multi-
source heterogeneous data.
ACKNOWLEDGEMENTS
This work was supported by the Construction Project
of Network Security System (XXH13507);
(XDC02000000).
REFERENCES
Álvarez, R. P., Giraldo-Rodríguez, C., Chaves-Diéguez, D.,
2018. Large scale anomaly detection in data center logs
and metrics. In ECSA '18 Proceedings of the 12th
European Conference on Software Architecture. ACM.
Fischer, F., Keim, D. A., 2014. Nstreamaware: real-time
visual analytics for data streams to enhance situational
awareness. In VizSec '14, Proceedings of the Eleventh
Workshop on Visualization for Cyber Security. ACM.
Huffer, K. M. T., Reed, J. W., 2017. Situational awareness
of network system roles (SANSR). In CISRC '17,
Proceedings of the 12th Annual Conference on Cyber
and Information Security Research. ACM.
Kulkarni, S., Bhagat, N., Fu, M., Kedigehalli, V., Kellogg,
C., Mittal, S., et al., 2015. Twitter Heron: Stream
Processing at Scale. In SIGMOD '15, Proceedings of
the 2015 ACM SIGMOD International Conference on
Management of Data. ACM.
Mckenna, S., Staheli, D., Meyer, M., 2015. Unlocking user-
centered design methods for building cyber security
visualizations. 2015 IEEE Symposium on Visualization
for Cyber Security. IEEE.
Mckenna, S., Staheli, D., Fulcher, C., Meyer, M., 2016.
Bubblenet: a cyber security dashboard for visualizing
patterns. Computer Graphics Forum, 35(3), 281-290.
ACM.
Pareek, A., Khaladkar, B., Sen, R., Onat, B., Nadimpalli, V.,
et al., 2017. Striim: A streaming analytics platform for
real-time business decisions. In BIRTE '17,
Proceedings of the International Workshop on Real-
Time Business Intelligence and Analytics. ACM.
Tinati, R., Wang, X., Brown, I., Tiropanis, T., Hall, W.,
2015. A Streaming Real-Time Web Observatory
ICEIS 2019 - 21st International Conference on Enterprise Information Systems
174

Architecture for Monitoring the Health of Social
Machines. In WWW 2015, International Conference on
World Wide Web. ACM.
Toshniwal, A., Taneja, S., Shukla, A., Ramasamy, K., Patel,
J. M., Kulkarni, S., et al., 2014. Storm@twitter. In
SIGMOD '14, Proceedings of the 2014 ACM SIGMOD
International Conference on Management of Data.
ACM.
Yang, P., Thiagarajan, S., Lin, J., 2018. Robust, Scalable,
Robust, Scalable, Real-Time Event Time Series
Aggregation at Twitter. In SIGMOD '18, Proceedings
of the 2015 ACM SIGMOD International Conference
on Management of Data. ACM.
A Real-time Big Data Framework for Network Security Situation Monitoring
175
