
On-demand Ride-sharing Services with Meeting Points
Sevket G
¨
okay
1,2
, Andreas Heuvels
2
and Karl-Heinz Krempels
1,2
1
Informatik 5 (Information Systems), RWTH Aachen University, Aachen, Germany
2
CSCW Mobility, Fraunhofer FIT, Aachen, Germany
{sevket.goekay, andreas.heuvels, karl-heinz.krempels}@fit.fraunhofer.de
Keywords:
Demand-Responsive Transport, Dial-a-Ride Problem with Time Windows, On-demand Ride-sharing, Spatial
Clustering.
Abstract:
On-demand ride-sharing services propose an alternative transportation mode to public and private transporta-
tion. They have similarities with private transportation, since the customers have the convenience of travelling
from and to any desired location while defining the departure (or arrival) time. They resemble public trans-
portation in multiple customers sharing a vehicle with similar journeys. This work proposes an approach to
improve the throughput of on-demand ride-sharing services by introducing meeting points. The idea bases
on combining a vehicle’s nearby location visits (whether for pick-up or drop-off) into one, if temporal and
spatial constraints are held, in order to reduce the vehicle detour costs. It, by design, diminishes customer
convenience, since walking legs are introduced and departure/arrival times might deviate from what is desired.
The trade-offs are evaluated by running two simulations, one without and one with meeting points. The results
indicate that even a small customer inconvenience can yield significant increase in the number of satisfied trip
requests without increasing vehicle costs.
1 INTRODUCTION
Technological advancements change our lives daily.
They can make us rethink existing solutions, e. g.
transportation services, and enable new approaches to
realize them. Since smartphones with Global Posi-
tioning System (GPS) and Internet capabilities are be-
coming ubiquitous, on-demand ride-sharing services
are gaining in popularity. Some recent reports anal-
yse their effects and usage patterns: Research anal-
ysis in (Transportation Research Board, 2016) states
that ride-sharing services are mostly used during night
time when the coverage of public transportation is ei-
ther poor or unavailable. This shows that ride-sharing
services are often used to complement public trans-
portation instead of competing with it. However, a
more recent analysis in (Schaller, 2018) argues that
ride-sharing actually increases traffic because more
users switch from non-auto modes, and that the ca-
pacity of the vehicle is not used to its fullest because,
even in shared rides, there are parts of the ride in-
volving only one passenger. The ride-sharing aspect
of these services is still in its infancy, since they are
mostly seen as an alternative to the taxi service. For
example, according to the analysis in (Schaller, 2018),
the most recent data suggests that the percentage of
shared trips compared to all trips is only 22% by Lyft
and 23% by Uber in New York City.
Motivation
Public transportation services like bus services can
achieve high throughput (i. e. bringing a large number
of people from A to B in a period of time) because they
operate with fixed routes, timetables and bus stops.
This architecture neglects the customer satisfaction
aspects since it enforces always walking to/from a sta-
tion and waiting time at a station. On the other side
of the spectrum, on-demand transportation services
(e. g. taxi or ride-sharing) operate without fixed routes
and timetables, and with arbitrary pick-up and drop-
off locations. However, ride-sharing services might
suffer from too frequent stops of a vehicle and sub-
optimal routes due to many small detours, especially
when they utilize bigger vehicles (e. g. minibus, bus),
where the likelihood of a large number of concurrent
passengers is high.
In such contexts, the quality of service and
throughput could be improved by introducing meet-
ing points where pick-up and drop-off events in close
proximity (w. r. t. time and location) can be bun-
dled together. This, in our perspective, strikes a
Gökay, S., Heuvels, A. and Krempels, K.
On-demand Ride-sharing Services with Meeting Points.
DOI: 10.5220/0007709101170125
In Proceedings of the 5th International Conference on Vehicle Technology and Intelligent Transport Systems (VEHITS 2019), pages 117-125
ISBN: 978-989-758-374-2
Copyright
c
2019 by SCITEPRESS – Science and Technology Publications, Lda. All rights reserved
117

happy medium between traditional public transporta-
tion (fixed stations) and classical ride-sharing services
(no stations). Moreover, our work introduces a new
concept, namely location flexibility, to the Dial-a-
Ride Problem (DARP)
1
, since DARP variants already
leverage temporal flexibility – by making use of time
windows
2
– but not location flexibility.
Our starting point is an online multi-vehicle
DARP solution, where trip requests are processed as
they appear in real-time without knowledge about the
future (online) and are either assigned to one vehicle
in the fleet (multi-vehicle) or rejected because they do
not satisfy the constraints. It builds on the works of
(G
¨
okay et al., 2018; Tsubouchi et al., 2010) and uses
insertion heuristics to solve the scheduling problem.
The paper is organized as follows. Section 2 pro-
vides an overview of the research field and similar
practical solutions. Section 3 illustrates the taken ap-
proach in detail. Subsequently, Section 4 highlights
the key points about the implementation, presents the
evaluation methodology and discusses the results. Fi-
nally, Section 5 concludes the paper.
2 RELATED WORK
In (Stiglic et al., 2015), meeting points are used to
bundle nearby requests if possible. In contrast to
our approach, the authors rely on a preset of meet-
ing points and suggest to use coffee shops or gas sta-
tions for example, depending on the local legal cir-
cumstances. For this study, a travel demand model for
the metropolitan Atlanta region is used, which is then
divided into multiple zones, each with a fixed amount
of randomly generated meeting points. By requiring
customers to walk and gather within a certain vicinity,
the number of stops for a vehicle as well as the overall
driven distance could be reduced.
The approach in (Li et al., 2018) aims to improve a
ride-sharing system based on time windows by adding
the concept of meeting points. To solve the mixed
integer linear program that models the problem, a
tabu-search based meta-heuristic algorithm is imple-
mented. The results are then compared to the op-
timum obtained through CPLEX. While using small
fleets with 3-5 vehicles, the faster heuristic yields re-
sults close to the optimum, while meeting points can
reduce mileage by 2.7%–3.8%.
1
DARP is the underlying problem definition that ride-
sharing services aim to solve.
2
Location visits (i. e. pick-up and drop-off events) have
to occur within given time windows.
Optimal Multi-Meeting-Point Route (OMMPR)
queries, introduced in (Li et al., 2016), aim to find
a short path between a start and end point within a
road network while also minimizing detours for addi-
tional stops in between. These intermediate stops are
not fixed to a location but limited by constraints on
how much they can accommodate the original query
to a meeting point. Calculating the OMMPR query
is NP-hard and two solutions based on dynamic pro-
gramming are proposed in the paper.
Uber introduced Express POOL (Stock, 2018) in
early 2018, an addition to its taxi services that reduces
detours by having the customer walk to/from a loca-
tion nearby the start/endpoint of the initial request.
The so-called Express spots change based on popular
routes at the time of request. The application requires
the customer to wait a few minutes in the beginning,
such that possible co-passengers can be matched to
the same ride. A higher success rate can be achieved
by postponing every final decision as long as possible
to increase the systems flexibility (Hawkins, 2018).
One aspect of our meeting points approach relies
on determining hotspots based on historical data. We
aim to identify hotspots as potential meeting points
by applying clustering, a data mining technique. For
this purpose, we investigated several clustering al-
gorithms. Density-based spatial clustering of appli-
cations with noise (DBSCAN) is introduced in (Es-
ter et al., 1996). Opposed to other common al-
gorithms like k-means (MacQueen, 1967), which is
known to be unfitting for spatial clustering (Murray
and Grubesic, 2002; Grubesic et al., 2014), DBSCAN
does not separate data into a fixed number of clus-
ters. It tries to identify concentrations of data points
by analysing the density and by grouping those points
that are in a sufficiently dense neighbourhood. But
the algorithm has a problem identifying clusters if the
data point density varies strongly in different regions.
Ordering Points To Identify the Clustering Structure
(OPTICS), proposed in (Ankerst et al., 1999), coun-
ters this weakness by taking points of other nearby
clusters into account.
3 APPROACH
Our input model for requests contains the number of
passengers, the desired pick-up (or drop-off) time, the
pick-up and drop-off locations, a slack time
3
, a time
flexibility and a location flexibility. Process request in
Figure 1 converts this input into a fully-fledged trip
3
The duration to expand the pick-up and drop-off times
into time windows.
VEHITS 2019 - 5th International Conference on Vehicle Technology and Intelligent Transport Systems
118
Adjust schedule
Process request
Sort vehicles
Notify
Vehicle / Driver
Notify User
Reached
max
retries?
No
Fix violations
& try again
(For each vehicle: insert new request and …)
(New Schedule)
Try next vehicle
Yes
No
Yes
No
Yes
Reject request
Feedback: Success
Feedback: Failure
Tried
every
vehicle?
Has
violations
?
Find mapping candidates
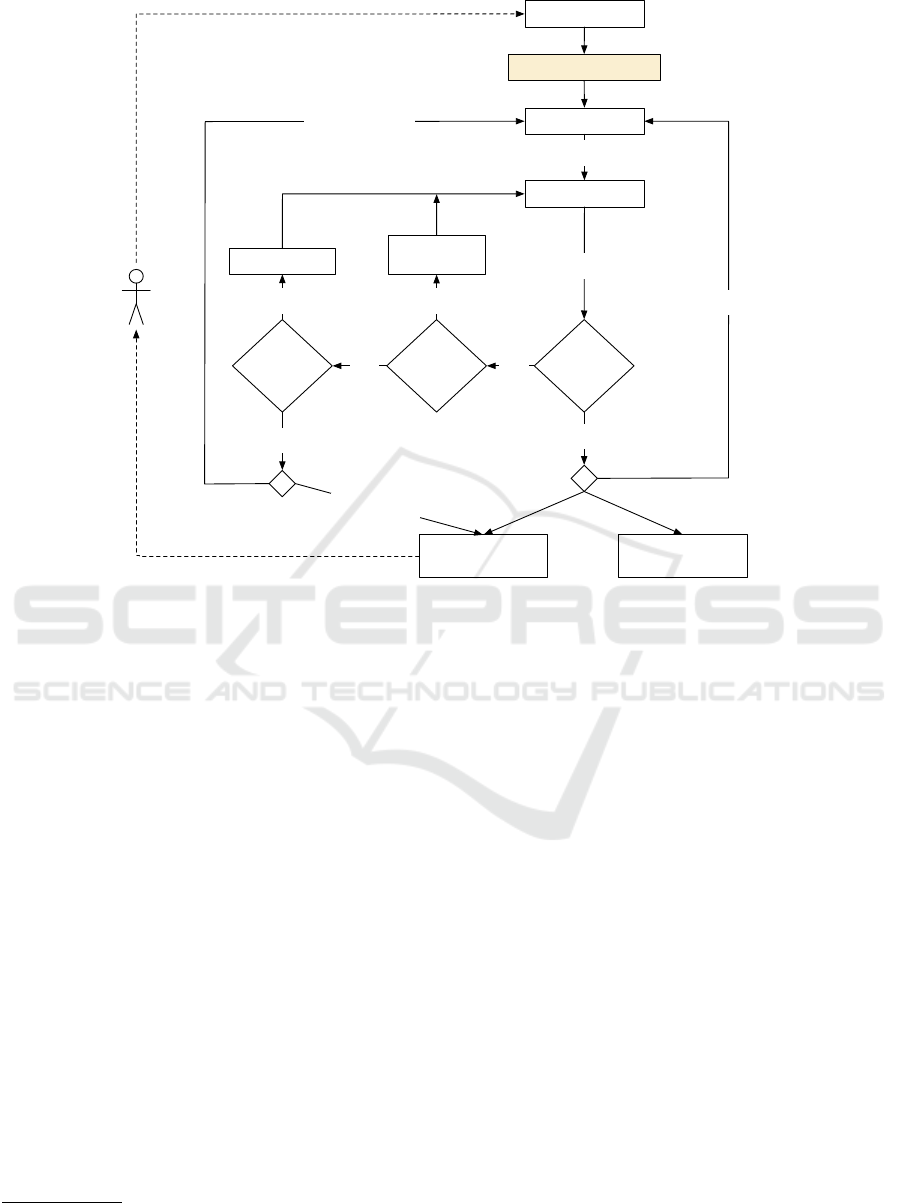
Figure 1: Decision structure of the approach. Finding mapping candidates is the main contribution of this work.
request model that contains the number of passen-
gers, the pick-up and drop-off events, the time and
location flexibilities. Each event contains a location,
a time window
4
and an actual time within the time
window. The calculation of time windows is done
according to the scheme in (Tsubouchi et al., 2010).
Time flexibility describes the duration we can in-
crease the time window by in order to define the tem-
poral search space when looking for events in close
proximity. Similarly, location flexibility describes the
maximum walking path length from the location and
consequently the spatial search space.
In our online scenario, we consider already ac-
cepted trip requests to be bound to their location
(i. e. their pick-up and drop-off locations cannot be
moved). Since we aim to respond to trip requests
in a matter of seconds, changing the locations after-
wards (e. g. if as a result of future requests, more op-
timal meeting points are possible) and notifying the
user about an unexpected walking leg would deterio-
rate the user experience. In this regard, our approach
maps the pick-up and drop-off events of a new request
to those of accepted requests in a vehicle schedule, if
their spatio-temporal distance respects specified loca-
4
It denotes the earliest and latest times that this event
can occur by applying the slack time
tion and time flexibility thresholds, or we process the
request as is. The time window and location proper-
ties of the new request’s events are practically over-
riden with the values of the accepted one. This prin-
ciple, however, raises the importance of the events of
initial requests since their quality is decisive whether
and how the future request events can be mapped.
To counteract this situation, we introduce hotspots:
Analyse historical request data to determine spatio-
temporal hotspots (i. e. sort of virtual stations that can
move over time). This process is described in Sec-
tion 3.1. A hotspot, similar to a pick-up or drop-off
event, has a location and time window (duration of
its hotness) and is therefore treated as such. We try
mapping a request event at first to events in a vehicle
schedule and then to hotspots.
Finally, our approach can be summarized as fol-
lows (i. e. Find mapping candidates in Figure 1 con-
tains the following steps):
1. For the pick-up and drop-off events of a new
trip request, find all feasible events in the vehicle
schedule and feasible hotspots (See Section 3.2).
This gives us all the mapping candidates for both
events separately. If there is no candidate for one
event, then the original event of the request is
used.
On-demand Ride-sharing Services with Meeting Points
119

2. Combine all pick-up and drop-off candidates that
can be served by the same vehicle.
3. Order the pairs of pick-up and drop-off candidates
by their ascending spatio-temporal distance to the
original events (See Section 3.3). The candidates
from vehicle schedule have priority over hotspots.
4. Return the first pair that does not violate customer
constraints (See Section 3.4).
The resulting pair of events can now be treated as an
ordinary trip request without any additional informa-
tion and processed further (starting with Sort vehicles
in Figure 1).
3.1 How to Determine Hotspots?
Existing solutions for finding meeting points follow
mostly one of the following approaches:
• Random generation/selection from data (Stiglic
et al., 2015)
• Crowdsourcing (Hansen et al., 2010)
• Certain locations (e. g. parking place, fuel sta-
tion, street intersection) with convenience fea-
tures (e. g. illumination, parking quality) (Czioska
et al., 2017)
However, these predominantly concentrate on meet-
ing points between a driver and passenger. In con-
trast, our approach aims to group pick-up and drop-
off events of passengers. It employs a data mining
technique to analyze historical data (i. e. demand) to
derive patterns and presumes that future demand will
be similar. The process of determining hotspots is au-
tomated and requires no manual intervention or addi-
tional interpretation.
After evaluating various clustering algorithms and
implementations with trips extracted from New York
City taxi trip data (2010–2013)
5
, we decided to use
OPTICS with ξ
6
extraction. The dataset contains taxi
trips with the start and end times of the trip and pick-
up and drop-off locations. We split a trip into two
data points (pick-up and drop-off), where each data
point contains a time and location. We partition the
period of time, for which we want to identify clusters,
by a predefined duration parameter bucket size into
smaller time buckets. This has two main advantages:
Better control over temporal validity of hotspots (i. e.
hotspots remain hot as long as the time bucket) and
improved clustering runtime because of dimension re-
duction of the distance function. Subsequently, we
5
https://databank.illinois.edu/datasets/IDB-9610843
6
A steepness threshold to classify clusters by relative
density change.
assign the data points to their time buckets and run
OPTICS for each time bucket. Since we are handling
the time dimension externally, the distance function in
OPTICS addresses only the spatial distance and uses
haversine formula.
The output of OPTICS is a hierarchical clus-
ter structure with larger high-level clusters contain-
ing smaller more dense clusters. In order to deter-
mine the hierarchy level, we walk the hierarchy top-
down and for each cluster at each level we calculate
the weighted center and determine whether there are
points outside of a predefined distance threshold, de-
cide level radius. If it is the case, we continue the hi-
erarchy walk. Otherwise, we find the closest location
on the street network for this cluster’s weighted center
and decide that it is a hotspot. The results are stored
as key-value pairs, where each time bucket contains a
set of hotspots.
3.2 Feasibility Constraints for
Candidates
For an event or hotspot to be considered as a candi-
date, the following constraints must be satisfied:
1. Location constraint: A walking path between the
locations of original event and candidate must ex-
ist and its length should not be greater than the
location flexibility.
2. Time constraints:
• If the user specified the pick-up time and the
candidate is for pick-up, the candidate’s time
window must start after the user’s.
• If the user specified the drop-off time and the
candidate is for drop-off, the candidate’s time
window must not end after the user’s.
• Candidate’s time window is allowed to be com-
pletely within the user’s (Figure 2 (a
1
)).
• If user’s time window is completely within the
candidate’s, then the total exceed (e
1
+e
2
) must
not be greater than the time flexibility (Figure 2
(a
2
)).
• If time windows of candidate and event only
partially overlap, the exceed e must not be
greater than the time flexibility (Figure 2 (b
1
),
(b
2
)).
• If there is no overlap, the distance e from candi-
date’s farthest point of time window to event’s
closest point of time window, must not be
greater than the time flexibility (Figure 2 (c
1
),
(c
2
)).
To find event candidates, we walk over the vehi-
cle schedules and mark feasible events. Similarly,
VEHITS 2019 - 5th International Conference on Vehicle Technology and Intelligent Transport Systems
120

to find hotspots candidates, we find corresponding
time buckets and mark feasible hotspots for each time
bucket.
3.3 Criteria for Ordering
For each event-candidate arrangement, we calculate
the following terms:
l
d
The distance between the locations of the event
and candidate.
d
e
Total duration of event’s time window.
d
o
Overlapping part of event’s and candidate’s time
window (Figure 2 (a
1
), (a
2
), (b
1
), (b
2
)).
d
ib
Indent before: Time offset how much the event’s
start is before the candidate’s (Figure 2 (b
1
), (c
1
)).
d
ia
Indent after: Time offset how much the event’s
end is after the candidate’s (Figure 2 (b
2
), (c
2
)).
d
eb
Excess before: Time offset how much the can-
didate’s start is before the event’s ( Figure 2 (a
2
),
(b
2
)).
d
ea
Excess after: Time offset how much the candi-
date’s end is after the event’s (Figure 2 (a
2
), (b
1
)).
Then, we order the candidates in ascending order by
calculating the following cost function:
∆
C
= l
d
∗ (ratio
overlap
+ ratio
be f ore
+ ratio
a fter
)
where
ratio
overlap
= 1 −
d
o
d
e
ratio
be f ore
=
d
eb
+ d
ib
d
e
ratio
a fter
=
d
ea
+ d
ia
d
e
Ordering in this fashion allows us to prioritize can-
didates that have smaller spatio-temporal distances to
the original event.
3.4 Feasibility Constraints for
Customers
After filtering out infeasible candidates by apply-
ing event-level constraints, we filter out infeasible
pick-up and drop-off pairs, if one of the following
customer-level constraints are violated:
• Pick-up and drop-off locations must be different
• Earliest drop-off time − earliest pick-up time ≥
direct ride time
event
t
candidate
event
candidate
(a
1
)
(a
2
)
event
candidate
event
candidate
(b
1
)
(b
2
)
event
candidate
event
candidate
(c
1
)
(c
2
)
e
2
e
1
e
e
e
e
Figure 2: The various arrangement possibilities of an event
and candidate w. r. t. time.
event
candidate
d
o
d
ea
d
ib
Figure 3: Exemplary event-candidate arrangement with in-
dent before d
ib
, overlap d
o
and excess after d
ea
.
• Actual pick-up time < actual drop-off time
• Actual ride time ≥ direct ride time
Direct ride time is the duration of the shortest path
from pick-up to drop-off (without detours), whereas
actual ride time denotes the ride time within a vehicle
schedule (with detours).
4 EVALUATION
This section describes the evaluation methodology,
the data sets and presents the results while discussing
key findings.
4.1 Implementation Overview
The system is developed as a standalone Java 8 appli-
cation. Route calculation is handled by GraphHop-
per
7
, which imports OpenStreetMap (OSM)
8
maps
7
https://www.graphhopper.com/
8
http://www.openstreetmap.org/
On-demand Ride-sharing Services with Meeting Points
121

and builds the underlying graph to be used for rout-
ing. As for clustering, we opted for the ELKI
9
library,
which provides an OPTICS implementation with ξ
extraction among many others. We make use of par-
allel computing at all steps where it is possible.
4.2 Simulation Environment and Data
Set Description
We evaluate our approach by simulating taxi trips ex-
tracted from New York City taxi trip data with two
on-demand ride-sharing service implementations, one
without and one with meeting points. We interpret
each taxi trip as a trip request by setting the pick-up
and drop-off location, the desired pick-up time to trip
start time and number of passengers to one. The trip
data is already sorted by trip start time and our simu-
lations process the requests in the same order. A trip
request is satisfied, if it can be assigned to a vehicle.
We collect different measures in three groups:
• General: Success rate (ratio of number of satis-
fied requests to all requests in the dataset), request
processing duration (how much time it takes until
finding a vehicle assignment or until rejecting the
request), number of mapped events
• Customer satisfaction: Ride delay (duration dif-
ference between actual and direct ride times),
waiting time (duration difference between desired
pick-up time and the time when the customer is
actually picked up)
• Service/vehicle costs: Capacity utilization, driven
distance per vehicle, number of shared rides
The OSM data used for New York City con-
tains all information and changes up to 2017-04-
09T15:01:34Z. We extract trips on Saturday May 11,
2013 from New York City taxi trip data. For the sim-
ulations to finish in reasonable time, we prepare three
data sets:
1. Picking a time interval with high density of re-
quests to represent peak demand (with pick-up
times from 19:00 to 20:00 totaling to 30,884
trips).
2. Picking a time interval with low density of re-
quests to represent off-peak demand (with pick-
up times from 05:00 to 07:00 totaling to 10,388
trips).
3. Reduced number of trips by selecting every 10th
(from 00:00 to 23:59 totaling to 52,552 trips). The
aim is to keep the data distribution as close as
possible to the whole day with less data points.
9
https://elki-project.github.io/
Hereby, we assume not to introduce a selection
bias.
For clustering (i. e. hotspot detection), we use the
day Saturday May 4, 2013 (i. e. a week before the
simulation data set). The simulations are run inside
a virtual machine configured with 8 vCPUs (Intel
Xeon E5-2650 clocked at 2.20 GHz). Used Java Vir-
tual Machine parameters are -Xms2048m -Xmx4096m
-XX:+UseG1GC.
We evaluate the effect of different parameter val-
ues related to meeting points, while keeping the re-
maining configuration within each test category the
same (i. e. number of vehicles, vehicle capacity, slack
time) or using the default values for the remaining di-
mensions (e. g. when testing with various bucket size
values, time flexibility is set to 5 min.). In all tests,
we set the vehicle capacity to 10 and the slack time to
5 minutes. The number of vehicles is set to 1000 for
high density, 250 for low density and 100 for every
10th data sets. These values are chosen in a way to
prevent oversaturating the system with resources and
in order to better observe the results of meeting points.
In addition to already introduced concepts, we inves-
tigate the impact of minPoints (an OPTICS parameter
that defines the number of points required to form a
cluster) and mapping mode, where we intentionally
disable mapping to either hotspots or already existing
request events.
4.3 Results and Findings
The simulation results are depicted in Table 1. Some
of the key findings are as follows:
• The simulations with the high density dataset ben-
efit from meeting points the most, since increas-
ing density of requests increases the potential of
events to be bundled.
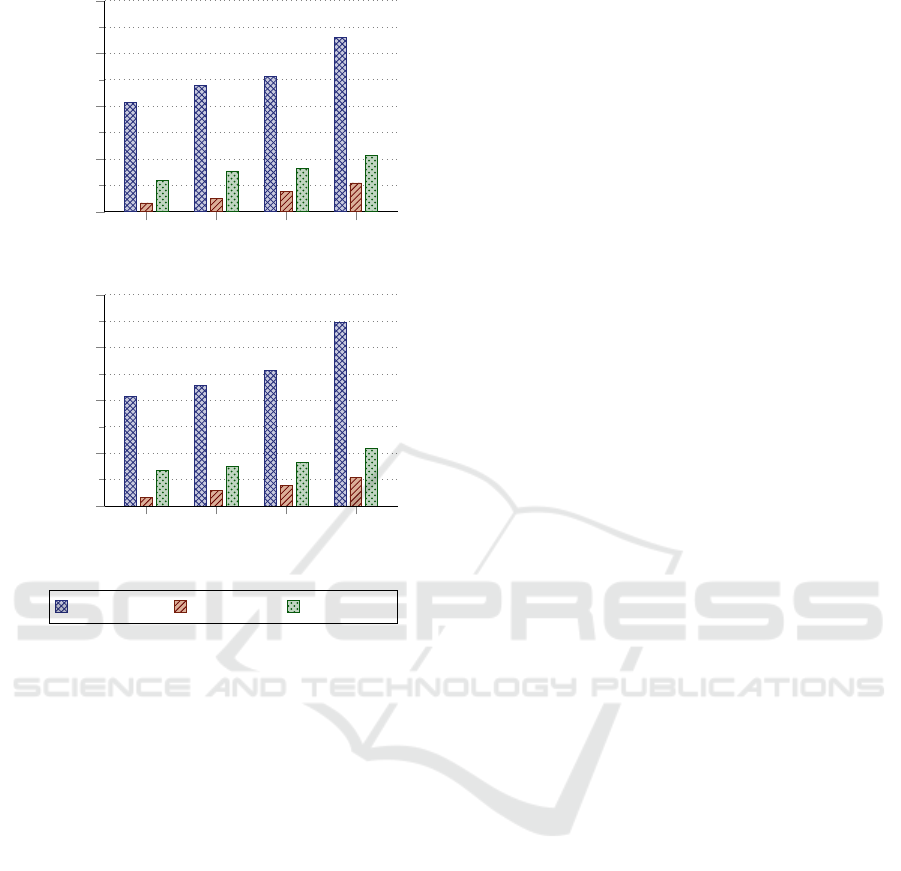
• The most important factors that influence the re-
sults are time and location flexibility. As depicted
in Figure 4, the bigger the flexibilities, the better
the success rates.
• The choice of bucket size is important, since its
value directly affects the number of clusters and
how long they remain active. Smaller bucket sizes
produce higher numbers of hotspots to which
mapped events are distributed whereas we want
to concentrate events around a small number of
hotspots. The larger the bucket size, the less the
number of hotspots which reduces the probability
of mappings. As a result, too low or high val-
ues for bucket size are both detrimental to the im-
provement of quality of results.
VEHITS 2019 - 5th International Conference on Vehicle Technology and Intelligent Transport Systems
122
0 3 5 10
40
50
60
70
80
Time flexibility (in min)
Success rate (in %)
0 100 200 400
40
50
60
70
80
Location flexibility (in m)
Success rate (in %)
high density low density every 10th
Figure 4: Success rates w. r. t. flexibility changes from Ta-
ble 1. Time and location flexibilities determine whether an
event can be mapped to another event or hotspot. There-
fore, when increasing one flexibility (time or location) while
keeping other parameters constant, we can observe better
success rates (default time flexibility: 5, default location
flexibility: 200). The category 0 functions as control group
and denotes the success rates without meeting points.
• If decide level radius is set to lower values, our
clustering post-processing stage becomes more
selective and as a result there are less hotspots to
map to.
• minPoints and ξ directly affect the outcome of
OPTICS and therefore the number of clusters.
Their values determine the number of clusters
which impacts the number of maps to hotspots
and the amount of success rate improvement.
• With mapping mode we observe that mapping to
request events is the main factor that impacts the
results and the addition of hotspots is an improve-
ment of these results. Mapping only to hotspots is
an improvement as well, but does not produce the
same high impact. As it turns out, there are many
unnecessary hotspots maps that do not improve
the efficiency but decrease the customer conve-
nience.
• Processing duration per request, capacity utiliza-
tion and ride delay benefit, for the most part, from
inclusion of meeting points.
• The percentage of shared rides decreases
marginally and this is in direct correlation with
time and location flexibility. With increasing flex-
ibilities we can bundle more events and requests,
which in return leave some of the non-mappable
requests alone during some parts of the schedule.
These, otherwise, would have shared the ride
with bundled requests.
• It may appear from Table 1 that the driven dis-
tances per vehicle increases with the meeting
points, but if we put it in perspective with the suc-
cess rate improvement, the vehicles are actually
driving less per satisfied request.
In general, we can conclude that the introduction of
meeting points is beneficial regarding the success rate
and service/vehicle costs, but comes at a price of cus-
tomer inconvenience due to slightly increased waiting
time and incurring walking legs to the pick-up and/or
from drop-off location. In best case, we observe an
14.15% improvement of success rate, when location
flexibility is set to 400 meters and time flexibility to
5 minutes (per event). In worst case, the increase of
waiting time amounts to 1.3 minutes, when location
flexibility is set to 200 meters and time flexibility to
10 minutes (per event).
5 CONCLUSION
The ride-sharing concept aims to assign multiple sim-
ilar trips to the same vehicle in order to better utilize
the resources. However, a naive realization of it might
cause many nearby location visits of the same vehicle.
This forces the vehicle to make small detours and/or
frequent stops, which reduces the overall efficiency
of the system. In this work, we investigated the possi-
bility of eliminating small detours and their resulting
consequences.
For a better user experience, we employ an online
ride-sharing approach: The trip requests are not col-
lected beforehand; but are unveiled in real-time, pro-
cessed in a few seconds and the response about the
vehicle assignment is given to the customer. Since
the knowledge about the world in which we are oper-
ating is always changing, we can only rely on existing
data about requests when determining flexible meet-
ing points. Therefore, our solution is based on map-
ping the pick-up and drop-off events of a new request
to those of accepted requests in a vehicle schedule,
if their spatio-temporal distances are within the speci-
On-demand Ride-sharing Services with Meeting Points
123
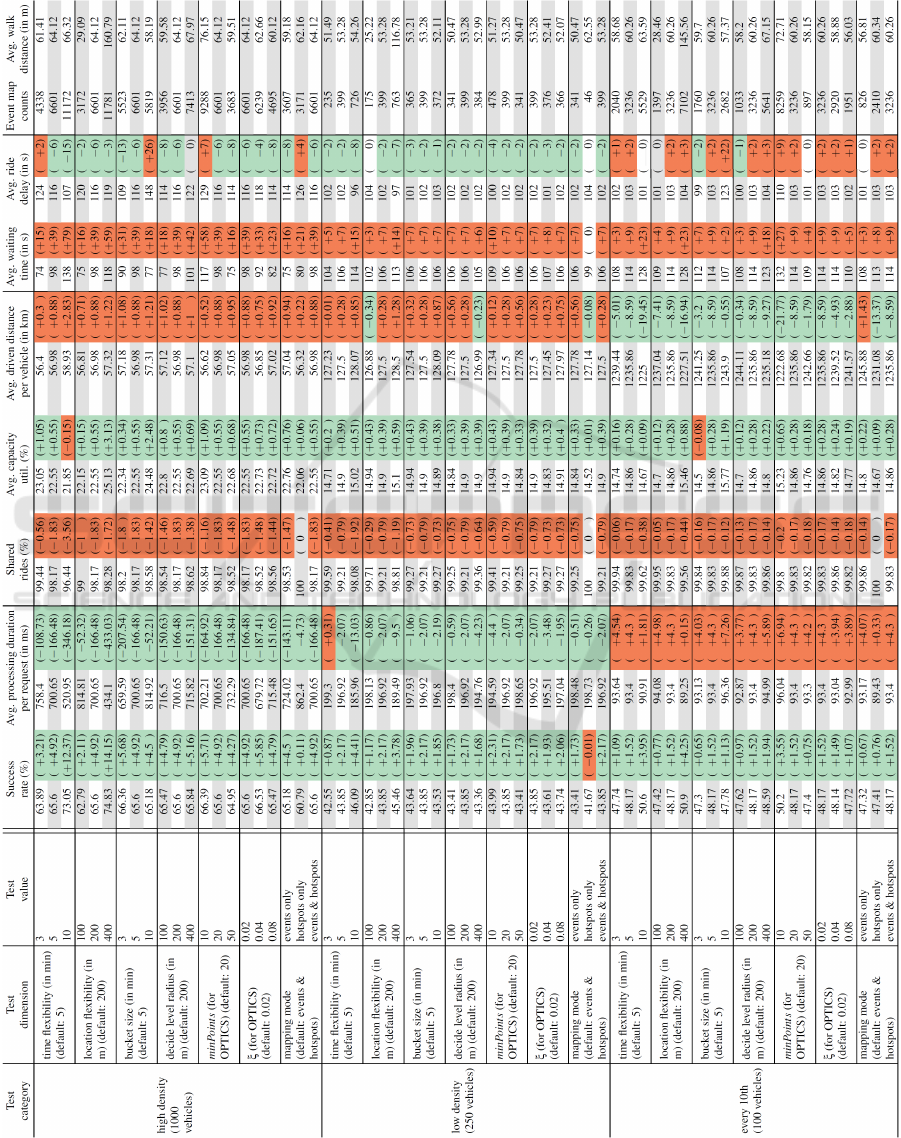
Table 1: Each cell contains a value that represents the result of the simulation with meeting points and another value within
parentheses that expresses the difference of the this value from the result of the simulation without meeting points. The green
(or red) cells indicate that the simulation with meeting points produced a better (or worse) result. In all tests, we set the vehicle
capacity to 10 and the slack time to 5 minutes.
VEHITS 2019 - 5th International Conference on Vehicle Technology and Intelligent Transport Systems
124

fied location and time flexibility thresholds. To reduce
the importance of initial requests which might shape
the schedule of a vehicle rather unfavourably, we
analyse historical request data to determine hotspots
in order to map initial request events to them, since
they function as meeting points as well. For the eval-
uation, we extract trip requests from New York City
taxi trip data and process them in two on-demand
ride-sharing simulations (i. e. with and without meet-
ing points). The results indicate that the addition of
meeting points is particularly beneficial during peak
times when demand is high and dense. We observe
that even if passengers are willing to walk short dis-
tances, the overall efficiency increases significantly
(with regards to success rate and vehicle costs). De-
crease in customer convenience can be counterbal-
anced by service providers offering financial incen-
tives (e. g. cheaper rides). We also identified some
drawbacks in our clustering and hotspot decision ap-
proach. Since this work was only a starting point, ad-
dressing this issue and improving this aspect are part
of future work.
REFERENCES
Ankerst, M., Breunig, M. M., Kriegel, H.-P., and Sander,
J. (1999). OPTICS: Ordering Points to Identify the
Clustering Structure. In Proceedings of the 1999 ACM
SIGMOD International Conference on Management
of Data, SIGMOD ’99, pages 49–60, New York, NY,
USA. ACM.
Czioska, P., Mattfeld, D. C., and Sester, M. (2017). GIS-
based identification and assessment of suitable meet-
ing point locations for ride-sharing. Transportation
Research Procedia, 22:314 – 324. 19th EURO Work-
ing Group on Transportation Meeting, EWGT2016, 5-
7 September 2016, Istanbul, Turkey.
Ester, M., Kriegel, H.-P., Sander, J., and Xu, X. (1996). A
Density-based Algorithm for Discovering Clusters in
Large Spatial Databases with Noise. In Proceedings
of the Second International Conference on Knowledge
Discovery and Data Mining, KDD’96, pages 226–
231. AAAI Press.
G
¨
okay, S., Heuvels, A., and Krempels, K. (2018). Heuris-
tics for Improving Trip-Vehicle Fitness in On-demand
Ride-Sharing Systems. In Proceedings of the 4th In-
ternational Conference on Vehicle Technology and In-
telligent Transport Systems, VEHITS 2018, Funchal,
Madeira, Portugal, March 16-18, 2018., pages 323–
334.
Grubesic, T. H., Wei, R., and Murray, A. T. (2014). Spatial
clustering overview and comparison: Accuracy, sensi-
tivity, and computational expense. Annals of the Asso-
ciation of American Geographers, 104(6):1134–1156.
Hansen, E., Gomm, M., Bullinger-Hoffmann, A., and
Moeslein, K. (2010). A community-based toolkit for
designing ride-sharing services: The case of a virtual
network of ride access points in Germany. Interna-
tional Journal of Innovation and Sustainable Devel-
opment, 5:80–99.
Hawkins, A. J. (2018 – accessed November 27, 2018).
Uber Express Pool offers the cheapest fares yet
in exchange for a little walking. Available at
https://www.theverge.com/2018/2/21/17020484/
uber-express-pool-launch-cities.
Li, R., Qin, L., Yu, J. X., and Mao, R. (2016). Optimal
multi-meeting-point route search. IEEE Transactions
on Knowledge and Data Engineering, 28(3):770–784.
Li, X., Hu, S., Fan, W., and Deng, K. (2018). Modeling
an enhanced ridesharing system with meet points and
time windows. PLOS ONE, 13(5):1–19.
MacQueen, J. (1967). Some methods for classification and
analysis of multivariate observations. In Proceed-
ings of the Fifth Berkeley Symposium on Mathemat-
ical Statistics and Probability, Volume 1: Statistics,
pages 281–297, Berkeley, Calif. University of Cali-
fornia Press.
Murray, A. and Grubesic, A. (2002). Identifying non-
hierarchical spatial clusters. International Journal
of Industrial Engineering : Theory Applications and
Practice, 9(1):86–95.
Schaller, B. (2018). The New Automobility: Lyft, Uber and
the Future of American Cities. Schaller Consulting.
Stiglic, M., Agatz, N., Savelsbergh, M., and Gradisar, M.
(2015). The Benefits of Meeting Points in Ride-
sharing Systems. ERIM Report Series Research in
Management ERS-2015-003-LIS, Erasmus Research
Institute of Management (ERIM), ERIM is the joint
research institute of the Rotterdam School of Manage-
ment, Erasmus University and the Erasmus School of
Economics (ESE) at Erasmus University Rotterdam.
Stock, E. (2018 – accessed November 27, 2018). In-
troducing Express POOL: Walk a little to save a
lot. Available at https://www.uber.com/newsroom/
expresspool/.
Transportation Research Board (2016). Shared Mobility
and the Transformation of Public Transit. The Na-
tional Academies Press, Washington, DC.
Tsubouchi, K., Yamato, H., and Hiekata, K. (2010). Inno-
vative on-demand bus system in Japan. IET Intelligent
Transport Systems, 4(4):270–279.
On-demand Ride-sharing Services with Meeting Points
125
