
Lane Accurate Detection of Map Changes
based on Low Cost Smartphone Data
Florian Jomrich
1,2
, Daniel Bischoff
1,2
, Steffen Knapp
1
, Tobias Meuser
2
, Bj
¨
orn Richerzhagen
2
and Ralf Steinmetz
2
1
Opel Automobile GmbH, 65423 R
¨
usselsheim, Germany
2
Multimedia Communications Lab (KOM), TU Darmstadt, 64283 Darmstadt, Germany
Keywords:
Map Change Detection, Low Cost, Smartphones, Sensor Fusion, Lane Change Detection.
Abstract:
Self-driving vehicles rely on High Definition Street Maps (HD Maps) to ensure the safety and comfort of their
driving capabilities. However, the road network infrastructure is subject to constant changes (e.g. through
constructions works, accidents, ...). Such changes have to be quickly identified to avoid dangerous driving
situations, for example through a reduction of driving speed or the safe handover of driving control back to
the human. To address this issue we propose a road hazard detection algorithm that identifies and marks the
extent of such changes based on crowdsourced GNSS data. To increase the detection speed of our proposed
algorithm, we only rely on sensor information in the collection process, that is not only available through
vehicles, but as well by cheap and ubiquitous devices carried on by the passengers such as smartphones. To
deal with the limited accuracy of the collected data, we enhance existing algorithmic clustering approaches
by leveraging additional meta-data such as the quality of the collected GNSS points and the vehicle’s current
lane position. Our concept is evaluated with real world measurements in a highway construction site scenario
showing improved performance in comparison to the Kernel Density Estimation reference algorithm, used
versatile in Related Work.
1 INTRODUCTION
Highly automated vehicles are currently a very promi-
nent research topic (Brenner and Herrmann, 2018).
To enable the respective functionality, cars rely on
a large variety of sensors like cameras, radar, ul-
tra sonic sensors or lidar (Ziegler and et al., 2014).
Given the complexity of certain traffic situations and
the limitations of individual sensors, current systems
further rely on a High Definition Street Map (HD
Map)(Madrigal, 2014; Miller, 2014). The HD Map
can be seen as an additional virtual sensor. It im-
proves the performance and accuracy of the car’s lo-
calization and classification capabilities (e.g., of road
signs). It further enables the car to anticipate upcom-
ing street curvatures, which are not yet detectable by
the on-board sensors. This enhances safety and com-
fort for the passengers, as the vehicle can compare
its own sensor readings with the digital reference pre-
sented by the map.
To initially create HD Maps, specialized vehi-
cles with expensive measurement equipment are used.
These cars can rely on costly, high-precision sensors
like Differential GPS (DGPS) and laser scanners to
obtain precise measurement data.
However, the road infrastructure is permanently
changing (Plack, 2013). Highly automated vehicles
are only able to perform correct driving manoeuvres
based on correct, up to date map material. This makes
old and outdated information in the HD map a very
challenging problem(Rabel, 2017).
Several approaches have already been proposed
to leverage the global navigation satellite system
(GNSS) data obtained from common production ve-
hicles to create or update standard navigation maps
(Br
¨
untrup and et al., 2005; Nieh
¨
ofer and et al., 2009;
Cao and Krumm, 2009; Davies and et al., 2006;
Ahmed and et al., 2015). However, these approaches
did not address the time critical conditions to pre-
cisely identify road hazards, necessary to ensure the
safety of self-driving cars requiring an update of their
HD map material.
To close this research gap, we argue that any ad-
ditional sensor device that is carried by the passen-
gers, capable of collecting GNSS data, should be con-
sidered in the detection process of outdated HD Map
126
Jomrich, F., Bischoff, D., Knapp, S., Meuser, T., Richerzhagen, B. and Steinmetz, R.
Lane Accurate Detection of Map Changes based on Low Cost Smartphone Data.
DOI: 10.5220/0007709401260137
In Proceedings of the 5th International Conference on Vehicle Technology and Intelligent Transport Systems (VEHITS 2019), pages 126-137
ISBN: 978-989-758-374-2
Copyright
c
2019 by SCITEPRESS – Science and Technology Publications, Lda. All rights reserved

material. As such devices are ubiquitously carried by
humans, they can tremendously increase the detection
speed of road hazards to ensure the overall driving
safety of self-driving vehicles. Therefore, we rely in
our presented work only on low precision GNSS sen-
sor readings obtained by smartphones carried inside
of a vehicle, as an example of such ubiquitous de-
vices. We further use readings from additional low
cost sensors available in the smartphones as meta-
information to enhance the overall precision of the
collected GNSS data. Based on this additional meta-
information we present a novel weighting algorithm
for the clustering procedure of GNSS data. Our algo-
rithm outperforms existing approaches in the creation
of lane-accurate clustering results, as evaluated with
real-world measurements in a highway construction
site scenario.
Based on the proposed weighting algorithm, we
present our second contribution, an algorithm that is
able to quickly identify lane accurate deviations in the
road network infrastructure. The detection is based on
the deviation between former obtained clustering re-
sults and the latest collected data as well as the overall
deviation in the average speed of the vehicles between
those two states over time. The performance of the al-
gorithm is evaluated in the aforementioned scenario.
The identified areas in the outdated HD map thus can
be safely avoided by handing over the driving con-
trol back to the human driver. Furthermore the iden-
tified HD Map areas can be updated more quickly, by
specifically requesting precise sensor readings from
the measuring vehicles for them.
After this introduction our paper is structured as
follows. In Section 2 we discuss related work for map
generation and updating from crowdsourced GNSS
traces and the utilization of low cost sensors to im-
prove localization. Based on our survey of related
work, we present our concept for map change detec-
tion consisting of a clustering algorithm enhancement
relying on meta information (Sec. 3) and a deviation
detection algorithm (Sec. 4). The real world scenario
used to evaluate the performance of our proposed al-
gorithms is described in Section 5. We evaluate our
proposed algorithm in Section 6, verifying that the
consideration of meta-information achieves improved
clustering and detection performance compared to ex-
isting approaches. We finally conclude the paper in
Section 7.
2 RELATED WORK
In the following, we structure and discuss related
work for map creation and map updates according to
the achieved accuracy (road- or lane-level) and uti-
lized sensor equipment.
2.1 Road-level Map Generation with
Floating Car Data
(Br
¨
untrup and et al., 2005) as well as (Nieh
¨
ofer and
et al., 2009) propose a client/server-based architecture
that infers the road infrastructure given GNSS traces
of an unknown area. Niehofer et al. explicitly utilize
GNSS data collected with mobile phones, supporting
our own work. The traces are used to either (i) create
a completely new road in the network or (ii) gradually
update an existing road with further data points. (Cao
and Krumm, 2009) rely on a fleet of taxis to acquire
their testing data to create road maps. Their approach
to infer route data from GNSS traces is innovative by
performing so called energy well calculations to as-
sign newly arriving trace data to existing clustering
results while altering that data as well. These con-
cepts of gradually updating the already obtained clus-
tering results, to save time, inspired the development
of our own deviation detection algorithm. (Davies and
et al., 2006) present a framework to create road accu-
rate maps out of collected floating car data. The au-
thors state that modern day GNSS receivers (based on
the publications of (K.D. McDonlad and C. Hegarty,
2000) and (R. Prasad and M.Ruggieri, 2005)) have an
average standard deviation σ between 3.5 and 4.5 me-
ters. They further state that based on the central limit
theorem more than 70 GNSS traces would need to be
collected to differentiate between two adjacent roads
(not lanes as required for self-driving vehicles). Our
work aims to avoid these limits by not only relying on
GNSS trace data alone, but on fusing the readings of
several low cost sensors together with it.
A comparison of the aforementioned approaches
and further works is presented by (Ahmed and et al.,
2015). The authors provide OpenStreetMap bench-
mark material and evaluate the algorithms’ runtime,
ranging from several minutes to several hours. Their
results motivate the necessity for the development of
performance optimized map updating algorithms.
All of the aforementioned approaches only
achieve road-level accuracy, relying solely on GNSS
data. To identify temporary changes in the road
infrastructure—e.g., construction sites— to ensure
the safety of self-driving vehicles, at least lane-level
accuracy is required.
2.2 Lane Accurate Map Generation
One of the first concepts for the automated creation
of lane accurate street maps was proposed by (Betaille
Lane Accurate Detection of Map Changes based on Low Cost Smartphone Data
127
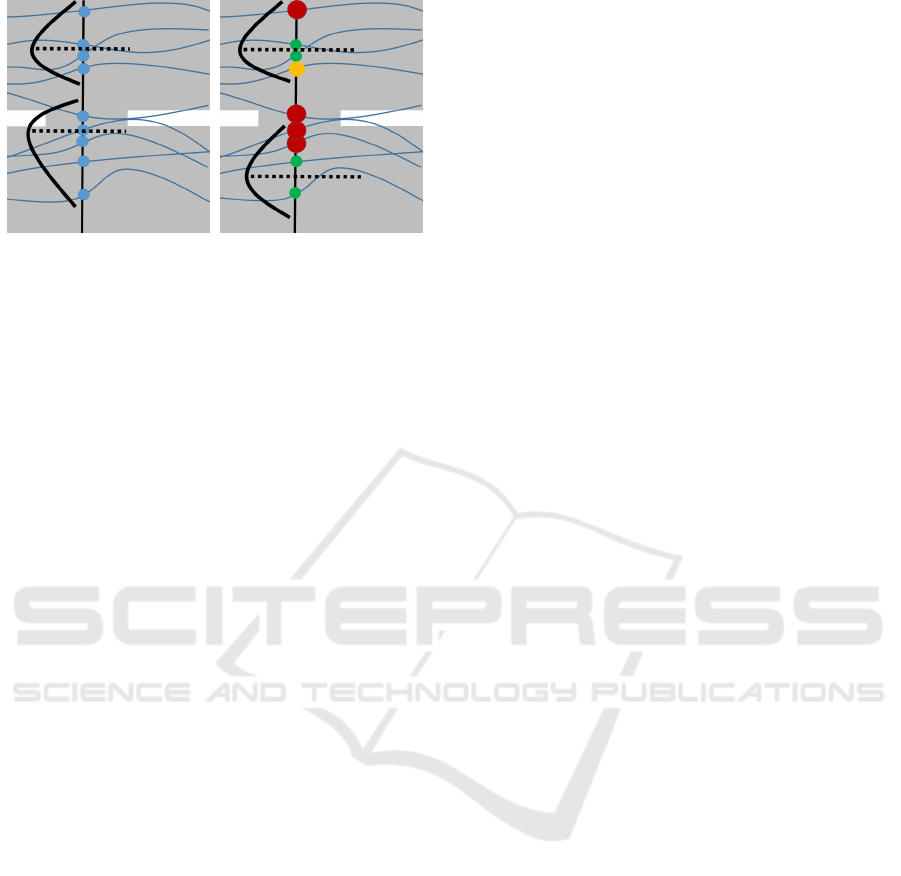
(a) Common approach
(b) Weighted approach
Figure 1: Illustration of lane center point calculation ap-
proaches. In our weighted approach points accuracy are in-
dicated by colour and radius.
and Toledo-Moreo, 2010). In their work they focus on
the definition of a lane accurate map and its general
creation procedure. To achieve the technically best
possible results the authors rely on the coupling of
high accurate kinematic GPS (PPK) with dead reck-
oning estimations of the vehicle itself. The required
precise hardware is resembling more the costly equip-
ment used in the aforementioned specialized measur-
ing vehicles to create the HD maps. It is out of the
scope of our personal work, as we focus to quickly
detect changes in the HD map material using widely
available sensor data.
(Chen and Krumm, 2010) propose an algorithm
to infer lane accurate road networks from a multitude
of GNSS traces through the use of Gaussian Mixture
Models. The authors preprocess their GNSS traces by
virtually segmenting them through equidistant (e.g.
each 50 meters) perpendicular lines across all lanes
in the driving direction of the vehicles (see Fig. 1a).
Therefore, a random trace is selected as reference and
segmented in equidistances. All other traces are then
cut accordingly. The resulting intersection points of
all traces are then used for the following clustering
procedure. This initial concept is also used simi-
larly in several other works(Uduwaragoda and et al.,
2013),(Neuhold and et al., 2017),(Sato and et al.,
2012). Consequently, we use it as a well established
foundation for our own approach described in Sec-
tion 3.2. Chen et al. cluster the intersection points us-
ing Gaussian Mixture Models to identify center points
of individual lanes. To test their approach the au-
thors collected data from a fleet of 55 vehicles, each
equipped with a standard GPS logger comparable to
today’s chips built into smartphones. Although the
authors do not investigate changes of road networks
in their work, they state it as necessary future work,
motivating our own contribution.
More recent approaches closely related to our
own contribution are presented in (Uduwaragoda
and et al., 2013) and (Neuhold and et al., 2017).
Uduwaragoda et al. propose the usage of the Ker-
nel Density Estimation Algorithm (KDE) to identify
the center lanes of a common 4-5 lane width high-
way. They test their concept based on trace data that
has been collected from a fleet of vehicles carrying
GPS enabled phones. The authors state that at least
150 traces collected by their vehicles are necessary to
achieve a suitable lane detection accuracy in their sce-
nario. (Neuhold and et al., 2017) achieve similar re-
sults using KDE in different scenarios and with differ-
ent GPS loggers. They still have to rely on a large set
of traces (80 − 200) for accurate lane detection. Fur-
thermore, they utilize information on legally required
distances between lanes to increase the performance
of their algorithm.
An approach that relies on the fusion of different
sensors is presented by Guo et al. (Guo and et al.,
2016). They use information from a low-cost GNSS
sensor, an inertial measurement system, and ortho-
graphic images provided by the on-board camera to
create lane specific graphs as foundation for a com-
plete map. Massow et al. (Massow and et al., 2016)
also significantly enhance the performance of a pure
GNSS-based approach by using additional sensors
like a camera and a radar. Both, (Guo and et al., 2016)
and (Massow and et al., 2016) support the concept of
utilizing additional sensors to improve the accuracy of
clustering approaches for lane detection. Radar and
camera sensors, however, are rather expensive and
also only available in a fraction of currently deployed
vehicles. In the following we present works that rely
on low cost sensor equipment to achieve accurate lo-
calization.
2.3 Lane Accurate Localization with
Low Cost Sensors
Two of the most sophisticated works regarding the
lane accurate localization of a vehicle using only low
cost hardware have been performed independently
from each other by Aly et al. (Aly and et al., 2015)
and Wu et al. (Wu and et al., 2016). The authors
rely on cheap accelerometer and gyroscope sensors,
which are present in production vehicles and mobile
devices as used in our work. Their proposed solu-
tions do not require knowledge of the initial start-
ing position of the car. Instead, a Markov localiza-
tion model or a Gaussian probability distribution is
used to keep track of all possible initial lane positions.
Through the accelerometer and the gyroscope sensors
the drivers behavior can be identified (e.g. perform-
ing a certain pattern of lane changes as presented in
Figure 2). Thereby, the probability of presence for
VEHITS 2019 - 5th International Conference on Vehicle Technology and Intelligent Transport Systems
128

each lane increases or decrease over time with only
a single remaining lane in the end. To further im-
prove this concept, Aly et al. suggest to use additional
knowledge in the form of so called bootstrap and or-
ganic anchors. Boostrap anchors rely on traffic rules,
e.g., a right turn is normally performed on the right-
most lane. Organic anchors are conditions on the road
surface, e.g. a pothole, that can also be detected by
these two sensors. The appearances of such anchors
can then be linked to certain lanes. Both approaches
achieve a lane identification rate of between 80% and
86%. Comparable work regarding the identification
of steering manoeuvres has been proposed by Chen
et al. (Chen and et al., 2015). They compare their
detection algorithm with a camera-based approach.
The comparison shows the robustness of the detection
based on low cost sensors, as they are independent
from weather effects like sun blinding, rain, fog, and
the day and night cycle. In a similar work, Ahmed
et al. (Ahmed and et al., 2017) propose to utilize
the On-board Diagnostic Interface (OBD) for addi-
tional sensor information. However, this approach re-
quires additional dedicated hardware in the vehicle.
As discussed, existing approaches for lane-level accu-
racy either require dedicated—and potentially expen-
sive or unavailable—sensors (Guo and et al., 2016;
Massow and et al., 2016) or a large amount of traces
used in the clustering process (Davies and et al., 2006;
Uduwaragoda and et al., 2013). Both issues prevent
a fast detection of temporary situations such as con-
struction sites or accidents. Other approaches rely on
assumptions that are not fulfilled under such condi-
tions, such as the correlation between the centers of
the different lanes as utilized in (Neuhold and et al.,
2017). The utilization of additional, low cost sen-
sor data from mobile phones as proposed in (Liu and
et al., 2017; Aly and et al., 2015; Wu and et al., 2016)
is a promising direction to achieve the desired accu-
racy and speed of a map change detection algorithm.
Based on their work using a similar lane change algo-
rithm, we detail our concepts for enhanced clustering
and deviation detection in the following sections.
3 ENHANCED CLUSTERING
WITH META INFORMATION
As motivated in the previous section, we combine
GNSS measurements with low cost sensor data (meta
information) to achieve precise clustering results on
lane-level. We propose to use the following additional
information: (i) the number of visible GNSS satellites
(Sec. 3.1), (ii) an estimation of the position error pro-
vided by the mobile device (Sec. 3.2), and (iii) the
accelerometer and the gyroscope of the smartphones
to detect lane changes and derive the current lane po-
sition based on (Aly and et al., 2015; Wu and et al.,
2016) (Sec. 3.3).
3.1 Number of Satellites and Accuracy
Parameters
To achieve a proper position estimation a GNSS de-
vice requires at least four satellites to be visible. If
more satellites are visible the devices are able to fur-
ther improve the position estimate with information
from the additional satellites. Current GNSS devices
provide an accuracy estimation with each position re-
turned via their APIs (van Diggelen, 2007). The cal-
culation of this accuracy estimation is at the discretion
of the device manufacturer and, therefore, can dif-
fer. The API provided by Android smartphones used
in our work specifies the position accuracy as a one
sigma (68%) reliability estimation of the horizontal
accuracy.
1
Consequently, the estimated position lies
with a probability of 68% within a circle of the indi-
cated accuracy radius around the estimated position.
In the following, we argue that a higher estimated
precision and a higher number of satellites corre-
lates with a position estimate of higher quality, which
should be considered more important for the overall
lane clustering procedure. We leverage this informa-
tion to achieve better clustering results in less time as
explained in the next section.
3.2 Proposed Weighted Clustering
Approach
To reduce the amount of GNSS traces that are re-
quired to properly identify changes on the lane-level,
we introduce a weighting factor into the common
clustering approach (Chen and Krumm, 2010). We
automatically annotate the measured GNSS position
estimates with the number of satellites and achieved
position accuracy for further consideration. In con-
trast to the common clustering approach(Chen and
Krumm, 2010), as explained in Section 2.2 (see Fig-
ure 1a as well), we do not select a random trace as
reference line. Instead, we select the trace that has the
highest number of satellites and accuracy as reported
by the mobile device. We assume that this trace will
mimic the overall road curvature best and therefore
improves the initial segmentation and the creation of
segment lines. As not all measured GNSS points are
directly located at a segmentation line, we generate
1
https://developer.android.com/reference/android/
location/Location.html
Lane Accurate Detection of Map Changes based on Low Cost Smartphone Data
129

artificial GNSS intersection points. As described by
Equation 1 the meta information values of those arti-
ficial intersection points are calculated with respect to
the euclidean distance (d) of the closest preceding and
succeeding measured points and their actual values.
To complete the clustering process we then apply the
weighted mean as shown in Equation 2 for each of the
segments. The weighting function ( f
w
) is supposed to
be adapted accordingly to the available GNSS data.
In our evaluation in Section 6.3 we investigate differ-
ent weighting functions to find the one with the best
performance for our data set. This way the latitude
and longitude values of the related GNSS estimation
are weighted depending on their overall quality. The
concept is illustrated in Figure 1b, where the overall
quality of the position estimates is indicated by their
radius and colour. We assume and verify in our eval-
uation that even with a smaller number of collected
traces more precise results are achieved, as the points
with overall better accuracy are taken into higher con-
sideration during clustering.
meta value
intersection point
(acc,no o f sattelites) =
meta value
pre
∗ d
pre
+ meta value
succ
∗ d
succ
d
pre
+ d
succ
(1)
clustercenter(lat,lon) =
∑
(lat,lon) ∗ f
w
(accuracy,no o f sattelites)
∑
allweights
(2)
3.3 Annotation of Lane Numbers in the
Traces
Even with the additional quality parameters the iden-
tification of distinct lanes from noisy GNSS data is
still a difficult task. Common clustering approaches
overcome this problem through the sheer amount of
data points (Uduwaragoda and et al., 2013) that are
collected over time. However, this is a serious is-
sue for the detection of temporary deviations as con-
sidered in our work. To address this issue, we uti-
lize a lane change detection algorithm as proposed
in the related work (see Sec. 2.3) utilizing only low-
cost, low-energy accelerometer and gyroscope sen-
sors. Thereby, we can rely on the estimated lane num-
ber as additional meta information annotated to the
GNSS data.
For our evaluation we implemented a basic lane
change detection algorithm, similar to the ones pro-
posed by Aly et al.(Aly and et al., 2015) and Wu et
al. (Wu and et al., 2016), from which we derive the
vehicles current lane number. The algorithm relies
Figure 2: Behaviour of the accelerometer sensor, when per-
forming lane changes.
on the combined sensor readings of the accelerome-
ter and gyroscope of the smartphone and detects lane
changes based on a static-offset gate of the measured
min and max values per time interval. An example ac-
celerometer reading based on our personal data set is
shown in Figure 2. The picture has been created with-
out any further noise filtering. Thus it shows very well
the capabilities of such sensors to properly detect sev-
eral consecutive lane changes and accordingly iden-
tify the vehicles current lane. Therefore we see the
Related Works of Aly and Wu as a prerequisite for
our personal work. In this paper we showcase the fea-
sibility of such a lane change detection approach in
our context of map change detection. Therefore the
comparison to our manually annotated ground truth
as investigated in Section 6.2 is its main purpose. The
discussed results show, that even our rather simple ap-
proach already achieved a good detection rate. Fur-
ther improvements regarding the lane position detec-
tion as suggested by Aly and Wu probably will im-
prove the achievable clustering results even more.
With the identification of lane changes and the de-
rived annotation of the car’s lane position, we enable
our algorithm to directly separate our collected GNSS
data regarding a specific lane. As evaluated in Section
6.1 this provides our proposed concept with a signif-
icant advantage over related clustering concepts, like
the Kernel Density Estimation algorithm, which do
not rely on lane information. Even over a longer pe-
riod of collection time we consider this an important
advantage for our own approach as it cancels out most
of the influence of present Gaussian noise in the col-
lected GNSS data.
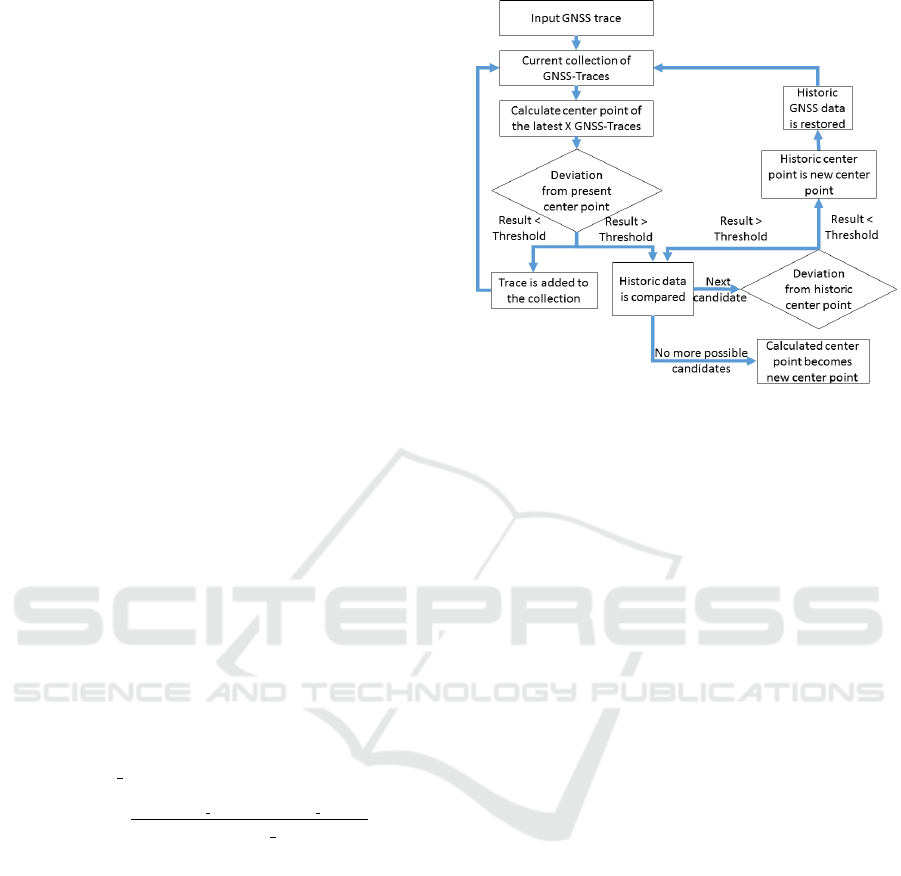
4 ROAD INFRASTRUCTURE
DEVIATION DETECTION
Based upon the aforementioned enhancements of the
clustering procedure, we developed an algorithm to
reliably detect lane accurate changes in the road net-
VEHITS 2019 - 5th International Conference on Vehicle Technology and Intelligent Transport Systems
130
work (e.g. introduced through construction sites or
accidents) as the second contribution of this work.
The algorithm identifies and highlights those areas,
where a certain deviation between historic and newly
generated clustering results is detected. The com-
plete procedure is illustrated in Figure 3. First of
all the track to be considered for the clustering pro-
cedure has to be segmented as described in Section
3.2. For each segment and each lane a distinct lane-
segment center point has to be calculated. The en-
tirety of all those center points represents the curva-
ture of the specific lane. Initially, the newly calculated
center point is marked as unreliable until a certain
amount of traces X is available for the clustering pro-
cedure to reduce the influence of faulty sensors and
the overall Gaussian noise. The exact number of re-
quired traces should be derived individually from the
amount of incoming traces over time and the accuracy
requirements of the clustering result. We investigate
it for our own dataset in Section 6.4. The flowchart
of Figure 3 now describes the procedure how further
traces are added to the dataset. For each new trace,
the trace itself and the last X traces are considered as
input for the clustering process. The influence of the
last X traces thereby is weighed based on their col-
lection time as described by Formula 3. New traces
are considered more valuable and degrade in impor-
tance over time. The importance of a trace thereby is
also dependent on its quality values (accuracy, no of
satellites) combined in a weighting factor w
meta
. The
degradation factor has to be selected individually de-
pending on the amount of incoming traces over time
as some streets are roamed less frequently than others.
importance trace
x
=
w
meta
∗ e
(time
trace x
−time
newest trace
)
2
degradation f actor
(3)
If the newly obtained clustering result deviates by
a threshold value T from the currently assumed lane
center point, a deviation is assumed to be present. In
our example evaluation described in Section 6.7 we
considered a value of 2/3 ∗ lanewidth for T , as the
width of a lane accepted by the road authorities can
be significantly lower. We consider this value there-
fore as a first proposal that is to be further optimized
in future work. The old center point is then added
to a vector of historic center points. If this history
storage already contains other old center points the
new clustering result is further compared with each
of them by calculating their deviation T . If for one
of them the achieved value is smaller than T it is as-
sumed to be the new lane center point. This way our
algorithm is able to handle situations in which a con-
struction site has been finished and the old road course
Figure 3: Deviation detection algorithm.
is present again, without starting the initial collection
process once again. If no fitting historic lane centers
are present, the newly calculated clustering result is
assumed to be the new lane center point for its related
segment on the highway.
Besides the longitudinal deviation along a track
our algorithm also has to provide the latitudinal ex-
tend of the detected road hazard. Only through an
early warning ahead of the road hazard a safe han-
dover from the self-driving vehicles back to a hu-
man driver can be ensured. Our proposed algorithm
therefore additionally considers the average achieved
speed for each lane segment along the track to identify
the actual extent of the detected construction side or
similar road hazard. As the speed is normally gradu-
ally reduced before a construction side (e.g. from 120
km/h down to 80 or 60 km/h) and then increased again
to its former value it provides a good indicator for be-
gin and end of the construction site. The achieved
results for our evaluation are presented in Figure 11.
Our algorithm only indicates the presence of a con-
structions side if both detection conditions are met.
Therefore the average speed at the considered track
segment has to be suitably reduced (80 km/h or be-
low) and a certain deviation in the road course has to
be present. Otherwise a false detection could be pos-
sible. A reduction of speed for example could also be
induced by a common traffic jam in the morning rush
hour.
5 SCENARIO DESCRIPTION
To investigate the performance of our proposed de-
viation detection algorithm in a real-world scenario,
Lane Accurate Detection of Map Changes based on Low Cost Smartphone Data
131

we performed several test drives, to collect data from
construction sites. The dataset, which we used for this
publication, contains over 1.934.000 GNSS points.
It will be published on github
2
to provide bench-
mark material for future algorithms in this field of re-
search. Each data point is annotated with our consid-
ered meta-information (the vehicles current lane, the
GNSS position’s accuracy value and the number of
available satellites). Furthermore we manually tagged
the start and the end of each experienced construction
site to later rely on as ground truth. The measurement
points have been collected from April 2016 to Jan-
uary 2017. Within this time over a dozen construc-
tions sites have been added into the dataset, located
in urban, suburban and rural areas. To illustrate the
capabilities of our approach and the developed algo-
rithm we show the results accordingly for a construc-
tion site on the German highway A67 between the
cities of R
¨
usselsheim and Darmstadt as illustrated by
Figure 11. GNSS traces have been collected in both
directions, with 369 traces in the direction to Darm-
stadt and 292 in the direction to R
¨
usslesheim. For
the following graphs we present the achieved results
of the driving direction from R
¨
usselsheim to Darm-
stadt. We ensured to have a sufficiently large amount
of traces for each of the lanes of this two lane highway
to be able to evaluate the benefits of our lane accurate
filtering of the GNSS data.
To resemble an actual large scale deployment of
our approach several different smartphones (Nexus 4,
Nexus 5, Blackberry Classic and Samsung Galaxy
S7) with different quality levels of GNSS sensors
have been used to collect the location data. These
phones therefore were placed on the dashboards of the
probe vehicles to resemble a possible usage scenario
of the end-customers.
6 EVALUATION
We selected the Kernel Density Estimation Algorithm
(KDE) as reference algorithm, as it is the most fre-
quently used and best performing algorithm through-
out the Related Work presented in Section 2. To com-
pare the results of the KDE clustering algorithm with
our approach, we manually annotated a reference line
located on the center dashed line of the highway using
satellite images (see Figure 4). To be able to safely
perform its driving task an automated vehicle has to
stay in the boundaries of its current lane. Therefore
we chose the deviation of the calculated lane center
lines provided by the investigated algorithms and this
2
https://github.com/florianjomrich/
construction side traces fjom
Figure 4: Reference line created from satellite images of the
center dashed line.
reference line in the middle of the two lane highway,
as our performance metric. This initial performance
evaluation, described in the following paragraphs was
executed on a section of the highway A67, where no
construction side was present. That way we could rely
in our evaluation on the rules of federal regulation in
Germany. They require each lane of our investigated
two lane highway to be exactly 3.75 meters wide.
3
An
ideal clustering algorithm therefore would achieve a
calculated deviation from all its predicted lane center
points to the reference line of 1.85 meters. These op-
timums are indicated by dashed lines in the following
plots. Figure 5 shows the achieved results for both
lanes of the highway and all our investigated algo-
rithm combinations. It is explained in detail in the
following.
6.1 Effect of the Lane Annotation
In a first step we evaluated the influence of the lane in-
dex parameter for each collected GNSS point on the
final clustering results. This index number enables
the filtering of GNSS traces initially regarding their
specific lanes before the data is handed over to the
clustering algorithm. Therefore the lane changes dur-
ing the test drives had been automatically annotated
through our described algorithm (see Section 3.3), as
well as manually by the push of an according button
for a ground truth comparison. The results presented
in the plots of Figure 5 are based on all 369 traces
that have been collected for the driving direction from
R
¨
usselsheim to Darmstadt on the A67. To avoid the
malicious influence of GNSS points that might have
been collected exactly during a lane change our data
filtering algorithm neglected those points. The three
points, which are measured directly previous to, dur-
ing the lane change and directly afterwards are re-
moved from the lane specific data set. To compare
the achievable clustering performance we executed a
common mean center point calculation algorithm for
each segment line using our lane specific filtered data.
As comparison the Kernel Density Estimation Algo-
rithm was executed on the same data, but without the
3
https://www.forschungsinformationssystem.de/servlet/
is/275112/
VEHITS 2019 - 5th International Conference on Vehicle Technology and Intelligent Transport Systems
132

Figure 5: Comparison of different algorithm clustering re-
sults for both lanes and all available traces.
lane filtering.
For both lanes it is clearly visible that prior filter-
ing based on lane annotations (as described in Section
3.3) has a significant impact on the obtained cluster-
ing accuracy. The variance of the obtained KDE cen-
ter points is much higher, than the simple mean cal-
culation approach executed on the pre-filtered data.
For some instances, the center point calculated by the
KDE algorithm lies outside of the actual lane bound-
aries. This is most likely due to bad reception ac-
curacy of GNSS receivers in current smartphones,
which can reach several meters. The simple mean
center point calculation, which could rely on our lane
specific pre filtered data, achieved much better vari-
ance values and stayed within the lane boundaries for
all 225 individual segments along our selected track.
Unexpectedly, the results obtained for the right lane
had a visible static offset to the middle of the road
towards the center line. The average of all estimated
center points on the left lane in contrast was (as ex-
pected) close to the actual center of the lane.
We investigated this phenomenon by executing
several drive tests (37 in total) for which the drivers
had been told to stay on the right lane for the whole
time of the track. The obtained results therefore are
shown in the lowermost plot of Figure 5. It is clearly
visible that this plot does not have the aforementioned
static offset. As a conclusion we suppose that the
difference in the obtained results is probably due to
the driving behavior of the test drivers and the col-
lection procedure of sensor data readings within our
Android smartphones. As the investigated scenario is
a two lane highway the right lane was mostly occu-
pied by slowly driving trucks. The test drives have
been conducted with common sedans from our fleet,
therefore most of the time these vehicles overtook the
slower driving trucks. In conclusion the vehicle ei-
ther stayed consistently on the left lane or drove on the
right lane with more interruptions due to lane changes
to overtake a truck. Within the Android smartphone
a Kalman filter is already smoothing the obtained
GNSS traces. In our opinion, the Kalman filter is
unable to capture two immediately consecutive lane
changes correctly, leading to the displacement of the
reported GNSS locations. This is an aspect that has
to be considered in future work, as one might want
to filter the incoming GNSS trace data accordingly.
The speed of the vehicles (trucks are slower than nor-
mal cars in average) and the previous driving behavior
(identifiable through other sensors like the accelerom-
eter and the gyroscope) are probably good indicators
therefore. Consequently, we present results based on
data gathered on the left lane of the highway for the
remainder of this evaluation.
6.2 Algorithmic vs. Manual Annotation
As a second step in our investigation we wanted to
compare the achievable accuracy results of our algo-
rithm induced lane annotation compared to the man-
ual annotated ground truth. This test was performed
to ensure that our proposed concept is also capable
to be deployed in future devices without the require-
ment of any mandatory input from the user. We im-
plemented the algorithm to automatically detect the
lane changes of the vehicle while driving based on
the status changes of the accelerometer and the gy-
roscope built into the smartphone, as described in
Section 3.3. The achieved results of the algorithmic
annotation in comparison to the manually annotation
of lane changes for both lanes are shown in Figure
5. It is clearly visible that both approaches perform
comparably well. There is no clearly better perform-
ing approach as for the left lane the results obtained
from the manually annotation seem to be slightly bet-
ter, whereas on the right lane the algorithmic anno-
tated results tend to be a bit better. The obtained re-
sults are very promising, as they showcase that an ac-
tual deployment of such a system is certainly possi-
ble. We assume the achievable results could be fur-
ther enhanced by optimisations in the lane change de-
tection. Our implementation for example, which was
purely based on static thresholds, performed consid-
erably good and might be further enhanced with dy-
namic speed dependent changes of the used thresh-
olds for the lane change indicators.
6.3 Impact of Weighting Functions
As the next step to improve the performance of our
lane clustering process even further we introduced
the aforementioned weighting concept for each col-
Lane Accurate Detection of Map Changes based on Low Cost Smartphone Data
133

Figure 6: Comparison of different weighting functions (left
lane data).
lected GNSS point. The weighting algorithm takes
the included meta data into account to calculate the
importance of each data point before the actual clus-
tering procedure is executed. It considers the number
of satellites, that were visible to the GNSS receiver
of the smartphone, as well as the accuracy value that
is provided by the Android API for each measured
GNSS point. As more available satellites tend to pro-
vide a better localisation we took their number di-
rectly into account for the weighting. The accuracy
value was considered inversely important as a smaller
accuracy means a more precise localisation.
To investigate the importance of both meta data
values, we evaluated different weighting functions
(see Formula 2), with the results being shown in Fig-
ure 6. The obtained results showcase that both, the
number of satellites and the accuracy, improve the
achievable precision, when considered with high im-
portance. For the comparison we again took all GNSS
points into consideration for the driving direction be-
tween R
¨
usselsheim and Darmstadt. We achieved the
best clustering performance with the parameters set
to weigh the Numbero f Satellites
3
or 2
Accuracy
. As
the configuration of 2
Accuracy
achieved less variance
we considered it as our reference weighting function
for the following evaluation steps. However, we see
these results still as a first investigative look and con-
sider further optimization potential in the weighting
procedure itself for future work.
6.4 Clustering Performance for
Different Numbers of Traces
As the required time to achieve a reasonable clus-
tering result is crucial for our use cases, we also in-
vestigated the behaviour of our proposed weighted
mean clustering algorithm when considering differ-
ent amounts of traces as input. The obtained results
Figure 7: Influence of different amounts of available input
traces on clustering performance (left lane data).
for the left lane of the highway A67 are presented in
Figure 7. From the different boxplots it is visible that
our weighted mean clustering approach reaches an ac-
curacy within the suggested lane boundaries reason-
able fast between 35 to 45 randomly selected traces.
By increasing the amount of random traces up to 90
we achieve only slight performance improvements in
comparison. Although the clustering approach clearly
benefits from a much higher number of traces as
shown by Figure 5, we can state that a difference de-
tection with an accuracy in the regions of the lane
width can be achieved much quicker. The overall
achievable performance can also be improved by se-
lecting only high quality traces as described in Sec-
tion 6.6. Future devices with a higher measuring ac-
curacy should obviously further reduce this required
number of traces.
6.5 Influence of Weighting on Lane
Filtered Data
Another question that we addressed in our work is the
impact of our additional meta information. We specif-
ically wanted to clarify if the information required for
the weighting procedure (number of satellites and the
accuracy) is worthy to consider for an initially lane-
filtered data set or if the lane filtering itself is the only
important factor required to achieve better clustering
results. Therefore we let our three algorithms (mean,
weighed mean and KDE) run on our full lane-filtered
data set. The achieved results are presented in Figure
8.
As expected the results of the KDE clustering al-
gorithm also benefited from the lane filtering pro-
cess. However its achieved clustering performance is
comparable to the standard mean calculation, which
achieves a much better execution time performance
compared to the KDE. The weighed mean achieved
VEHITS 2019 - 5th International Conference on Vehicle Technology and Intelligent Transport Systems
134

Figure 8: Comparison between weighting and non-
weighting algorithms using all available pre-lane filtered
traces (left lane data).
the best clustering results based on our collected
GNSS traces. We are well aware that other works
might have achieved better overall performance re-
sults as they are highly dependent on the used hard-
ware. However, based on our results we could ver-
ify the performance improvements achievable with
the consideration of meta-data, even when relying on
a largely varying set of measurement devices as de-
scribed in Section 5. Furthermore, we did not take any
dependencies between the two calculated lane center
points into account, as done by other Related Work
(Neuhold and et al., 2017). We did not rely on them
to achieve our results, as these conditions might not
hold true in our considered scenarios of construction
works and accidents.
6.6 Influence of Trace Selection
Motivated from our previous results, we investigated
the influence of the overall quality of the collected
traces. Therefore we conducted a test where we com-
pared the 70 most accurate (best) traces of our full
data set with another set of 70 randomly chosen traces
(see Figure 9). The amount of 70 best traces was se-
lected, as our investigation indicated that at around
this amount of traces the achievable accuracy satu-
rated in our clustering approach. Thus, we assumed
that a lot more traces would be required to further im-
prove the clustering results. As time is a critical factor
in the updating procedure of a map regarding a con-
struction side or an accident this aspect was critical
for us to be investigated. The best traces were selected
based on the average accuracy of all their interception
points with the created segment lines. The trace with
the lowest average in those 225 points is the best trace
of our data set. Figure 9 clearly shows that the selec-
tion of traces has a significant impact on the quality of
Figure 9: Performance comparison between randomly se-
lected traces and the most accurate available traces (left lane
data).
the clustering result. As expected the selection of best
traces achieved a significantly better clustering result
than the other group based on a random selection. In-
terestingly, the 70 selected traces achieved compara-
bly good performance results as using all traces that
we could collect (indicated by two upmosts plot in
Figure 9). This strengthens our initial assumption. As
a conclusion it might be well worthy to consider only
a high qualitative subset of all collected traces in a
continuous updating procedure over a long period of
time, with many cars driving by, to successfully and
efficiently maintain an accurate update of the current
status of the road network. If new traces do not show
any significant sign of deviation from the current clus-
tering results or they are not much better in the av-
erage of their overall achieved accuracy values, they
might possibly be neglected as well. However, further
investigation in future work with a larger set of traces
is required to verify this observation.
6.7 Construction Site and Deviation
Detection
Based on the positive results obtained from the previ-
ously described evaluation steps we than further con-
tinued the evaluation of our deviation detection algo-
rithm. We evaluated the first performance results of
our algorithm in an example scenario on a different
part of the highway A67, where a construction site
was present in May 2016, as illustrated by the Google
Earth satellite images in Figure 10 and 11. The inves-
tigated scenario shows the feasibility of our deviation
detection algorithm to react on updates of the road
structure very quickly as the provided data set for this
section of the highway with its specific construction
side status contained only a rather small data set of
15-25 GNSS traces per lane. Even with this small
Lane Accurate Detection of Map Changes based on Low Cost Smartphone Data
135
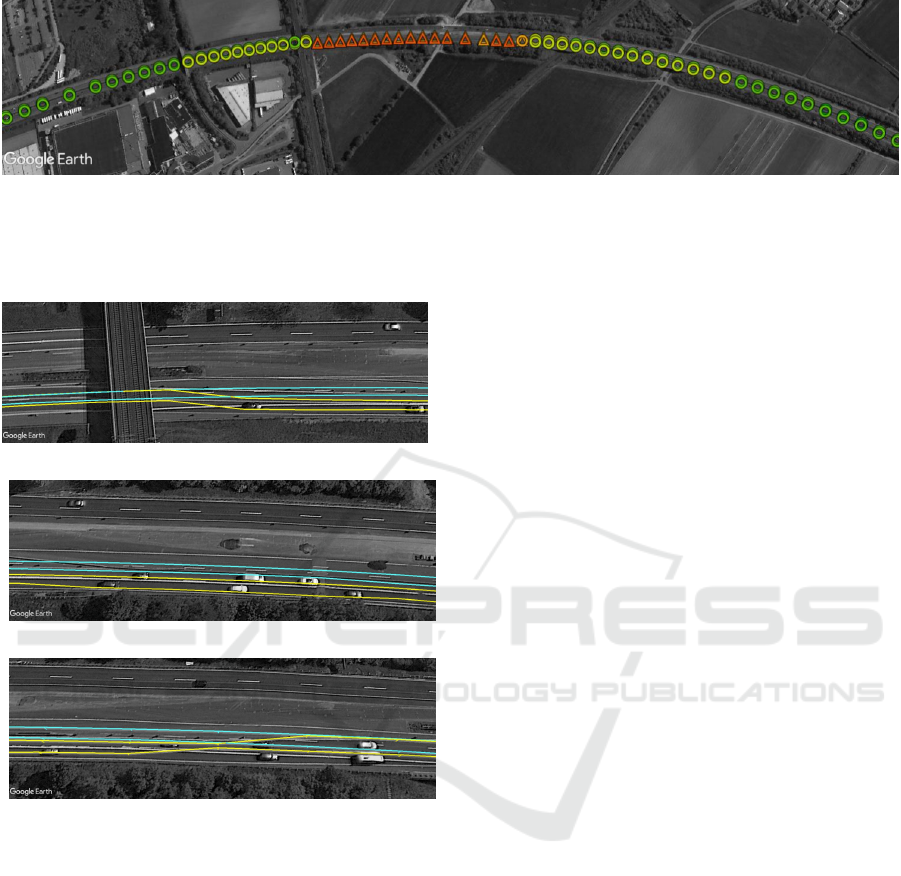
Figure 11: Correlation between the average vehicles speed (indicated by colour) and the location of the construction side
(indicated by triangles). Speeds right before and in the construction side range from 90 km/h down to 57 km/h (yellow - red).
Before and after the construction side normal driving speeds of around 125 km/h are reached in average (green).
(a) Start
(b) Middle
(c) End
Figure 10: Sections of the investigated construction site
(yellow) in correlation with the situation after the comple-
tion (cyan).
amount of data our algorithm was able to resemble the
entrance and the course of the construction side well
and stays in the given lane boundaries in each consid-
ered segment. Only at the exit of the construction side
is an unrealistic assumed distance between the two
lane center points visible. We propose to avoid such
situations by relying only on a larger subset of traces,
as investigated for our dataset in Section 6.4. The in-
troduction of a minimum distance condition between
the two adjacent lanes in the post processing of the
GNSS data is considered as part of our future work.
A further reduction of the distance between two adja-
cent clustering segments in a detected deviation envi-
ronment could probably also improve the achievable
performance.
7 CONCLUSION AND FUTURE
WORK
Within this work we presented our deviation detection
algorithm to detect and visualize the extend of con-
struction sites and other road hazards on a lane accu-
rate level. This algorithm has been designed with the
usage scenario of frequent HD-Map updates in mind.
Such lane accurate maps are required to improve the
safety and comfort while driving highly automated.
To ensure the accuracy of such maps time critical map
updates are required.
Our deviation detection algorithm mainly bene-
fits from improvements in the general clustering pro-
cess required for identifying the current lane curva-
ture. These are namely the usage of available meta-
information such as the number of available satel-
lites, the accuracy of the obtained GNSS location
and the current lane in which the vehicle was driv-
ing at that point in time. This meta-information is
used to improve the commonly known clustering pro-
cess of the collected GNSS traces as described in the
Related Work (Chen and Krumm, 2010). We eval-
uated the benefits of this additional meta-data in a
comparison of our own processing pipeline with the
state of the art Kernel Density Estimation clustering
algorithm, showing significant performance improve-
ments. The evaluation procedure was based on a large
self-collected GNSS data set, which was obtained
from common smartphones in a highway driving sce-
nario. We discuss and evaluate in this work that such
cheap mobile devices can provide lane-accurate lo-
cation information required for the HD-map update
through our proposed intelligent sensor fusion.
The proposed weighting algorithm of the initially
obtained GNSS data performs well but can be fur-
ther enhanced in future work. Possible improvements
affect the importance consideration of the incoming
traffic data and the weighting of the quality of the
traces. This includes the consideration of influence
factors such as the quality of the used GNSS chipsets,
VEHITS 2019 - 5th International Conference on Vehicle Technology and Intelligent Transport Systems
136

which is likely to increase in the following years
4
, as
well as the adaptation of the clustering process reso-
lution based on the average driving speed of the vehi-
cles.
REFERENCES
Ahmed, M. and et al. (2015). A comparison and evaluation
of map construction algorithms using vehicle tracking
data. GeoInformatica, 19(3):601–632.
Ahmed, U. and et al. (2017). Minimizing gps depen-
dency for a vehicle’s trajectory identification by us-
ing data from smartphone inertial sensors and onboard
diagnostics device. Transportation Research Record:
Journal of the Transportation Research Board, pages
55–63.
Aly, H. and et al. (2015). Lanequest: An accurate and
energy-efficient lane detection system. In Perva-
sive Computing and Communications (PerCom), 2015
IEEE International Conference on, pages 163–171.
IEEE.
Betaille, D. and Toledo-Moreo, R. (2010). Creating en-
hanced maps for lane-level vehicle navigation. IEEE
Transactions on Intelligent Transportation Systems,
11(4):786–798.
Brenner, W. and Herrmann, A. (2018). An Overview
of Technology, Benefits and Impact of Automated
and Autonomous Driving on the Automotive Indus-
try. In Digital Marketplaces Unleashed, pages 427–
442. Springer, Berlin, Heidelberg. DOI: 10.1007/978-
3-662-49275-8 39.
Br
¨
untrup, R. and et al. (2005). Incremental map generation
with GPS traces. In Intelligent Transportation Sys-
tems, 2005. Proceedings. 2005 IEEE, pages 574–579.
IEEE.
Cao, L. and Krumm, J. (2009). From GPS traces to a
routable road map. In Proceedings of the 17th ACM
SIGSPATIAL international conference on advances in
geographic information systems, pages 3–12. ACM.
Chen, D. and et al. (2015). Invisible sensing of vehicle
steering with smartphones. In Proceedings of the 13th
Annual International Conference on Mobile Systems,
Applications, and Services, pages 1–13. ACM Press.
Chen, Y. and Krumm, J. (2010). Probabilistic modeling of
traffic lanes from GPS traces. In Proceedings of the
18th SIGSPATIAL International Conference on Ad-
vances in Geographic Information Systems, pages 81–
88. ACM.
Davies, J. J. and et al. (2006). Scalable, distributed, real-
time map generation. IEEE Pervasive Computing,
5(4):47–54.
Guo, C. and et al. (2016). A low-cost solution for automatic
lane-level map generation using conventional in-car
sensors. IEEE Transactions on Intelligent Transporta-
tion Systems, 17(8):2355–2366.
4
https://www.pocketnavigation.de/2017/10/
broadcom-gps-chip-zentimeter/
K.D. McDonlad and C. Hegarty (2000). Postmoderniza-
tion GPS Performance Capabilites. Proc. IAIN World
Congress and the ION 56th Ann. Meeting. Inst. of
Naviga- tion.
Liu, Z. and et al. (2017). A participatory urban traffic mon-
itoring system: The power of bus riders. IEEE Trans-
actions on Intelligent Transportation Systems, pages
1–14.
Madrigal, A. C. (2014). The Trick That Makes Google’s
Self-Driving Cars Work - The Atlantic [online].
Massow, K. and et al. (2016). Deriving HD maps for highly
automated driving from vehicular probe data. In In-
telligent Transportation Systems (ITSC), 2016 IEEE
19th International Conference on, pages 1745–1752.
IEEE.
Miller, G. (2014). Autonomous cars will require a totally
new kind of map | WIRED [online].
Neuhold, R. and et al. (2017). Generating a lane-specific
transportation network based on floating-car data. In
Stanton, N. A., Landry, S., Di Bucchianico, G., and
Vallicelli, A., editors, Advances in Human Aspects
of Transportation, volume 484, pages 1025–1037.
Springer International Publishing.
Nieh
¨
ofer, B. and et al. (2009). GPS community map
generation for enhanced routing methods based on
trace-collection by mobile phones. In Proeedings of
the First International Conference on Advances in
Satellite and Space Communications, pages 156–161.
IEEE.
Plack, J. (2013). The unmatched quality of HERE maps
content - HERE 360 [online].
R. Prasad and M.Ruggieri (2005). Applied Satellite Navi-
gation Using GPS, G ALILEO , and Aug- mentation
Systems. Artech House.
Rabel, D. (2017). How HERE HD live map perpetually
heals itself [online].
Sato, N. and et al. (2012). Estimating the number of lanes
on rapid road map survey system using GPS trajecto-
ries as collective intelligence. In Proceedings of the
15th International Conference on Network-Based In-
formation Systems, pages 82–88. IEEE.
Uduwaragoda, E. and et al. (2013). Generating lane level
road data from vehicle trajectories using kernel den-
sity estimation. In 16th International IEEE Con-
ference on Intelligent Transportation Systems (ITSC
2013), pages 384–391. IEEE.
van Diggelen, F. (2007). Update: GNSS accuracy: Lies,
damn lies, and statistics : GPS world.
Wu, Z. and et al. (2016). L3: Sensing driving conditions for
vehicle lane-level localization on highways. In IEEE
INFOCOM 2016-The 35th Annual IEEE International
Conference on Computer Communications, pages 1–
9. IEEE.
Ziegler, J. and et al. (2014). Making bertha drive - an au-
tonomous journey on a historic route. IEEE Intelligent
Transportation Systems Magazine, 6(2):8–20.
Lane Accurate Detection of Map Changes based on Low Cost Smartphone Data
137
