
A Traffic Signal Controller for an Isolated Intersection using Fuzzy
Logic Model
Nada B. AlNaser
1
and Yaser E. Hawas
1,2
1
Roadway, Transportation, and Traffic Safety Research Center (RTTSRC),
United Arab Emirates University, Al Ain, U.A.E.
2
Department of Civil and Environmental Engineering, College of Engineering,
United Arab Emirates University, Al Ain, U.A.E.
Keywords: Signalized Intersection, Optimum Methods, Traffic Flows, Fuzzy Logic Model.
Abstract: With the revolution of the new technologies and intelligent transportation systems (ITS) as one category of
the artificial intelligent (AI) models, fuzzy logic models (FLMs) were considered as one of the promising
methods applied in signalized intersections. In general, results show significant improvements on the
efficiency of the traffic networks and intersections. This paper presents a new method of developing an
optimal real-time traffic signal controller using the fuzzy logic technique/method (FLM), taking into
consideration all various incoming traffic flows. The developed FLM was designed for an isolated intersection
with four legs, split phasing, and three different movements (through, right, and left). This research aims at
developing an FLM that replicate the control settings of optimized methods. Calibration and validation tests
were conducted to ensure accuracy and efficiency of the developed model. Results show that the developed
FLM outputs are close to those obtained from optimum methods for traffic signal control systems.
1 INTRODUCTION
The main purpose of traffic engineering is to improve
vehicles’ movement and traffic safety (Roess, Prassas
and Mcshane, 2004). The improvement of the traffic
control systems is continues, wherein scholars keep
on modifying existing controller, and integrating new
ones. Sydney Coordinated Adaptive Traffic System
(SCATS), Split Cycle and Offset Optimization
Technique (SCOOT), and Fuzzy Signal Control
(FUSICO), are of the most well-known and recent
applied traffic signal control systems. For example,
Sydney Coordinated Adaptive Traffic System
(SCATS) shows a reduction in the delay time in cases
of low traffic flows (Wolshon and Taylor, 1999).
Another type of traffic signal controller is the
adaptive traffic signal controller which uses the
Approximate Dynamic Programming (ADP), where
it shows an improvement of traffic efficiency by
reducing vehicle delay time as compared to fixed-
time traffic control systems (Cai, Wong and
Heydecker, 2009).
Now-a-days, Intelligent Transportation Systems
(ITS) as part of Artificial Intelligent (AI) are
considered as a promising method in multiple areas
of traffic and transportation engineering and
management. Such Intelligent Transport Systems
(ITS) are mainly applied to improve traffic operation
system by enhancing the controller decision-making
(Miles and Walker, 2006).
Fuzzy logic systems are considered as one of the
applied methods in artificial intelligent systems,
which is used to convert human-experience into
practical systems (Štencl and Lendel, 2012). Fuzzy
sets were presented initially by Lotfi Zadeh in 1965
(Ross, 2004). Applications of the FLM in
transportation engineering was presented, describing
the four components of FLM namely; fuzzification,
fuzzy logic rules, inference engine, and
defuzzification (Teodorovic, 1999).
Many of the developed FLM rules can be
classified as ‘pure fuzzy’ models, in which input-
output relationships were based on human-
knowledge and experience (i.e. developed system for
traffic signal controller for an isolated intersection
(Pranevičius and Kraujalis, 2012)).
In other models, a genetic algorithm (GA) showed
an improvement in the performance of a developed
model, in which (GA) was designed and applied for
optimizing the membership function and the fuzzy
396
AlNaser, N. and Hawas, Y.
A Traffic Signal Controller for an Isolated Intersection using Fuzzy Logic Model.
DOI: 10.5220/0007709603960403
In Proceedings of the 5th International Conference on Vehicle Technology and Intelligent Transport Systems (VEHITS 2019), pages 396-403
ISBN: 978-989-758-374-2
Copyright
c
2019 by SCITEPRESS – Science and Technology Publications, Lda. All rights reserved

rules of traffic signal controllers, (Qiao, Yang and
Gao, 2011).
Moreover, ‘Neuro-Fuzzy, NF’ systems or
‘Adaptive Neuro-Fuzzy Inference System (ANFIS)’
were also applied, and good results were achieved by
reducing the average vehicle delay at signalized
intersection (Iqbal et al., 2012), and (Seesara and
Gadit, 2015).
These FLM for traffic signal controllers were
either limited to network parameters (i.e. geometry
and number of lanes) or to input-output relationship
in the rule block of the FLM controller (i.e. pure
fuzzy). This paper presents the development of an
FLM controller for a real-time traffic signal controller
that can emulate the well-known optimization
methods, taking into consideration various incoming
traffic flows. Achieving this objective entails: 1)
developing a fuzzy logic model, FLM, for a real-time
signal control for a defined intersection, and
calibrating it using various traffic flows and
configurations that would be initially developed using
a simulation environment, 2) developing an inference
engine (‘IF-THEN’ logic) of the FLM, 3) testing the
developed FLM controller by comparing its output to
the output of optimal signal control settings, 4)
validating the developed FLM controller using
different set of input data (traffic flow combinations).
2 METHODOLOGY AND MODEL
DEVELOPMENT
Various techniques and methods are applied for
controlling traffic signal systems. In this research, the
following sequence of procedures was applied to
achieve the defined objective including; design of
experiments, development and modelling an isolated
intersection using a simulation software, extracting
required data from the simulation model that would
be used for FLM development (in the fuzzification
process, and in the membership function
development), FLM model calibration and
verification, and finally conclusions and
recommendations.
Throughout the literature, a common observation
was that many of the developed FLMs were not
verified against a well-known signal control
optimization method, while in this research, the
developed FLM controller was designed using the
well-known traffic simulation and analysis model
(SYNCHRO), in which the Highway Capacity
Manual (HCM) formulae are applied for traffic signal
optimization and green time estimations.
As for a base model, an isolated intersection was
designed with four approaches (East, West, North,
and South). For all operational scenarios, various
assumptions were applied regarding control type,
geometry, and traffic parameters. This includes; a
pre-timed signalized intersection with protected left
turn movement and split phasing operation, three
shared lanes for each approach (East, West, North,
and South) with a length of 500 m and speed of 60
km/h, saturation flow rate of 1900 veh/h/lane. The
selected phases were same as the approaches, where
each phase would serve a full approach. The
percentage distributions of the approach traffic
movements for the right, through, and left were 30%,
60%, and 10%, respectively. Also, a peak hour factor
(PHF) of 0.92 was used, and 2% as the percentage of
heavy vehicles.
The developed FLM is designed to work as a real-
time traffic controller which has accessibility to raw
field data of each approach, (). This data
includes approach real-time traffic flow,
, and 95%
of approach queue length,
.
Based on these field data, green weight for each
phase or approach,
, would be estimated by
applying the proposed FLM. The green time
allocation for a particular phase,
, could then be
determined based on the estimated green weight of
that phase,
.
Out of the total cycle time, , the higher the green
weight,, the higher the allocated portion of green
time,, for a specified phase, .
The developed FLM was calibrated to determine
the green weights,, that can be obtained using
pure optimization methods such as the Highway
Capacity Manual (HCM) optimization method.
In order to calibrate the rule base functions of the
designed FLM, the following procedures were
followed;
1. input variable,
, fuzzification,
2. verification of the developed membership
function of
,
3. design of experiment to ensure covering wide
range of approach traffic flows from free flow
to grid locks,
4. output determination,
5. fuzzification of output variables,
,
, and
,
6. definition of Input-output relationship,
7. FLM development and calibration, and
8. validation of the developed FLM.
A Traffic Signal Controller for an Isolated Intersection using Fuzzy Logic Model
397

2.1 Input Variable,
, Fuzzification
In designing traffic models, field data collection is
usually considered as the main input to the designed
model. Herein, due to some limitations in the human
resources, tools, and time, input data was obtained
from a well-known optimization/simulation
environment (SYNCHRO). Various traffic flow
combinations, for the four approaches (East, West,
North, and South), were considered.
The minimum and maximum traffic flow values
were determined based on the level(s) of service
(LOS) which was presented in Transportation
Research Board (TRB), Circular 212 (Transportation
Research Board, 1980). Moreover, the ratio was
recommended for use in the Canadian Capacity Guide
(CCG) for Signalized Intersections (Teply et al.,
2008), in which the level of service [LOS] is related
to the value of the volume to capacity ratio, . For
example; if the ratio is (less than 0.60), then the
intersection LOS is defined as [A]. Similarly, LOS
[B] represents a ratio range of (0.60 to 0.69), LOS
[C] represents a ratio range of (0.70 to 0.79), LOS
[D] represents a ratio range of (0.80 to 0.89), LOS
[E] represents a ratio range of (0.90 to 0.99), and
finally, the LOS [F] represents a (greater than or
equal to 1.00).
Herein, using the assumed values for the lane
saturation flow rate,
, as 1900 (veh/h/lane) for urban
intersections, and the number of lanes, (3 lanes), the
total approach saturation flow, (veh/h) was
calculated by multiplying the lane saturation flow
rate,
, by the number of lanes, . This calculated
value of the approach saturation flow,, was
determined as 5700 (veh/h).
Assuming equal number of lane groups, and that
for the lane group; the saturation flow rate and the
approach capacity are equal (5700 pcu/h).
Moreover, due to lane group turning movements
consideration (turning movements of 30% right and
10% left), a reduction factor in estimating the
approach traffic flow was considered and assumed to
be 35%. This value was determined by conducting
several simulation runs and experiments. From these
experiments, it was found that the assumed reduction
factor (35%) gives similar results and estimates of the
total intersection ratio using SYNCHRO
simulation software.
Based on these findings, the approach traffic flow,
, was modified and estimated using following
equation;
(1)
By determining various approach traffic flows,
,
using equation (1) and with correspondence to the
different ratios presented in TRB, Circular 212
(Transportation Research Board, 1980), the main
input of the proposed FLM,
, was determined.
The membership function of the input variable,
,
was assumed to be distributed into five fuzzy terms
(low, medium, medium high, high and very high), as
shown in Figure 1.
Figure 1: Fuzzification of Input Variable, Traffic Flow,
,
(The Membership Function).
The traffic flow fuzzy terms of the membership
function were defined based on the level of service,
LOS, and the corresponding ratio (Transportation
Research Board, 1980). For example, the “Low”
fuzzy term of traffic flow refers to LOS of “A & B”,
the “Medium” fuzzy term of traffic flow refers to LOS
of “C”, “Medium High” refers to LOS of “D”, “High”
refers to LOS of “E”, and “Very High” fuzzy term of
traffic flow refers to LOS of “F”.
Using this definition and referring to the ratio,
the values of a, c, e, g, and i were determined in terms
of (veh/h) as; 324, 695, 787, 880, and 1112,
respectively.
In order to ensure covering all different
combinations of traffic flows, a total of 289
combinations of approach traffic flow,
, were
carefully selected covering traffic flow ranges from
“low” to “very high”.
2.2 Verification of the Developed
Membership Function of Input
Variable,
,
In order to ensure the validity of the fuzzification
process to different ratios, a well-known
simulation environment (SYNCHRO) was used to
VEHITS 2019 - 5th International Conference on Vehicle Technology and Intelligent Transport Systems
398
randomly run selected values of
. The ICU-LOS as
well as the estimated ratio were recorded and
compared with the TRB, Circular 212 (Transportation
Research Board, 1980). Comparison results shows
similarity in these parameter (LOS, and the ratio)
as shown in Table 1 below.
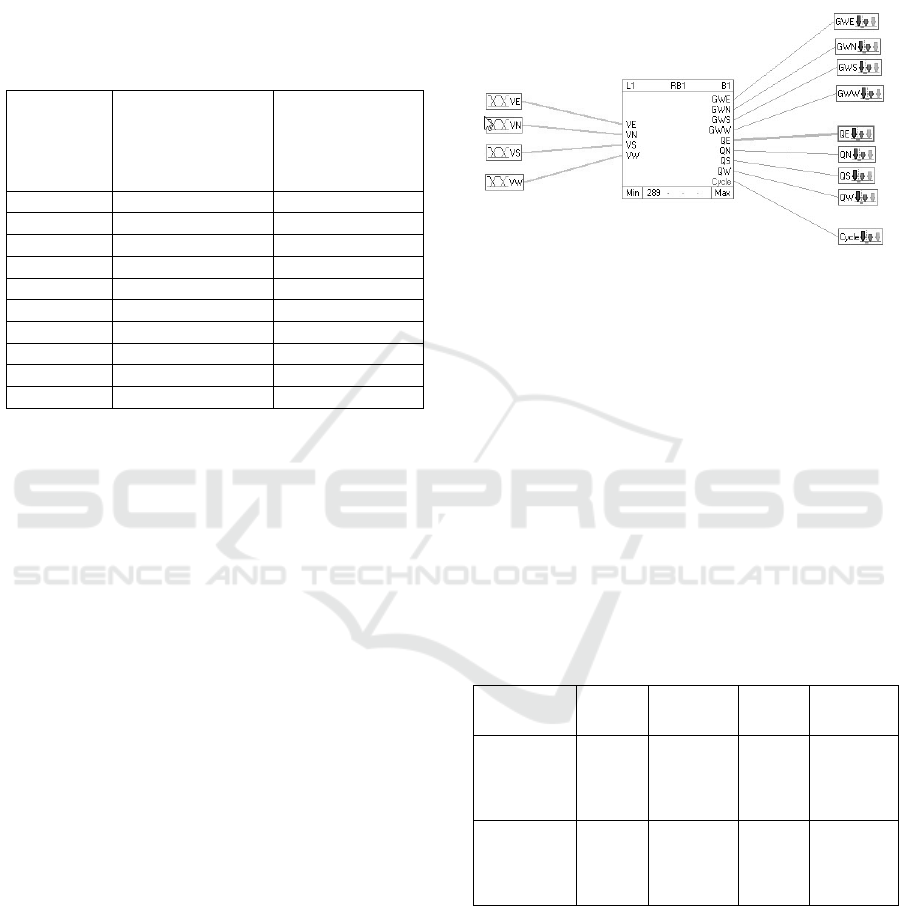
Table 1: LOS Comparison between the TRB- Circular 212,
and SYNCHRO.
Tested
LOS-
TRB- Circular 212
(Transportation
Research Board,
1980)
ICU LOS
(SYNCHRO)
0.3
A
A
0.65
B
B
0.75
C
C
0.85
D
D
0.92
E
E
0.95
E
E
0.99
E
E
1.1
F
F
1.2
F
G
1.4
F
H
2.3 Design of Experiment
After conducting the verification test, a simulation
model of a signalized intersection with four legs was
developed using the SYNCHRO simulation software,
with optimized settings.
A simulation of 289 experimental scenarios
covering various levels and combinations of traffic
flows among the four approaches (East, West, North,
and South) was conducted. These scenarios were
carefully selected and simulated as a representation of
field data collection, covering all levels of approach
traffic flow.
The 289 scenarios were selected to cover all
possible LOS’s. Initially, only four different levels of
fuzzy sets (“low”, “medium”, “medium to high”, and
“high”) were considered for the traffic flow of each
approach, where the “high” fuzzy term represents the
LOS of “E & F”. This resulted in 256 scenarios (4
4
=
256). However, in order to differentiate the totally
blocked approach traffic flow (LOS “F”), a fifth level
term (“very high”) was considered, and additional 33
different experimental scenarios were considered for
simulation.
2.4 Output Determination
For each of the 289 simulation-scenario, and using the
traffic simulation software, SYNCHRO, three main
outputs (
,
, and ) were obtained and recorded.
A new variable, approach green weight,
, was
estimated as the proportion of the approach green
time,
, out of the total intersection green time, .
Figure 2 below represents the rule block (RB) of
the fuzzy logic model structure.
Figure 2: Rule Block (RB) of the fuzzy logic model (FLM).
2.5 Fuzzification of Output Variables,
,
, and
After conducting the 289 experimental runs, and
recording the selected outputs for each experiment,
the fuzzification of these outputs was done.
Fuzzification process was mainly done by
determining the range of each output variable. The
range of the output variable was determined by
estimating the absolute difference between the
maximum and minimum recorded values out of the
289 experiments. Table 2 shows the minimum and the
maximum obtained-values of the output variables.
Table 2: Min and Max Output Values obtained from
running the 289 SYNCHRO Simulation Runs.
C
(sec)
Q
i
(m)
GT
i
(sec)
GW
i
Min.
of all
approaches
80
24.3
16
0.170
Max.
of all
approaches
160
179.1
36
0.311
The range of each output variable was then divided
into equal selected terms to determine the fuzzy sets
for that variable. The membership function was then
developed for each output variable as shown in Figure
3 and Figure 4. Where Figure 3 represents the
membership function for the 95 percentile approach
queue length,
, and approach green weights,
,
while Figure 4 represents the membership function
for the cycle length, .
A Traffic Signal Controller for an Isolated Intersection using Fuzzy Logic Model
399
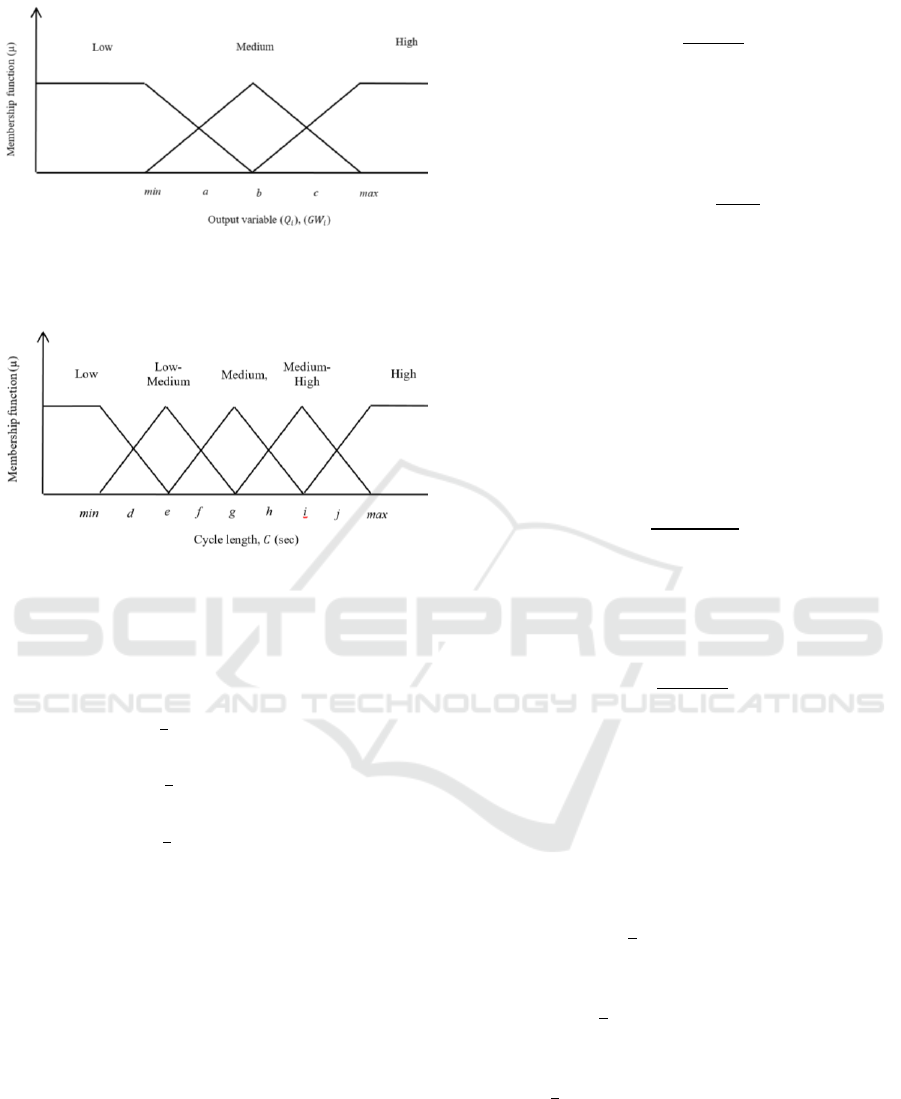
Figure 3: Fuzzification (Membership Function) for the 95
percentile approach queue length,
, output variable, and
approach green weight,
.
Figure 4: Fuzzification (Membership Function) of the cycle
time, output variable.
The values of a, b, and c shown in Figure 3 were
estimated using equations (2), (3), and (4)
respectively.
(2)
(3)
(4)
The obtained values of a, b, and c for the 95
percentile approach queue length,
, were
approximately; 63, 102, and 140 (m), respectively.
For the Approach green weights,
, the values of
a, b, and c were; 0.205, 0.241, and 0.276,
respectively. The fuzzification process of the 95
percentile approach queue length, as well as the
approach green weights,
, was done based on
“IF-THEN” statements as explained below.
Based on Figure 3, the fuzzification formulae for
the 95 percentile approach queue length output
variable,
, was integrated as the following
equations (eqns. 5 to 9).
; (5)
(6)
; (7)
(8)
; (9)
Similarly, the fuzzification formulae for the
approach green weights output variable,
, was
integrated using the following equations (eqns. 10 to
14);
; (10)
(11)
; (12)
(13)
; (14)
Moreover, the domain of each fuzzy term
{minimum, mid, and maximum} was defined as
follows;
(15)
(16)
(17)
With regards to the cycle length output variable,
, the values of d, e, f, g, h, i, and j were estimated
based on simple mathematics, and found to be; 90,
100, 110, 120, 130, 140, and 150 (sec), respectively.
VEHITS 2019 - 5th International Conference on Vehicle Technology and Intelligent Transport Systems
400

With reference to Figure 4, the fuzzification
formulae for the cycle length output variable, , was
integrated as the following equations (eqns. 18 to 26).
; (18)
(19)
; (20)
(21)
; (22)
(23)
; (24)
(25)
; (26)
The range for each fuzzy term of the, , variable
{minimum, mid, and maximum} was defined as
follows:
(27)
(28)
(29)
(30)
(31)
2.6 Definition of the Input-Output
Relationship
After running the 289 different experimental tests in
SYNCHRO, and following the developed
fuzzification process for the input variable as well as
the output variables, the input-output relationship was
formed.
One of the most common methods in defining the
input-output relationship is ‘Pure Fuzzy Logic’ where
input-output relationship is actually developed based
on experience and experts’ opinion.
In order to ensure replicating actual optimized
real-time traffic control methods, the input-output
relationship in this research was determined based on
the 289 conducted tests in SYNCHRO. That is, for
each simulation run, a new (if-then) rule was obtained
and added to the rule block of the fuzzy logic.
By the end, a total of 289 if-then rules were coded
for the membership function of the FLM rule block.
2.7 Fuzzy Logic Model Development
and Calibration
The proposed fuzzy logic model was developed using
a specialized software, FuzzyTECH. Input and output
variables, as well as the rule block, were defined and
integrated based on the designed FLM as discussed in
this paper.
By developing the designed FLM, a calibration
process was conducted to measure the difference
between the developed FLM system and the HCM
optimized methods (SYNCHRO). Where the same
289 scenarios, which were used in SYNCHRO
simulation model, were again applied and imported in
the developed FLM using the FuzzyTECH software.
The obtained results from the FLM were then
compared with the SYNCHRO results using
descriptive statistical methods. Both difference and
percentage difference between the two model
outputs’ (FLM and SYNCHRO) were estimated.
Mainly, the cycle time, , and green times using the
green weights’ estimates, , of the FLM were used
in the comparison for the calibration test.
The main criteria which was applied and followed
in the calibration stage was that; the average
percentage difference between the FLM output and
SYNCHRO output should not exceed the confidence
interval, which was considered here as 10.
The obtained results showed that the average
percentage difference between the FLM and
SYNCHRO for each of the cycle time, , and green
times,
output parameters were 6% and 7.7%,
A Traffic Signal Controller for an Isolated Intersection using Fuzzy Logic Model
401

respectively, which are lesser than the 10% (the
considered confidence interval).
As the developed FLM was subjected to
calibration test and passed the acceptance criteria
(percentage difference between the FLM and
SYNCHRO did not exceed the confidence-interval),
the calibration test was finalized and ended.
2.8 Validation of the Developed Fuzzy
Logic Model
Validation test is considered as a standard practice in
developing new models, in which a new set of input
data is used in the developed model for validation
purpose.
In this research a validation test was conducted by
comparing the output results obtained from both; the
developed FLM and the simulation model
(SYNCHRO), using a new set of input data (traffic
flows).
The new set of input data was randomly selected,
covering various levels of traffic flow (ranging from
low to very high traffic flows). This data was then
applied in the simulation model (SYNCHRO), with
the similar parameters (geometric, traffic, and
control), which were used initially in designing the
model.
The main considered outputs from the validation
test that would be considered in the assessment of the
developed FLM were; the cycle time and green times
for each of the four approaches. The acceptance
criteria which was used in the validation test was
similar to the one that was applied before in the
calibration stage. That is; the absolute value of the
average percentage difference between the FLM and
SYNCHRO outputs should not exceed the confidence
interval (a confidence interval of 10% was used).
After running the validation test, output data was
recorded and analysed. Comparison among the results
indicated that absolute percentage difference between
the FLM and SYNCHRO outputs for each of the
cycle time (%∆ ), and the approach green times (%∆
) were 3.5%, and 3.3%, respectively, which were
lesser than the 10% (the selected confidence interval).
By completing this stage, it can be concluded that
the developed FLM is valid and can replicate the
optimized measures of traffic signal control models,
such as SYNCHRO.
3 DISCUSSIONS AND
CONCLUSIONS
In this study, a Fuzzy Logic Model, FLM, is
developed to act as an optimized real-time traffic
signal controller, for all traffic conditions from free
flow to highly congested flow. It can be used as a base
model to which other parameters could be added. For
example, in urban areas, pedestrian traffic could
significantly affect the control settings. The optimal
can be easily modified to include pedestrian flow as
input. The rule block can be adjusted to consider the
pedestrian priority. Other factors might be considered
as well, such as presence of priority or emergency
vehicles, etc.
The approach traffic flow is considered as the
main input for the developed FLM. The outputs are
the cycle time, , and the approach green time,
.
The membership of the FLM rule block (the Input-
Output relationship) is developed based on data
collected from a real-time traffic simulation software,
SYNCHRO. Using such simulation software (that
follows optimized methods e.g. HCM) ensures the
accuracy of collected data in optimized settings.
Moreover difficulties and deficiencies, faced during
real-life data collection, in covering various
combinations of different levels of traffic flow at a
signalized intersection are overcome.
With regards to the developed FLM, the input
variable,
, is based on the definition of LOS with
correspondence to the ratio, where.
is then
fuzzified by characterizing the LOSs with five fuzzy
terms.
A total of 289 different traffic scenarios are
simulated in SYNCHRO and output data is recorded.
The rule block of the proposed FLM is then defined
based on the recorded data from SYNCHRO.
Calibration test is conducted, in which output
results of both SYNCHRO and the developed FLM
are similar, with a minor accepted difference (6% and
7.7%, as an average percentage difference for the
cycle time, , and green times,
, respectively).
Further, a new set of input data is tested to ensure
the validity of the developed FLM in replicating
optimum traffic signal control settings. Results prove
the validity of the proposed FLM, where the absolute
percentage difference between the FLM and
SYNCHRO outputs are 3.5%, and 3.3%, for %∆,
and %∆
respectively.
Results show that using the developed FLM for
controlling traffic signals with optimized conditions
is promising as it proved its’ ability to provide
optimal solution for all different traffic flow
combinations.
VEHITS 2019 - 5th International Conference on Vehicle Technology and Intelligent Transport Systems
402

During all model development stages, including;
the simulation, calibration, and the validation
processes, some assumptions were used such as;
geometry of the intersection, type of the traffic
controller, etc. Future work might consider using
different or additional parameters such as pedestrians.
ACKNOWLEDGEMENTS
This research has been partially funded by
UAE University fund 31R030.
REFERENCES
Roess, R., Prassas, E., Mcshane, W., 2004. Traffic
Engineering, Pearson Prentice Hall. New Jersey, 3
rd
edition.
Wolshon, B., Taylor, W., 1999. Analysis of intersection
delay under real-time adaptive signal control.
Transportation Research Part C, vol. 7, pg 53-72.
Cai, C., Wong, C., & Heydecker, B., 2009. Adaptive traffic
signal control using approximate dynamic
programming. Transportation Research Part C, vol.
17, pg 456–474.
Miles, J., Walker, A., 2006. The potential Application of
Artificial Intelligence in Transport. IEEE Proceedings
Intelligent Transport Systems, vol. 153, Issue 3, pg 183-
198.
Štencl, M., Lendel, V., 2012. Application of selected
artificial intelligence methods in terms of transport and
intelligent transport systems. Periodica Polytechnica
Transportation Engineering, vol. 40, No. 1, pp. 11-16.
Ross, T., 2004. Fuzzy Logic with engineering applications,
John Wiley & Sons Inc. England, 2
nd
edition.
Teodorovic, D., 1999. Fuzzy logic systems for
transportation engineering: the state of the art.
Transportation Research Part A, vol. 33, pg 337-364.
Pranevičius, H., & Kraujalis, T., 2012. Knowledge based
traffic signal control model for signalized intersection.
Transport, vol. 27, no. 3, pg 263–267.
Qiao, J., Yang, N., & Gao, J., 2011. Two-Stage Fuzzy Logic
Controller for Signalized Intersection. IEEE
Transactions on Systems, Man and Cybernetics, Part A:
Systems and Humans, vol. 41, no.1, pg 178 - 184.
Iqbal, Md., Zahin, A., Islam, Z., Kaiser, M., 2012. Neuro-
Fuzzy based adaptive traffic flow control system.
International Conference on Communications, Devices
and Intelligent Systems (CODIS), pp. 349-352.
Seesara, S., Gadit, J., 2015. Smart Traffic Control Using
Adaptive Neuro-Fuzzy Inference System (ANFIS).
International Journal of Advance Engineering and
Research Development (IJAERD), vol. 2, issue 5, pg.
295-302.
Transportation Research Board, 1980. Interim Materials on
Highway Capacity- Transportation Research Circular
No. 212. Washington, D.C.
Teply, S., Allingham, D., Richardson, D., Stephenson, B.,
and Gough, J. (Editor), 2008. Canadian capacity guide
for signalized intersections, Institute of Transportation
Engineers, & Transportation Association of Canada, 3
rd
ed. ch.4, pp 99-100.
A Traffic Signal Controller for an Isolated Intersection using Fuzzy Logic Model
403
