
Aligning Software Requirements with Strategic Management using
Key Performance Indicators: A Case Study for a Telephone Sales
Software
Lucas Rodrigues Conceição
ICPD – Instituto CEUB de Pesquisa e Desenvolvimento, UniCEUB, SEPN 707/907, Brasília, Brazil
Keywords: Balanced Scorecard, Goal Modelling, Requirements Engineering, Strategy, Software, KPI, Business Value.
Abstract: Companies are increasingly dependent on tailor-made software to achieve their organizational goals. Much is
already known about how to specify a software from an idea or concept, however, predicting the impact of
building it on a company's results is still something little studied, and often the impact is measured only after
its construction, resulting sometimes in a misuse of resources, compared to the result obtained. This paper
presents a way of relating and measuring the impact of software requirements on strategic KPI’s, in order to
extract quantitative and qualitative analyses of these relationships, providing relevant information in the
decision making process regarding prioritization against business value. Through a case study, it is shown
how to use Goal Modelling techniques to extract and relate requirements from the KPI's of a Balanced
Scorecard. It is possible to extract, from the described techniques, qualitative and quantitative results that
show the impact of each of the requirements on the mapped KPI’s.
1 INTRODUCTION
On the last decade, IT and software development has
grown significantly in terms of the role it plays in
business operations, moving from a support role to,
for the most part, one of the most critical sectors for
organizations to keep operations running and playing
and increasingly active and important role in
executing their strategy. IT has ceased to play a
reactive and preventive role, to play, increasingly, its
proactive role in organizations.
It is no coincidence that, during this period we
have seen the “popularization of agile
methodologies” (Dingsøyr et al., 2012) preaching
greater flexibility in adapting and responding to
changes and, along with them, several techniques for
surveying, eliciting, detailing and prioritizing
requirements, aiming to bring the stakeholders a
facilitated vision at the moment of the decision on the
prioritization.
However, we hardly find tools and techniques of
software requirements, which take into account the
company’s own strategy throughout the process.
Generally, what you see is work that starts already in
a need of software, not of business, making it difficult
to maintain its connection strong with the strategy,
during the detailing of the requirements.
This paper proposes the use of strategy tools as a
starting point for the requirements elicitation work, so
that, at the end of it, it is possible to trace which tasks
satisfy a specific strategic need, or otherwise, what
strategic needs will be met when performing a given
task.
Another major motivator for this work is the fact
that, often, IT investment is seen as a cost, not as a
real investment, since IT is often treated as a separate
sector from the rest of the organization. However,
Mesquita says that in order to achieve investments,
the IT strategy must be 100% aligned with business
objectives, thus having a better acceptance of top
management levels at the organization (2015).
As a way of justifying IT investment by aligning
its objectives with company strategy, it is necessary
to find a strategic tool that allows us to visualize the
objectives of the organization, a requirements
elicitation tool, that allows us to transform business
requirements, on software requirements, and, finally,
to make a connection between them.
The paper divides into two phases. The first is
background research of the literature on strategic
tools and then requirements elicitation tools. For this
Conceição, L.
Aligning Software Requirements with Strategic Management using Key Performance Indicators: A Case Study for a Telephone Sales Software.
DOI: 10.5220/0007713602050212
In Proceedings of the 21st International Conference on Enterprise Information Systems (ICEIS 2019), pages 205-212
ISBN: 978-989-758-372-8
Copyright
c
2019 by SCITEPRESS – Science and Technology Publications, Lda. All rights reserved
205

phase, the Balanced Scorecard is the strategic tool,
and the Goal Modelling technique, for elicitation of
requirements.
In the second phase, through a case study
demonstrates how to use both tools reviewed in the
previous phases together to map software
requirements to the strategy of the organization
2 BACKGROUND
2.1 Balanced Scorecard
Balanced Scorecard, or BSC, according to Kaplan
and Norton is a method "capable of translating the
mission and strategy of companies into a
comprehensive set of performance measures that
serve as the basis for a strategic measurement and
management system" (1997). It not only provides
measurements of performance indicators, but also
establishes a relationship between them, allowing a
sectorized view of which indicators affect and / or are
affected by others.
BSC divides its indicators into four different
perspectives because its authors understand that in the
current world, only the use of financial metrics, as
was done in a pre-twentieth century period, no longer
meets the business need, since the financial, when
isolated, does not give enough information to supply
the growing search for investments in short-term
growth opportunities, which start to emerge from the
twentieth century, due to the great entrepreneurial
competition and the need to respond to changes that
grow between organizations.
Therefore, the authors define the following
perspectives: Financial, Customer, Internal
Processes, and Learning and Growth.
2.2 Goal Modelling
“Goal modelling is a set of techniques and tools for
mapping goals and business and software needs. In
requirements engineering, the activities vary from the
search for the understanding of the scope and
environment in which the system is inserted, to its
specification and validation of the generated
specification” (Dardenne, Lamsweerde and Fickas,
1993 apud Giorgini et al.). And there are goal
modelling tools for each of them.
To achieve the goal of this paper, it is important
to understand what a Goal Modelling (GM) tool does
in the early stages of requirements engineering. In
order to do this, it is necessary to go back in time,
where we had the RE (Requirements Engineering) as
a discipline that dealt only with software
specifications, until by 1984 it was already seen as an
evolved form, incorporating aspects of systems and
also of the organizations themselves, and then to draw
the attention of the software and business community
to the dependency relationship that the business
objectives were linked to, and could be solved, once
the software was designed for that specific purpose.
As a result, the interest in the developed software
grows within the organizations, as well as the
requirements that it has to meet, and even more, the
complexity of the management of the stakeholders
and their needs grows, with a view to achieving a
common and satisfactory result to all.
Bringing them into the present day, “in a
collaborative work environment, people do not
strictly follow their role and processes, but are aware
of personal and collective goals, and then act
accordingly to achieve it”. (Smith and Boldyreff,
1995). When people are faced with unstructured
organizations, they tend to tackle the structural
problems they depend on to produce and the possible
routes that can be followed to achieve these
objectives (Loucopoulos and Kavakli, 1997;
Bubenko, 1995), which is precisely what is done in
the engineering of requirements.
This becomes clearer when looking at a model
generated through a GM approach. They are
composed of elements with distinct types, and the
relationships between the elements are often
quantified and / or qualified according to specific
criteria of each approach. All of these variables in a
GM model bring a great wealth of detail and
information to the requirements analyst and
stakeholders, serving as a great background material
for future discussions.
In Figure 1, we can observe some of these
variables being applied. In the image, goals are
represented by circles, as external events, by a
rectangle. Relationships are marked with a positive
(+) or negative (-) sign, indicating the effect that one
element has on another. Some of the objectives, to be
satisfied, are separated into sub-objectives, with
logical operators (AND and OR), to describe the
completeness criterion of the parent objective. This
notation is known as i * (reads i-star), however, there
are several different approaches, with different goals,
and each with its specific notation for its use.
ICEIS 2019 - 21st International Conference on Enterprise Information Systems
206
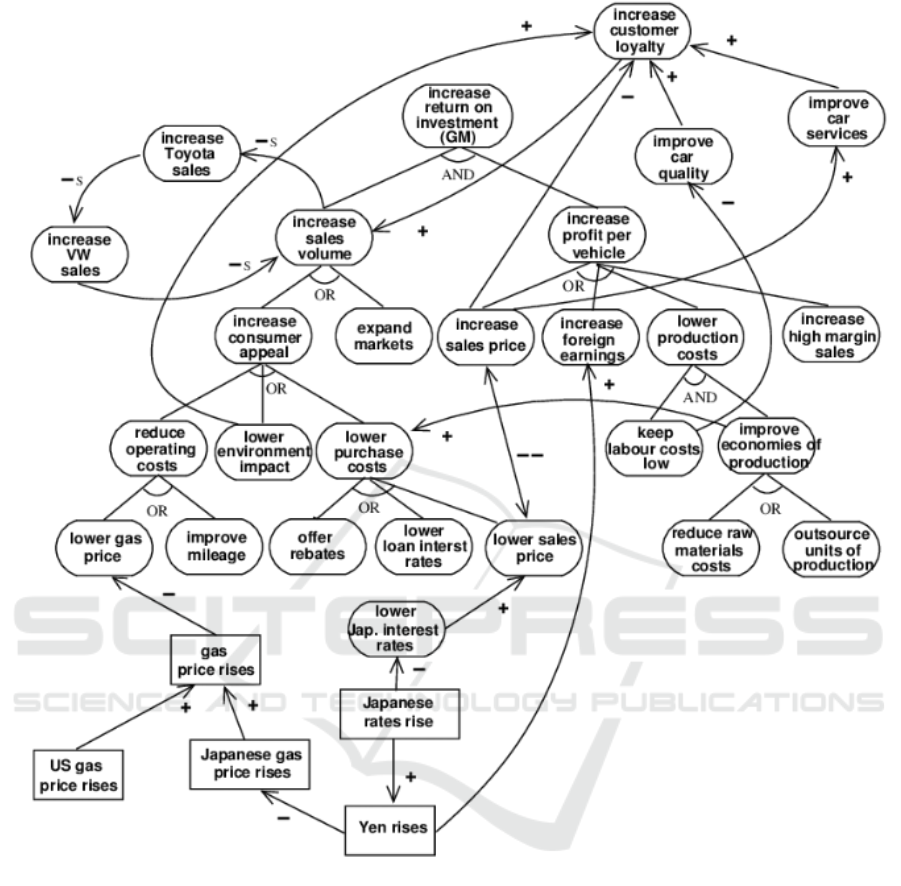
Figure 1: Partial goal modelling for General Motors.
3 CASE STUDY
The case study analyses a multinational company that
operates in the area of computer sales. The company
operates in all continents of the globe. From a
software point of view, the system used by the
telephone sales team, which operates throughout the
Central American and Latin American region, will be
analysed and has around 600 users.
Having this scenario defined, some indicators
inserted in the context of the analysed software will
be analysed and then some software requirements will
be elicited using Goal Modelling to show how it is
possible to connect the software requirements to the
strategic measurements of the organization.
3.1 BSC
Although the BSC free to leave the choice of
perspectives, this case study will be used the
proposals of Kaplan and Norton (1997). The
indicators chosen for analysis and their relationships
are shown in Figure 2.
Aligning Software Requirements with Strategic Management using Key Performance Indicators: A Case Study for a Telephone Sales
Software
207
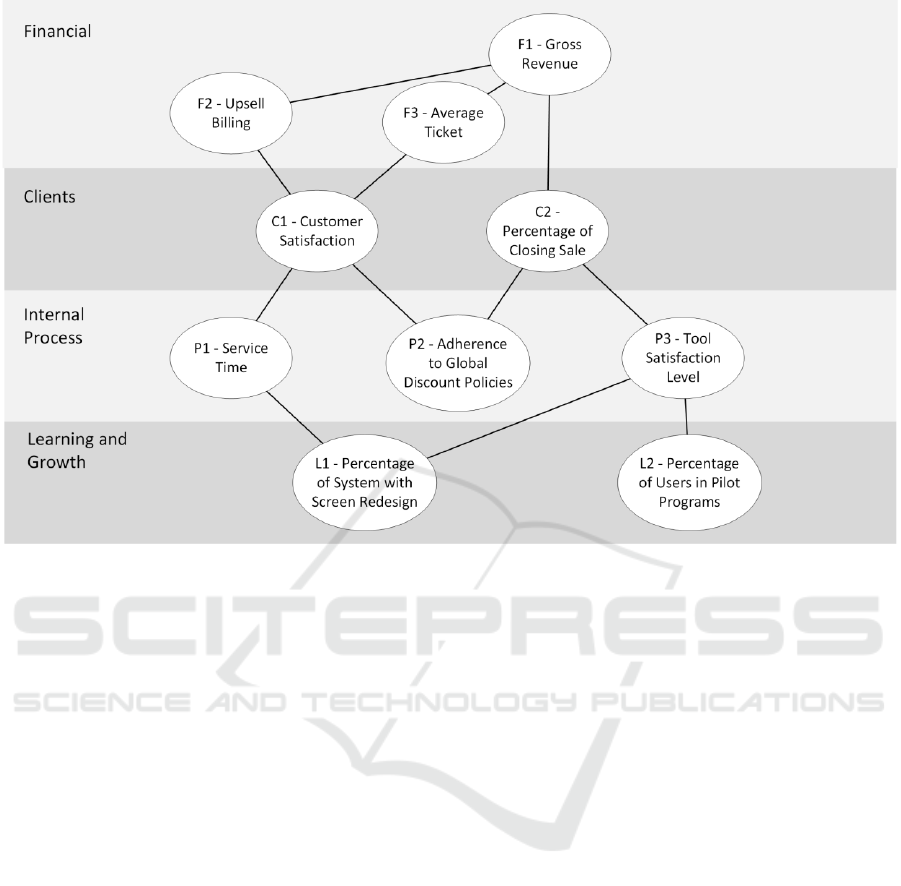
Figure 2: BSC Perspectives and its KPI's.
It is important to remember that attention should
be paid to differentiating the user and the client, who
may or may not be the same people. In this case, the
client of the company does not have contact with the
system, therefore it is not the user. And even though,
often in requirements engineering, we treat the users
and stakeholders as clients, because it is for them that
the systems are developed, in BSC we use the
perspective of the organization as a whole, therefore,
the client is, in this case, who is actually buying a
computer, not the system user.
3.2 Goal Modelling
Softwares are designed to meet specific business
needs or to achieve specific goals of the organization
or a sector thereof, so it would be wrong to say that
all the indicators raised in the BSC will generate
software requirement. Some indicators, such as the
L2 - Percentage of Users in Pilot Programs, do not
depend on software, only on the organization's
internal policies and decisions about how many
employees to dedicate to the program. There are also
indicators that are affected indirectly by software
requirements, but do not always directly generate the
need to create or evolve a system to have its metrics
impacted, such as F1 - Gross Revenue, where we
know that improvements in software can indirectly
increase revenue, but there is no software requirement
that will increase gross organization revenue directly.
It is important to remember that this analysis must
be done on a case-by-case basis and that both the
company segment and the role that the system plays
in the organization will tell which indicators will
serve as input as a starting point for goal modelling.
According to the company's strategy and the role
that the software in question plays, four of the
previously mentioned indicators were chosen: Time
of Service, Percentage of System with Screen
Redesign, Level of Satisfaction of the Tool and
Adherence to the Policies of Global Discount. These
were chosen because they have a direct relation with
the software requirements raised in the deployment of
goal modelling.
After applying the goal modelling technique using
the i* notation, the result of the mapping of the KPI’s
and requirements were as shown in Figure 3. The
indicators are represented by the oval forms, and the
software requirements are represented by the dark
edge rectangles. The most important relations are
signalled with a positive sign (+).
ICEIS 2019 - 21st International Conference on Enterprise Information Systems
208
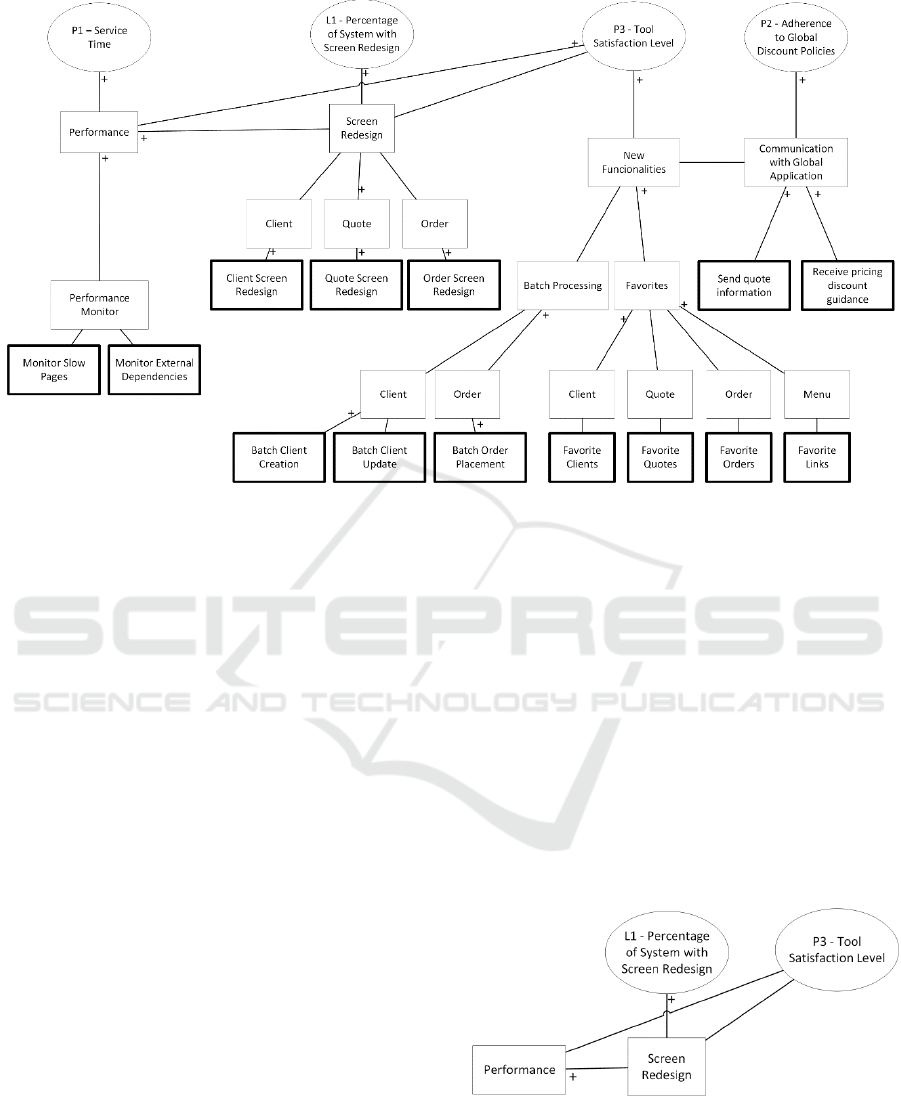
Figure 3: Goal modelling from KPI’s.
4 RESULTS
Based on the modelling, it is possible to carry out
qualitative and quantitative analyses of the scope of
the problem, in order to provide information to
analysts and stakeholders to assist them in decision-
making on development priorities based on the degree
of impact of a requirement on a particular indicator,
or even provide an interpretation of the scenario that
assists them in implementing the strategy within the
organization.
4.1 Qualitative
The benefits of a qualitative analysis come from the
very action of drawing up the diagram itself.
According to Santos and Arion, the modelling
procedure has been valued for its heuristic potential
because it promotes basic inquiry skills such as the
understanding of causal relationships (2004).
As observed from the modelling presented in
Figure 3 and previously explained in the metrics,
there is an effort being made to redesign the screens
of the system. In contrast, another metric is the level
of satisfaction of its users. However, we observed in
the clipping explicit in Figure 4, that the redesign of
screen is less important item for the level of
satisfaction of the tool, and in contrast, it is an item
that has influence in the performance of the system
that, in turn, has bigger relevance to the satisfaction
level of the tool. Having observed this, it was possible
to realize that in order to sell the idea of screen
redesign for users, it would be necessary to show
them, in theory and in practice, that these efforts
would bring improvements in the performance of the
system indirectly, of clicks needed to perform an
action, either by the decrease in the loading time of
the screens in question.
The model, in this case, has proved to be a useful
strategic tool for system managers, since because of
it, was possible to extract information relevant to the
justification of the need to redesign the screen with its
users, an item with minor importance from their point
of view.
Figure 4: Clipping for qualitative analysis.
4.2 Quantitative
Giorgini et al. (2002) showed that it is possible to
carry out quantitative analyses through goal
Aligning Software Requirements with Strategic Management using Key Performance Indicators: A Case Study for a Telephone Sales
Software
209
modelling requirements mapping models. In almost
all approaches of goal modelling there is some kind
of notation for the relations between the elements of
the model, and it is through assigning values to these
different types of relations and applying weights and
algorithms on these values that it is possible to obtain
quantitative results on the model.
There is no single correct way to quantitatively
consider and analyse relationships. These parameters
of the quantitative analysis must be defined according
to the model elaborated, the scope that it represents,
and to what type of information one wishes to obtain
from the model. For the case study, we want to obtain
the degree of relevance that each of the software
requirements has for a metric.
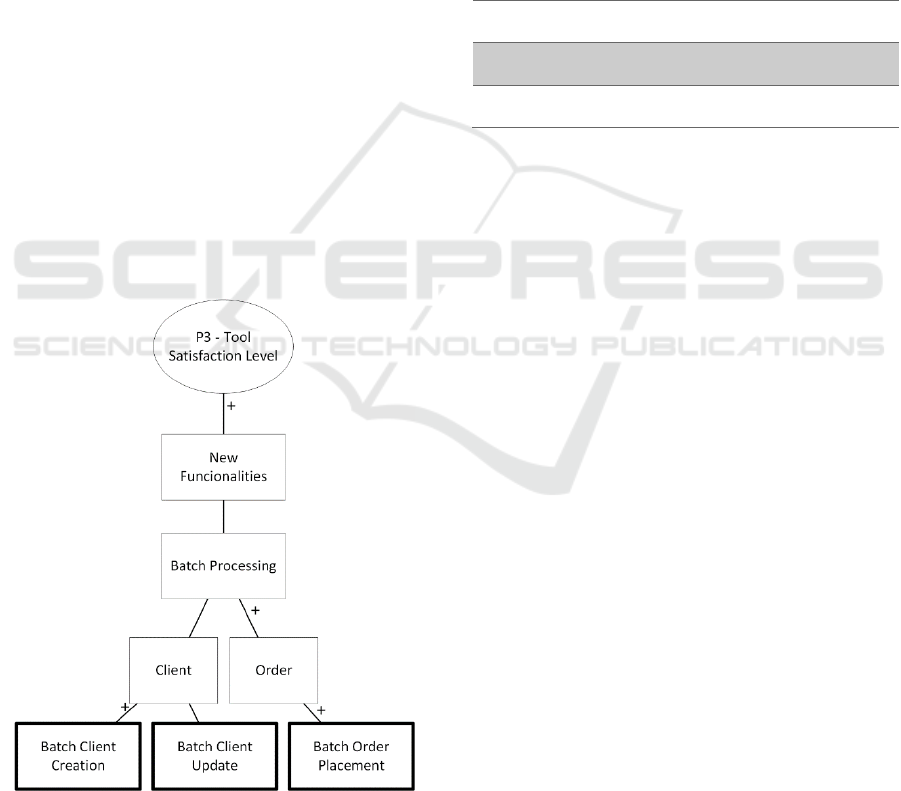
We will use this computation to compare two
requirements, Batch Order Placement, and Batch
Client Creation, in relation to their degree of
importance to the P3 - Tool Satisfaction Level metric,
as highlighted in the Figure 5.
In the elaborated model we have two types of
relation, identified by the presence or absence of the
positive sign (+). The presence of the signal indicates
that that element has a greater importance in relation
to the element to which it relates. Therefore, we will
adopt the value 0 (zero) for the relations that do not
have the positive sign, and the value 1 (one) for the
relations that have the sign.
Figure 5: Clipping for quantitative analysis.
After that, it is enough to take the average value
of the possible paths covered between software
requirements and metrics, adding the weights of the
relations and, in the end, divide by the number of
necessary steps until reaching the metric. With this
we will always obtain values between 0 and 1,
indicating that the higher the value, the greater the
relevance of the requirement for the metric.
As can be seen in Table 1, for this comparison, we
can state that the requirement for Batch Order
Placement is of greater relevance to the Tool
Satisfaction Level metric when compared to the
requirement Batch Client Creation.
Table 1: Index Calculation.
Requirement
Important
Relations
Total
Relations
Index
Batch Order
Placement
3
4
0,75
Batch Client
Creation
2
4
0,5
We can go even further by setting up a table where
we can visualize all the possible requisite-metric
relations and their respective values, as shown in
Table 2.
Again, we have another strategic tool derived
from the mapping of requirements from metrics using
goal modelling. In a single consolidated view, you
can view all the requirements that somehow affect a
given metric and their respective relevance values for
that metric. An example of this is the P3 - Tool
Satisfaction Level metric, in which all requirements,
in some way, impact the result of the tool, and in
addition, it is known, just by looking at the table, that
the most relevant requirement for it to improves the
metric in question is the Redesign of the Screen of
Quotation, with weight 0.8.
The table also becomes useful also when you need
to know the overall impact of requirement building
across the organization, not just for a specific metric.
When calculating the average values of a requirement
for all metrics, it is possible to have a measurement of
the average impact of requirements on the
organization as a whole.
5 FUTURE WORK
5.1 Using Complex Goal Modelling
Approaches
The Goal Modelling approach used has a simple
notation of relationship between the elements, posses-
ICEIS 2019 - 21st International Conference on Enterprise Information Systems
210

Table 2: Requirements weight table for metrics.
Requirement
P1
P2
P3
L1
Avg
Monitor Slow Pages
0,66
0,66
0,66
Monitor External Dependencies
0,66
0,66
0,66
Client Screen Redesign
0,75
0,6
0,66
0,67
Quote Screen Redesign
1,00
0,8
1,00
0,93
Order Screen Redesign
0,75
0,6
0,66
0,67
Batch Client Creation
0,5
0,50
Batch Client Update
0,25
0,25
Batch Order Placement
0,75
0,75
Favourite Clients
0,75
0,75
Favourite Quotes
0,5
0,50
Favourite Orders
0,5
0,50
Favourite Links
0,75
0,75
Send Quote Information
1,00
0,66
0,83
Receive pricing discount guidance
1,00
0,66
0,83
-sing only a positive sign (+) for those that are more
relevant. However, there are notations that have up to
seven types of relationships, including up to
signalling of negative effect among the elements.
The use of more complex goal modelling
approaches, together with the elaboration of
algorithms that support all the variables of the same,
can bring the same result already shown of a
quantitative analysis, but richer and more precise.
5.2 Quantitative Analysis on Indirect
Objectives of the BSC
At the end of this paper we show the numerical impact
of a software requirement on an organizational goal
that generated it. However, as we have seen, not all
BSC metrics were used in the Goal Modelling
process.
BSC provides us with the relationship between all
its metrics. In this sense, the research can evolve to
the point where, through this relation between the
metrics, and the quantitative result of Table 2 we can
extend the analysis of the impact of software
requirements for metrics that were not directly used
to generate them.
With this it is possible to measure the financial
impact that each requirement can have on the
organization, even if no requirement has been created
from a financial metric directly.
5.3 Calculation of ROI for Investment
in Software Projects
Cantor (2011) has shown how to calculate the ROI for
software projects. The most difficult point of this
process is precisely to know how much, in financial
terms, that requirement causes of impact in the
organization. With the process described in this
paper, and in conjunction with the future work
proposed in items 5.1 and 5.2, information on the
financial impact of a requirement or a software
project becomes more accurate and reliable,
facilitating the work of managing an organization,
with regard to the decision-making on the investment
to be made in these projects.
6 CONCLUSIONS
The objective of this work was to find a way to use
tools and strategic information of an organization as
input for the work of analysing and surveying
software requirements.
The first part of the paper focused on the literature
review on tools and techniques of strategic
management and requirements engineering, with the
aim of finding a way to connect to both areas. For
strategic management, the Balanced Scorecard was
chosen for its ability to provide a holistic view of how
the organization works, and also for its ability to
measure performance across all of the points mapped
by it.
For requirements elicitation techniques, Goal
Modelling was chosen for its versatility. It has been
shown that this technique has approaches for all
phases of requirements engineering, and that, like the
BSC, it is performed through elaboration of
modelling and diagrams which, as found by Santos
and Arion (2004), is a very important factor for the
learning and the assimilation of a certain content. In
addition, Goal Modelling has proved useful also for
its ability to put information that differentiates the
relationships between the elements of a model. This
characteristic was fundamental during the collection
of the results, since, in addition to qualitative analysis,
we could also perform quantitative analyses.
Aligning Software Requirements with Strategic Management using Key Performance Indicators: A Case Study for a Telephone Sales
Software
211

In the second part of the paper, it was shown,
through a case study, how to use the BSC as a starting
point for the achievement of Goal Modelling. This
was the decisive factor so that, in the end, we could
extract, through the qualitative and quantitative
analyses, a report that actually showed the value of a
software requirement for a strategic objective of the
organization, as shown in Table 2. In addition, it is
from this result that all future work and research
proposed in this paper can be carried out to further
improve the quality of information regarding the link
between software requirements and the objectives of
an organization.
REFERENCES
Bubenko, J. (1995) Challenges in Requirements
Engineering. Proceedings of 1995 IEEE International
Symposium on Requirements Engineering (RE’95).
(160-162). Available from:
https://doi.org/10.1109/ISRE.1995.512557.
Cantor, M. (2011) Calculating and improving ROI in
software and system programs. Communications of the
ACM 54 (9), (121-130). Available from:
https://doi.org/10.1145/1995376.1995404.
Dardenne, A.; Lamsweerde, A. van; Fickas, S. (1993) Goal-
Directed Requirements Acquisition. Science of
Computer Program 20 (1-2), (3-50). Available from:
http://dx.doi.org/10.1016/0167-6423(93)90021-G.
Dingsøyr, T. et al. (2012) A decade of agile methodologies:
Towards explaining agile software development.
Journal of Systems and Software 85 (6), (1213 – 1221)
Available from:
http://dx.doi.org/10.1016/j.jss.2012.02.033.
Giorgini, P., Mylopoulos, J., Nicchiarelli, E., and
Sebastiani, R. (2002). Reasoning with Goal Models. In:
Spaccapietra, Stefano & March, Salvatore &
Kambayashi, Yahiko. (Eds.). Proceedings of the 21st
International Conference on Conceptual Modeling (ER
'02), 1st ed. (167-181). Available from:
http://dl.acm.org/citation.cfm?id=647525.725913.
Kaplan, R. and Norton, D. (1997). A Estratégia em Ação.
Rio de Janeiro: Elsevier.
Loucopoulos, P., Kavakli, V. (1997) Enterprise Knowledge
Management and Conceptual Modelling. In: Goos, G.,
Hartmanis, J., Leeuwen, J., Chen, P., Akoka, J.,
Kangassalu, H., Thalheim, B. International Symposium
on ’Past, Present and Future of Conceptual Modeling.
(123-143) Available from: http://doi.org/10.1007/3-
540-48854-5_11.
Mesquita, Johnathan. (2015) Como justificar investimentos
em TI? [online] Linkedin. Available at:
https://www.linkedin.com/pulse/como-justificar-
investimentos-de-ti-jonathan-mesquita-silveira/.
[Accessed em: 01 out. 2018].
Santos, K. dos; Arion, C. (2004). Implementando ambientes
de aprendizagem baseados em sistemas computacionais
de modelagem para o pensamento sistmico. Ms.
UFRGS - Universidade Federal do Rio Grande do Sul.
Smith, S.; Boldyreff, A. (1995) Towards an Enterprise
Method for CSCW Systems. In: Proceedings ISADS
95. Second International Symposium on Autonomous
Decentralized Systems. (352-358) Available from:
https://doi.org/10.1109/ISADS.1995.398993.
ICEIS 2019 - 21st International Conference on Enterprise Information Systems
212
