
A Model-based Framework to Automatically Generate Semi-real Data
for Evaluating Data Analysis Techniques
Guangming Li
1,3
, Renata Medeiros de Carvalho
1
and Wil M. P. van der Aalst
2,1
1
Eindhoven University of Technology, P.O. Box 513, 5600 MB, Eindhoven, The Netherlands
2
RWTH Aachen University, 1 Thørv
¨
ald Aachen, Germany
3
Science and Technology Laboratory on Information Systems Engineering, National University of Defense Technology,
410073 Changsha, China
Keywords:
Automatic Data Generation, Business Process Model, Process Mining, ERP.
Abstract:
As data analysis techniques progress, the focus shifts from simple tabular data to more complex data at the level
of business objects. Therefore, the evaluation of such data analysis techniques is far from trivial. However,
due to confidentiality, most researchers are facing problems collecting available real data to evaluate their
techniques. One alternative approach is to use synthetic data instead of real data, which leads to unconvincing
results. In this paper, we propose a framework to automatically operate information systems (supporting
operational processes) to generate semi-real data (i.e., “operations related data” exclusive of images, sound,
video, etc.). This data have the same structure as the real data and are more realistic than traditional simulated
data. A plugin is implemented to realize the framework for automatic data generation.
1 INTRODUCTION
Most enterprises are employing information systems,
such as enterprise resource planning (ERP), e.g.,
SAP, customer relationship management (CRM), e.g.,
salesforce, to handle their business transactions. The
amount of data being stored about the transactions is
rapidly growing. In order to discover insights from
the data, various data analysis techniques (such as
data mining and process mining) have been proposed.
Accordingly, the evaluation of these techniques be-
comes a significant task.
Data exist everywhere but it does not mean that
we can get appropriate data easily for the evaluation
of data analysis techniques. Most of the time, data of
enterprises are confidential due to data privacy regula-
tion, e.g., the EU General Data Protection Regulation
(“GDPR”). The owners cannot provide the data or
can only provide incomplete data (after deleting sen-
sitive information to preserve privacy). Besides, orig-
inal raw data from information systems usually con-
tain a lot of irrelevant data elements such that data
pre-processing is time-consuming.
For this reason, most researchers use synthetic
data to evaluate data analysis techniques. However,
synthetic data are often generated by simulation (ac-
cording to the rules defined by users) rather than be-
ing derived from operating any real information sys-
tem (Gray et al., 1994; Hoag and Thompson, 2009).
As a result, the evaluation based on such data is not
convincing since synthetic data may be quite different
from the data generated by real information systems.
In order to solve these problems, this paper pro-
poses a framework to generate “semi-real” data,
which is easier to collect than real-life data and is
more “realistic” than synthetic data. The basic idea
is to (i) derive a log of click events by simulating a
designed model and (ii) transform click events into
real operations on information systems which support
operational process, e.g., BPM, ERP, etc. Note that,
the generated data are “operations related data” con-
sisting of the business process transactions, which do
not include images, sound, video, etc.
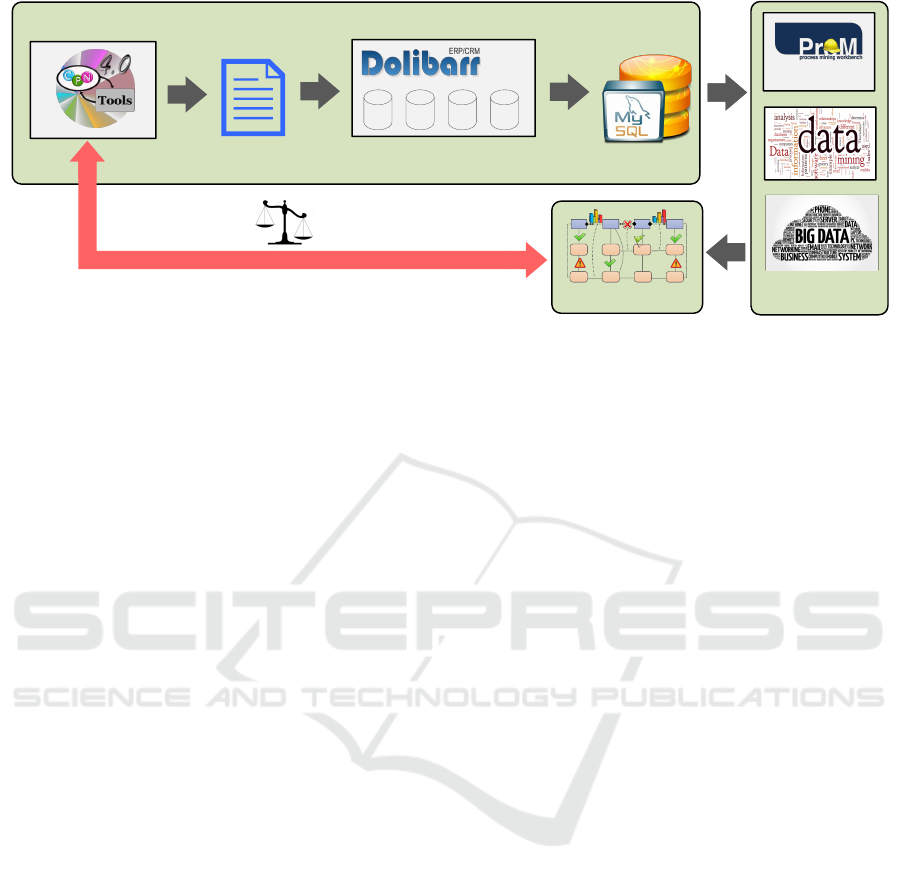
Figure 1 presents the framework of our approach
and the context of evaluating data analysis techniques
(Mans et al., 2010). First, a model is designed in
CPN Tools (cf. Section 2) to indicate how an infor-
mation system should be operated, which implicitly
decides the profile of generated data.
1
By simulating
the model, a simulation log consisting of click events
is generated. The click events control the information
system execution by transforming each click event
1
http://www.cpntools.org.
Li, G., Medeiros de Carvalho, R. and van der Aalst, W.
A Model-based Framework to Automatically Generate Semi-real Data for Evaluating Data Analysis Techniques.
DOI: 10.5220/0007713702130220
In Proceedings of the 21st International Conference on Enterprise Information Systems (ICEIS 2019), pages 213-220
ISBN: 978-989-758-372-8
Copyright
c
2019 by SCITEPRESS – Science and Technology Publications, Lda. All rights reserved
213
Data
generate
control
Designed model
Information system
Data Generation Framework
input
Data Analysis
Techniques
simulate
Simulation log
Process mining
compare
pay
create
invoice
create
order
deliver
order
line
order
customer
element
relation
payment
payment
line
shipment
invoice
Insights
derive
Figure 1: The framework for automatically generating data in the context of evaluation of data analysis techniques.
into a real click on the interfaces of the information
system. In this way, the designed model is automat-
ically executed in the information system, which re-
sults in a large set of data in the corresponding data
repository, e.g., databases. Considering a Data Sci-
ence context, various techniques can be employed to
derive insights using the generated data as input (Li
et al., 2018b; van der Aalst et al., 2017). By compar-
ing the derived insights with the knowledge from the
designed model, the techniques can be evaluated.
Our approach has the following contributions
compared with existing approaches: (i) Simulation
logs rather than humans are used to control the ex-
ecution of information systems. As a result arbitrary
amounts of data can be generated. This is not possible
when the system is operated manually. (ii) Data are
generated by real information systems and they can
capture the complex structures of the real systems as
the real-life data. Using existing approaches, it is im-
possible to recreate such rich data without coding the
information systems in the simulation model, since
the data inside such systems are collections of inter-
related tables rather than simple tabular data.
The remainder is organized as follows. Section 2
briefly introduces how to design and simulate a model
in CPN Tools. Using the simulation log derived by
simulating the model, Section 3 illustrates how to au-
tomatically operate information systems and gener-
ate semi-real data. The framework is implemented
as a ProM plugin, which is introduced through a case
study in Section 4. Section 5 discusses the related
work and Section 6 concludes the paper.
2 MODEL SIMULATION
As shown in Figure 1, in order to automatically oper-
ate the information systems in a customized manner,
one first needs to design a model and derive a simula-
tion log by simulating the model. In this section, we
explain how to accomplish these two tasks using the
CPN Tools.
2.1 CPN Tools
Petri nets are probably among the best studied process
modeling languages and allow for describing systems
involving communication, concurrency, synchroniza-
tion and resource sharing (Murata, 1989). They are
more expressive than other modeling languages such
as FSMs, and have been successfully used for speci-
fication of workflow processes (van der Aalst, 1998).
A Petri net is a directed bipartite graph which uses
a very simple notation of circles representing places
and squares representing transitions with arrows con-
necting them. Although the graphical notation is in-
tuitive and simple, Petri nets are executable and many
analysis techniques can be used to analyze them.
Colored Petri nets (CPNs or CP-nets) extend Petri
nets with data. Tokens may have data values, often re-
ferred to as “color”, which describes the properties of
the object modeled by a token (Jensen, 2013; Jensen
and Kristensen, 2009; Zervos, 1977). Besides, each
token has a timestamp, which indicates the earliest
time at which the token may be consumed. Transi-
tions can assign a delay to produced tokens, and wait-
ing and service times can be modeled in this way. Due
to the extension, CPNs can deal with data-related and
time-related aspects.
CPN Tools is a toolset providing support for edit-
ing, simulating, and analyzing CPNs. It basically
comprises two main components, a graphical editor
and a backend simulator component. Next, we illus-
trate how to edit and simulate a CPN using these two
components, respectively.
ICEIS 2019 - 21st International Conference on Enterprise Information Systems
214
2.2 Designing Models
In this section, we describe how to design the model
in terms of a CPN using CPN Tools. The model spec-
ifies the scenario in which the information system is
operated and decides what kinds of data are gener-
ated. For instance, if one wants to generate data in-
cluding transactions such as “create order”, “create
invoice” and “create payment”, a model to specify an
Order-to-Cash (OTC) scenario can be designed.
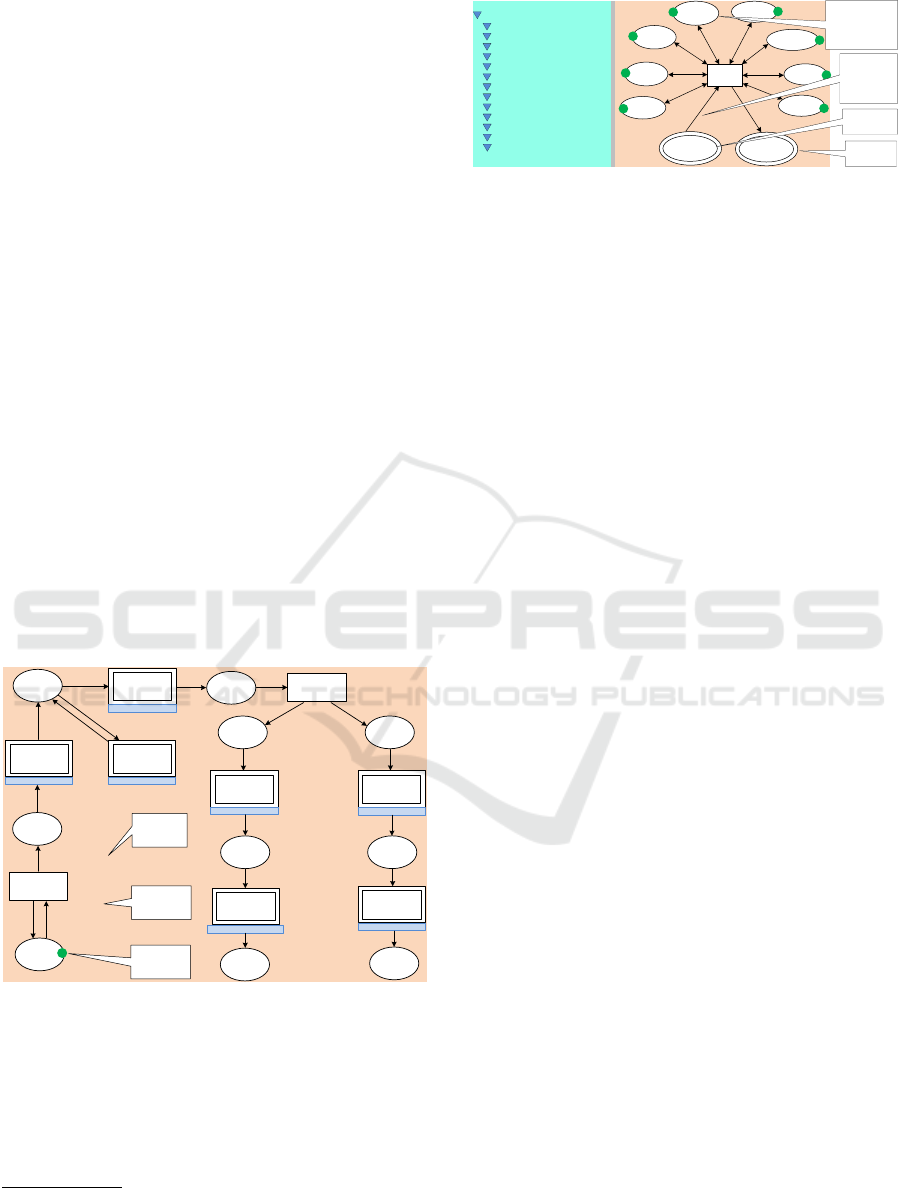
Figure 2 presents a CPN to describe the OTC sce-
nario of an open source ERP system Dolibarr.
2
A
CPN can have a hierarchal multiple-level structure
(i.e., transitions depicted by doubled squares). For in-
stance, Figure 2 shows the business process on the top
level and Figure 3 shows a sub-process for the “create
order” transition in Figure 2. In order to control the
CPN in Figure 2, we first assign an initial token with
an attribute id = 1 to the “start” place. This token
enables the “generator” transition to generate sched-
uled orders if its condition is satisfied, i.e., id < 50.
In other words, this condition can be used to control
the number of scheduled orders. Besides, we assign
proper time delay between each two scheduled orders.
The function delay attached to the “generator” transi-
tion controls the frequency of scheduled orders. For
instance, delay(week/100.0) means that 100 orders
are scheduled in one week.
create
order
create order
scheduled
order
generator
start
@ ++ delay(week/100.0)
[id<50]
validate
order
validate order
create
shipment
create shipment
created
order
add
order line
add order line
validated
order
preprocess
order
order for
shipment
created
shipment
validate
shipment
validate shipment
create
invoice
create invoice
order for
invoice
created
invoice
create
payment
create payment
id
id+1
1
1
validated
shipment
created
payment
indicating
frequency
indicating
numbers
initial
token id=1
Figure 2: A CPN describing the OTC scenario.
In a CPN, each token has a corresponding class,
which indicates the colors (i.e., attributes) added on
the token. Therefore, some classes are created for the
involved entities in the business process, such as “or-
der”, “invoice”, etc. Note that, the attributes of each
class conform to the attributes of its corresponding
2
Dolibarr ERP/CRM is an open source (webpage-
based) software package for small and medium companies
(www.dolibarr.org).
Order class
colset RefC = string
colset Customer = string
colset CreationDate = REAL
colset DeliveryDate = REAL
colset PayTerms = string
colset PayType = string
colset DelayType = string
colset ShipMethod = string
colset Source = string
colset Incoterms = string
colset Model = string
colset PublicNote = string
colset PrivateNote = string
create
order
scheduled
order
delay
type
created
order
pay
type
ship
method
source
model
incoterms
output an
order
two predefined
values: “Catch
by customer”,
“Transporter”
pay
terms
note
8
input
information
5
4
2
2
4
4
5
input (order);output ();
action(record(order));
action is
executed as
transition is
triggered
Figure 3: The order class and its attributes in the sub-
process for the “create order” transition in Figure 2.
entity in the interface. Consider for example the in-
terface for creating an order in Figure 5. An order has
attributes such as “Ref.customer”, “Customer”, etc.
Accordingly, we build an “order” class with the same
attributes as shown in Figure 3.
In order to make the generated data as realistic
as possible, we predefined possible values for some
attributes. For instance, the “ship method” attribute
has two predefined values: “Catch by customer” and
“Transporter” (referring to the values in Dolibarr).
During the simulation, one value is randomly selected
as the attribute value. Differently, the time attributes
(e.g., “CreationDate”) derive their values based on the
timestamps of tokens. For instance, when the “create
order” transition is triggered, the current timestamp is
assigned to the “CreationDate” attribute.
2.3 Simulating Models
In order to generate data on a large scale, we need a
“robot” to automatically operate the information sys-
tem (e.g., fill in attributes and click buttons) like a hu-
man. Our approach (as shown in Figure 1) supports to
control the operation of the “robot” in a customized
manner. More precisely, by simulating the designed
CPN in Section 2.2, a simulation log consisting of a
list of click events (with attributes) is derived, which
tells the robot how to operate the system.
The simulation process is reflected by the flow of
tokens through a CPN, governed by the firing rules il-
lustrated next. A transition can represent a task and
when triggered it consumes one token from each of
its input places and produces a token in each of its
output places. In this way, tokens are moved between
places to trigger transitions. Note that, each transition
may have a corresponding function. When the tran-
sition is triggered, the function is executed which can
output some information in a simulation log. Con-
sider for example the “create order” transition in Fig-
ure 3. When it is triggered, the “record” function is
executed, which writes a click event in the simulation
log, as shown in Figure 4.
Based on the rules explained above, the simula-
tion process is described next. The initial token en-
A Model-based Framework to Automatically Generate Semi-real Data for Evaluating Data Analysis Techniques
215

<log>
<event>
<activity>create order</activity>
<refCustomer>customer 1</refCustomer>
<customer>Sander</customer>
<orderDate>12/03/2018</orderDate>
<deliveryDate>12/07/2018</deliveryDate>
<payTerms>60 days</payTerms>
<payType>Check</payType>
<availabilityDelay>3 weeks</availabilityDelay>
<shipMethod>Transporter</shipMethod>
<source>Sponsorship</source>
<incoterms>CIF</incoterms>
<model>einstein</model>
<publicN>customer order</publicN>
<privateN>VIP membership</privateN>
</event>
...
</log>
Figure 4: A segment of a simulation log.
ables the “generator” transition. When it is triggered,
it produces a scheduled order. Then an order is cre-
ated by the “create order” transition, and one or more
order lines are added into the order by the “add or-
der line” transition. After validating the order by
the “validate order” transition, the “create shipment”
transition packs the orders and “create invoice” tran-
sition creates invoices for the orders in parallel. Note
that, there exists a one-to-many relation between or-
ders and shipments (Dolibarr does not support creat-
ing a shipment for multiple orders), and a many-to-
many relation between orders and invoices. At last,
the shipments are validated and invoices are paid. By
repeating the above process, a simulation log is de-
rived as shown in Figure 4.
3 AUTOMATIC DATA
GENERATION
In general, it is impossible or at least time-consuming
to create a large enough data by manually clicking
buttons in information systems. Therefore, Section 2
presented a method to derive a simulation log (by de-
signing and simulating a CPN) for controlling auto-
matic execution of information systems. In this sec-
tion, we illustrate how to transform click events from
the simulation log into real clicks in information sys-
tems to generate data. Note that, we call this kind of
data “semi-real” because it has the same structure as
real data generated by the same information system,
but with different attribute values.
3.1 Identifying Interface Elements in
Information Systems
A large variety of information systems one encoun-
ters in companies nowadays are webpage-based (or
browser-based) systems. A webpage-based applica-
tion is any program that runs inside a web browser.
3
A
web browser can have a graphical user interface, like
Internet Explorer / Microsoft Edge, Mozilla Firefox,
Google Chrome, Safari. The webpage usually is writ-
ten in HTML or a comparable markup language. Web
browsers coordinate various web resource elements,
such as style sheets and images, to present webpages.
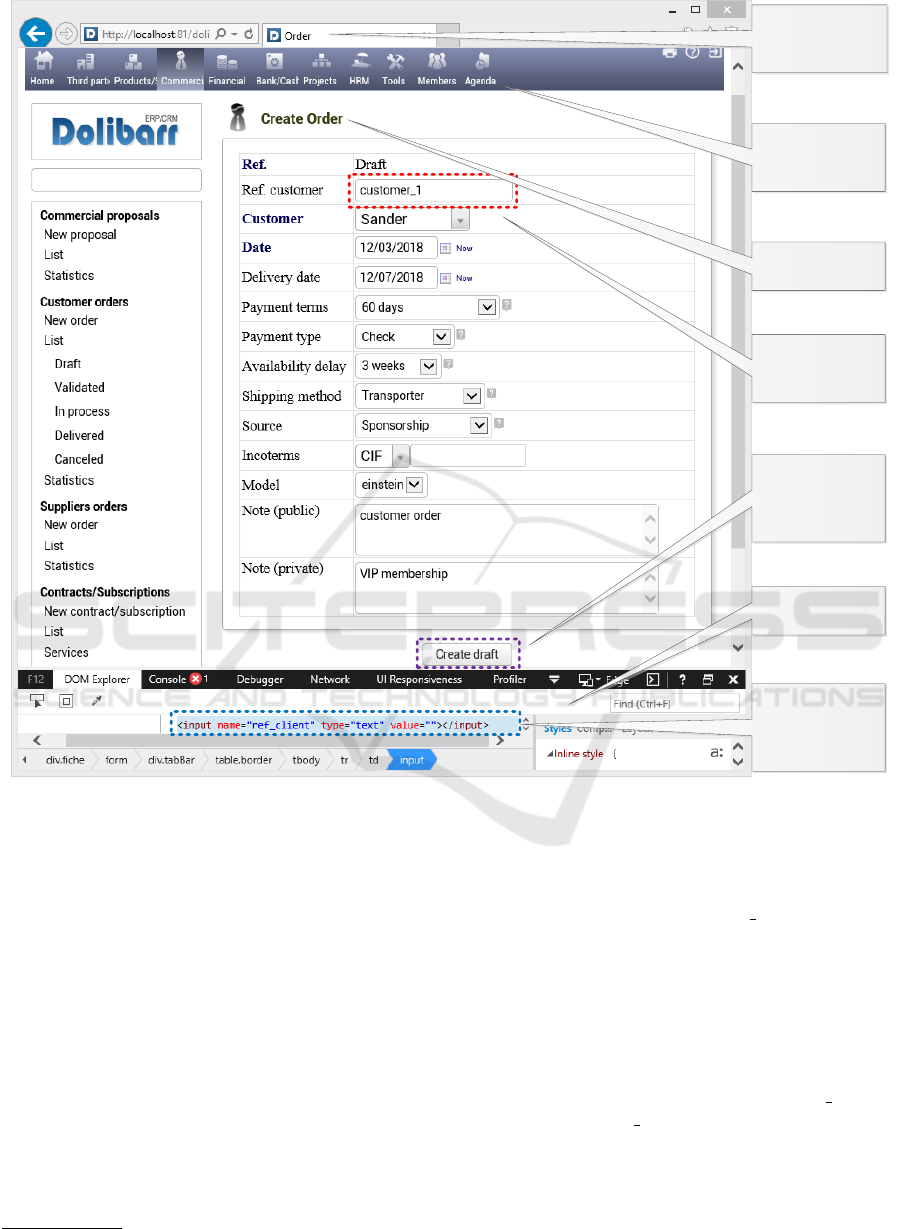
Dolibarr is a webpage-based information system
and Figure 5 shows its interface for creating orders.
As one can see on the menu bar, Dolibarr has mod-
uels such as “Products”, “Commercial” and “Finan-
cial” to support functionalities such as sales, finance
& billing, product & stock, etc. The “Create Order”
interface has different interface elements, such as la-
bels, input fields, drop-down menu and buttons. One
can manually fill in the required attributes and create
an order by clicking the “Create draft” button. How-
ever, it is impossible to generate large-scale data in a
short time by manually interacting with the system.
A method to solve this problem is to fill in attributes
and click buttons automatically by searching interface
elements, as explained as follows.
Each element on webpages has some properties
(on the source code perspective) such as “name”,
“type” and “value”, which can be used to identify
the element.
4
Consider for example the input field
highlighted in the red square in Figure 5. The bot-
tom panel, in the blue square, presents the source
code of the input field. More precisely, it has three
attributes “name”, “type” and “value”, whose values
are “ref client”, “text” and “”, respectively. These at-
tribute names and values can be used to identify inter-
face elements through some functions. For instance,
the PHP language is widely used to encode webpage
interfaces and it provides functions such as “getEle-
mentsByTagName” to return an element by inputting
the tag name.
Our plugin (cf. Section 4.1) employs the above
functions to identify elements based on tag names
configured by users. If information systems are not
webpage-based, robotic process automation (RPA)
techniques (van der Aalst et al., 2018) can be em-
ployed to identify interface elements. For instance,
the company “UiPath” develops a platform “UiPath
Robot” to automatically execute business processes
3
http://www.businessdictionary.com/definition/browser-
based-applications.html.
4
https://www.w3schools.com/html/html elements.asp.
ICEIS 2019 - 21st International Conference on Enterprise Information Systems
216
webpage-based
information
system
different modules
of the ERP system
Dolibarr
an interface
element of an
input field
the interface of
creating orders
each click in a
simulation log
corresponds to a
button
source code panel
of the interface
each interface
element having
attributes such as
name, type
Figure 5: The interface for creating a customer order in Dolibarr.
on common information systems (including non-
webpage-based systems).
5
These techniques can be
referred to apply our approach to more general infor-
mation systems.
3.2 Replaying Simulation Logs onto
Interfaces
Section 3.1 proposed a method to identify the inter-
face elements based on the source code and functions.
It builds a mapping between click events (and their at-
tributes) in the simulation log and buttons (and their
attributes) on the interfaces. In this part, we illus-
trate how to replay a simulation log onto the interfaces
of information systems, i.e., filling in attribute values
and triggering buttons.
5
https://www.uipath.com.
Consider for example the click event in Figure 4
and the interface in Figure 5 to understand the replay-
ing process. The click event has a special attribute
“activity” with a value of “create order”, which in-
dicates that this event is replayed onto the “Create
Order” interface. After entering the corresponding
interface, the attribute values of the click event are
filled into the corresponding interface elements. This
can be automatically done by the implemented plu-
gin (cf. Section 4.1) because PHP provides a function
setAttribute to fill a value into an interface element,
e.g., RefC.setAttribute(“Value”, “customer 1”) fills
the value “customer 1” into the input field “RefC” in
the red square in Figure 5.
Based on the method introduced above, all the at-
tribute values of the event click are filled into corre-
sponding interface elements, resulting in the filled in-
terface in Figure 5. Then the “Create draft” button
A Model-based Framework to Automatically Generate Semi-real Data for Evaluating Data Analysis Techniques
217
can be triggered using the function click provided by
PHP, just like a real person clicking the button. After-
wards, another interface pops up, on which the next
click event is replayed. Note that, the order of click
events in the simulation log should totally match the
order of interfaces in the information system.
Information systems have data sources to store the
executed business processes in the interfaces, e.g.,
Dolibarr has a corresponding database which stores
information of all created objects. When the inter-
faces of the information system are operated auto-
matically, the corresponding tables in the database
are populated. For instance, when the “Create draft”
button is triggered in the interface (i.e., an order is
created), a new row is immediately added into the
“llx commande” table to record the information filled
in the interface. By replaying the simulation log, an
arbitrarily large amount of records can be added into
different tables in the database.
4 IMPLEMENTATION AND CASE
STUDY
We have now introduced all the involved ingredients
in the data generation framework shown in Figure 1.
In this section, we show how to generate semi-real
data using a case study based on Dolibarr.
4.1 Data Generator
The part of the framework in Figure 1 which controls
the automatic execution of information systems based
on the simulation log, has been realized as a plugin
named Data Generator in ProM.
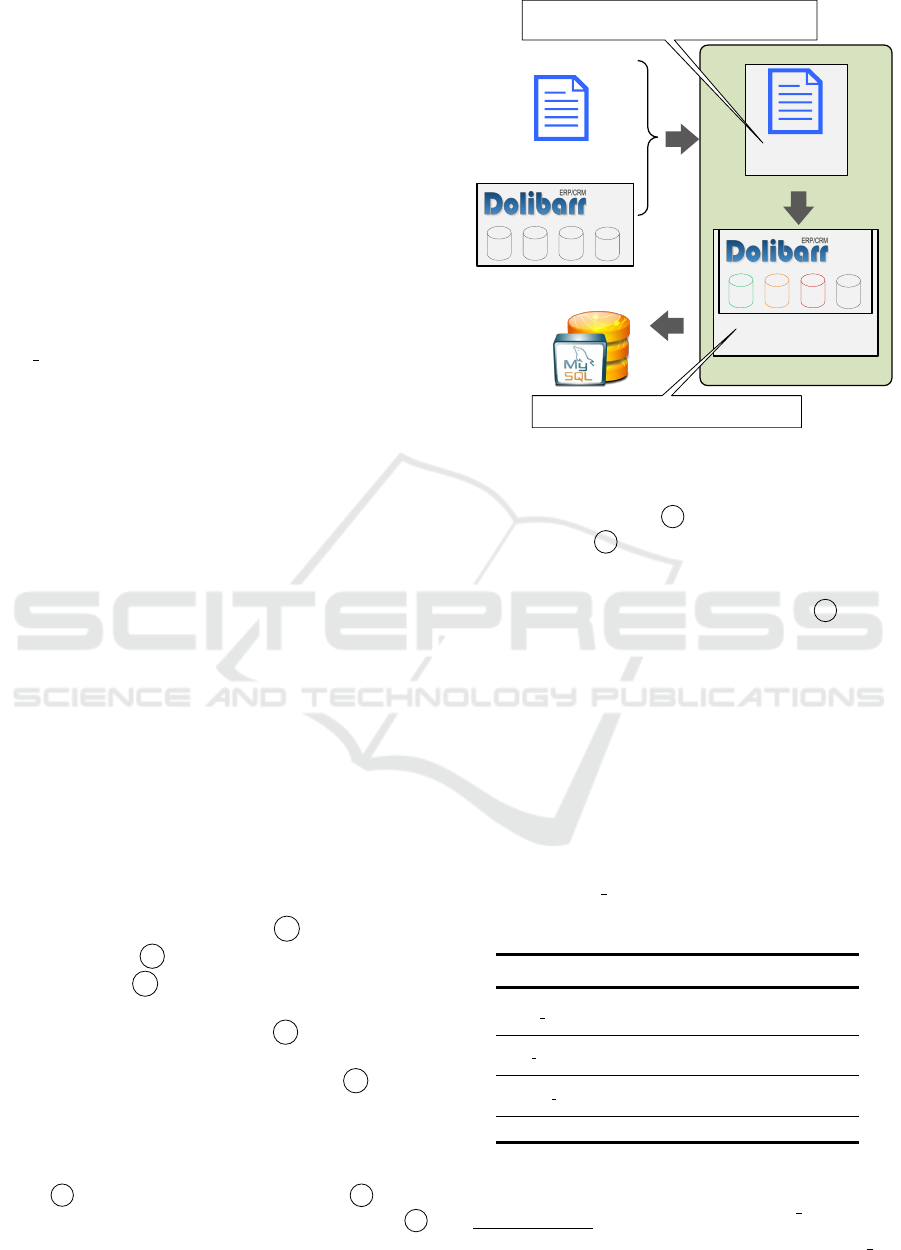
Basically, the generator takes a simulation log and
a webpage-based information system as input and
generates data in the database connected to the sys-
tem as shown in Figure 6. It consists of two inter-
faces: “Build Clicks” (denoted as A ) and “Run Sys-
tem” (denoted as B ) as shown in Figure 7. More pre-
cisely, interface A builds an executable list of clicks
by mapping click events in simulation logs onto but-
tons in interfaces, while interface B runs the system
by triggering buttons based on the executable list.
Figure 7 shows the details of interface B , which
is the main component to control the execution of the
information system. The basic idea is to embed the
system into the interface, and control the execution
of the system based on the click list. More precisely,
panel 2 presents the click list while panel 3 shows
the related attribute for the focused click. Panel 4
is used to fill in the website address and login. After
Data
Data Generator
Interface A
Build Clicks
Interface B
Run System
Simulation log
Information system
mapping click events in simulation logs onto buttons
in interfaces to build an executable list of clicks
running system by triggering buttons based on
the executable list of clicks
input
output
Figure 6: The architecture of the data generator.
providing the home page of the system, one can press
“run” button in panel 1 to start running Dolibarr
system. Panel 5 displays the state of Dolibarr sys-
tem after each click, which is the same as operating
Dolibarr in a browser. It is possible to suspend the
execution using the “stop” button in panel 1 and re-
suming the execution using the “run” button. In order
to investigate the details, one can press the “execute
one” button to execute the click one by one.
4.2 Generated Data
After running Dolbiarr system, the corresponding
database is populated with the generated data. In the
database, there are in total 148 tables involved in all
business processes (e.g., OTC and PTP) supported by
the Dolibarr system. All the table names have the
same prefix “llx ”.
6
Table 1: A segment of the tables in the Dolibarr system.
Index
Table name Alias
Description
1
llx commande order
record order information, such
as customer, time, note
2
llx commandedet order line
record items information, such
as product, quantity, price
3
llx societe customer
record customer information,
such as name, phone, address
...
... ...
...
Table 1 presents some database tables involved in
the OTC scenario. For instance, the “llx commande”
6
https://wiki.dolibarr.org/index.php/Category:Table SQL.
ICEIS 2019 - 21st International Conference on Enterprise Information Systems
218
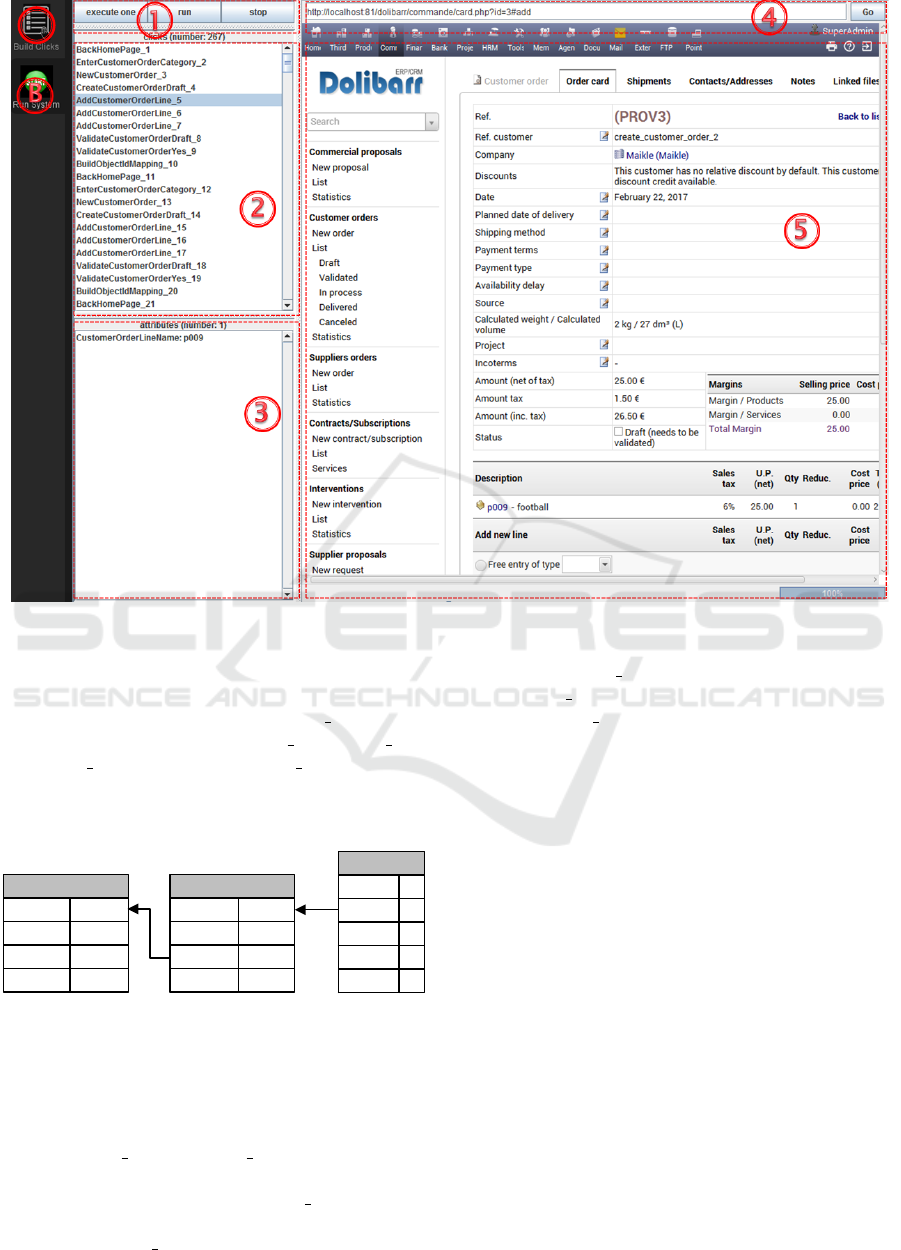
A
Figure 7: The “Run System” interface of the Data Generator.
table records all information related to customer or-
ders. Each table has some columns to store the input
attribute values in interfaces, e.g., “llx commande”
has columns such as “rowid”, “ref client”, “fk soc”
and “date creation”, and the “ref client” column
stores the input values in the “Ref.customer” filed in
Figure 5.
llx_commande (order)
rowid
ref_client
fk_soc
date_creation
232
customer_1
11
2017-12-22
16:04:50
llx_commandedet
(order line)
rowid
fk_commande
fk_product
675
232
1
qty
price
8
900
llx_societe (customer)
rowid
nom
phone
date_creation
11
Maikle
0687979632
2017-02-16
15:30:41
Figure 8: A segment of the data model of the generated data
in Table 1.
Figure 8 presents a segment of the data model of
the generated data, which specifies the table columns
and reference relations between tables. For instance,
the column “fk soc” in the “llx commande” table cor-
responds to a foreign key which references the pri-
mary key (i.e., “rowid”) of the “llx societe” table.
Each table in Figure 8 has an example record. The
record in the “llx commande” table references the
record in the “llx societe” table, as the value of the
column “fk soc” is equal to the value of the column
“rowid” in “llx societe”.
The generated data have the same structure as the
real-life data and contain complex relations such as
the many-to-many relation between orders and de-
liveries. Therefore, the data can support the evalua-
tion of data analysis techniques (Li et al., 2017; Mans
et al., 2010; Li et al., 2018a).
5 RELATED WORK
In this section, we review the existing approaches
used to generate data in both commercial and aca-
demic fields.
Commercial synthetic data generation products
(Centre, 2018; Global Software Applications, 2018;
IRI, 2018) do a good job producing moderate amounts
of simply defined data through polished and intuitive
user interfaces. However, they have limited range of
representation and are not easy to describe some types
of functional dependencies, relations and intra- and
inter-table constraints (Hoag, 2008).
Data generation tools have been developed in the
A Model-based Framework to Automatically Generate Semi-real Data for Evaluating Data Analysis Techniques
219

academic world as well (Scott and Wilkins, 1999;
Lin et al., 2006). These present new concepts in
the form of graph- and language-oriented synthetic
data description, providing greater flexibility in the
description and generation of synthetic data. An ap-
proach was proposed in (Gray et al., 1994) to generate
special-purpose data sets in parallel. It converts a sim-
ple sequential load into a parallel load, which turns a
two-day task into a one-hour task. (Bruno and Chaud-
huri, 2005) introduces a Data Generation Language
(DGL), to generate databases with complex synthetic
distributions and inter-table correlations. (Mans et al.,
2010) proposed experimental frameworks to generate
event data and specify, develop, test, and validate the
operational performance of systems.
Our approach differs from previously published
approaches in some aspects. First, the data are gener-
ated by real information systems, such that it always
has the same structure as the real-life data. Exist-
ing approaches can also generate the “semi-real” data,
but they require more efforts such as investigating the
data schema and how operations in the information
system change the database. Second, the user can de-
sign a business process to control the execution of in-
formation systems.
6 CONCLUSION
This paper proposes a framework to automatically
generate semi-real data. Indicated by the name, the
generated data are located between real-life data and
purely synthetic data. More precisely, it is generated
by automatically operating real information systems,
e.g., an ERP system Dolibarr. Therefore, it has the
same data structure as real-life data. The attribute
values in the data are created based on domain knowl-
edge and these may not be as precise as the values in
real-life data.
The framework is implemented as a ProM plu-
gin to support automatically operating on information
systems based on a simulation log (derived by simu-
lating a design model). Based on the generated data
and the designed model, various analysis techniques
can be verified.
REFERENCES
Bruno, N. and Chaudhuri, S. (2005). Flexible database gen-
erators. In Proceedings of the 31st international con-
ference on Very large data bases, pages 1097–1107.
VLDB Endowment.
Centre, P. B. (2018). DTM Database Tools.
http://www.sqledit.com/. Accessed: 2018-12-05.
Global Software Applications, L. (2018). GSAPPS.
http://www.gsapps.com/. Accessed: 2018-12-05.
Gray, J., Sundaresan, P., Englert, S., Baclawski, K., and
Weinberger, P. J. (1994). Quickly generating billion-
record synthetic databases. In Acm Sigmod Record,
volume 23, pages 243–252. ACM.
Hoag, J. E. (2008). Synthetic data generation: Theory, tech-
niques and applications. University of Arkansas.
Hoag, J. E. and Thompson, C. W. (2009). A parallel
general-purpose synthetic data generator1. In Data
Engineering, pages 103–117. Springer.
IRI, T. C. C. (2018). IRI RowGen.
http://www.iri.com/products/rowgen. Accessed:
2018-12-05.
Jensen, K. (2013). Coloured Petri nets: basic con-
cepts, analysis methods and practical use, volume 1.
Springer Science & Business Media.
Jensen, K. and Kristensen, L. M. (2009). Coloured Petri
nets: Modelling and validation of concurrent systems.
Springer Science & Business Media.
Li, G., de Carvalho, R. M., and van der Aalst, W. M. P.
(2017). Automatic Discovery of Object-Centric Be-
havioral Constraint Models. In BIS 2017, June 28–30,
2017, Proceedings, pages 43–58. Springer.
Li, G., de Carvalho, R. M., and van der Aalst, W. M. P.
(2018a). Configurable event correlation for pro-
cess discovery from object-centric event data. In
2018 IEEE International Conference on Web Services
(ICWS), pages 203–210. IEEE.
Li, G., de Murillas, E. G. L., de Carvalho, R. M., and van der
Aalst, W. M. P. (2018b). Extracting object-centric
event logs to support process mining on databases. In
CAiSE Forum, pages 182–199. Springer.
Lin, P. J. et al. (2006). Development of a synthetic data set
generator for building and testing information discov-
ery systems. In Information Technology: New Gener-
ations, 2006. ITNG 2006. Third International Confer-
ence on, pages 707–712. IEEE.
Mans, R. S., Russell, N. C., van der Aalst, W. M. P., Mole-
man, A. J., and Bakker, P. J. (2010). Schedule-aware
workflow management systems. In Transactions on
Petri nets and other models of concurrency IV, pages
121–143. Springer.
Murata, T. (1989). Petri nets: Properties, analysis and ap-
plications. Proceedings of the IEEE, 77(4):541–580.
Scott, P. D. and Wilkins, E. (1999). Evaluating data
mining procedures: techniques for generating artifi-
cial data sets. Information and software technology,
41(9):579–587.
van der Aalst, W. M., Bichler, M., and Heinzl, A. (2018).
Robotic process automation.
van der Aalst, W. M. P. (1998). The application of petri
nets to workflow management. Journal of circuits,
systems, and computers, 8(01):21–66.
van der Aalst, W. M. P., Li, G., and Montali, M. (2017).
Object-Centric Behavioral Constraints. Corr techni-
cal report, arXiv.org e-Print archive. Available at
https://arxiv.org/abs/1703.05740.
Zervos, C. (1977). Coloured Petri nets: Their properties
and applications. PhD thesis, University of Michigan,
Michigan.
ICEIS 2019 - 21st International Conference on Enterprise Information Systems
220
