
Learning Analytics in Higher Education using Peer-feedback and
Self-assessment: Use Case of an Academic Writing Course
Sabine Seufert, Josef Guggemos and Stefan Sonderegger
Institute of Business Education – Digital Learning, University of St.Gallen, Guisanstrasse 1a, 9010 St.Gallen, Switzerland
Keywords: Learning Analytics, Peer-feedback, Self-assessment, Academic Writing, Technology Acceptance Model.
Abstract: The growing prevalence of learner-centred forms of learning as well as an increase in the number of learners
actively participating on a wide range of digital platforms and devices give rise to an ever-increasing stream
of learning data. Learning analytics (LA) may enable learners, teachers, and their institutions to better
understand and predict learning and performance. However, the pedagogical perspective and matters of
learning design have been underrepresented in research thus far. We identify technology-supported peer-
feedback and self-assessment as particularly promising from an educational point of view. We present a use
case to demonstrate how these measures can be implemented. Using the technology acceptance model and a
sample of 484 undergraduate students, we identify factors for a successful implementation of technology-
supported peer-feedback and self-assessment.
1 INTRODUCTION
Big data and analytics are burgeoning fields of
research and development (Abdous and Yen, 2012;
Ali et al., 2012; Dyckhoff et al., 2012). In education,
several concurrent developments are taking place that
have implications for big data and analytics in the
field of learning. A wide range of promises and
anxieties about the coming era of big data and
learning analytics (LA) are in debate (Cope and
Kalantzis, 2016; Ifenthaler, 2015; Ifenthaler, 2014).
Overall, there is widespread consensus that the
educational landscape itself is in transition and the
changes are substantial, with expository instructional
methods being replaced by more learner-centred
approaches to learning. As more and more learning is
either taking place online or is supported through
technology, these active learners produce an ever
increasing stream of data – both inside learning
management systems (LMS) and outside, in other IT-
based environments (Pardo and Kloos, 2011).
LA refers to the use of ”dynamic information
about learners and learning environments to assess,
elicit, and analyze them for modeling, prediction, and
optimization of learning processes” (Mah, 2016, p.
288). As Roberts et al. (2017, p. 317) states: the
pedagogical potential is to provide students “with
some level of control over learning analytics as a
means to increasing self-regulated learning and
academic achievement”. Visualisation of
information, social network analysis and educational
data mining techniques are at the methodological core
of this newly emerging field (Greller and Drachsler,
2012). Techniques for analyzing big data are such as
machine learning and natural language processing
based on the particular characteristics of these data
for learner and teacher feedback, the possibility of
real-time governance, and educational research (Cope
and Kalantzis, 2016, p. 2).
While this field is multidisciplinary, the
pedagogical perspective appears to be somewhat
underrepresented (Greller and Drachsler, 2012).
Current research on big data in education revolves
largely around the potential of learning analytics to
increase the efficiency and effectiveness of
educational processes. Accordingly, the main
problem is that the core focus of research is on
prediction, while the potential for supporting
reflection on processes of learning has largely been
neglected (Seufert and Meier, 2019). However, there
is evidence for a high impact of peer-feedback and
self-assessment, as a manifestation of reflection, on
learning outcomes (Hattie and Timperley, 2007;
Nicol and Macfarlane-Dick, 2006). In this regard,
students may act as their own learning analytics using
their own data. We illustrate this idea by presenting a
use case. However, students might not utilize these
Seufert, S., Guggemos, J. and Sonderegger, S.
Learning Analytics in Higher Education using Peer-feedback and Self-assessment: Use Case of an Academic Writing Course.
DOI: 10.5220/0007714603150322
In Proceedings of the 11th International Conference on Computer Supported Education (CSEDU 2019), pages 315-322
ISBN: 978-989-758-367-4
Copyright
c
2019 by SCITEPRESS – Science and Technology Publications, Lda. All rights reserved
315
valuable resources outside the formal setting of the
use case. To get a better inside in the determinants of
students’ (voluntarily) use, we rely on the technology
acceptance model (TAM).
In this light, the aim of the paper is to investigate
determinants for students’ acceptance of online peer-
feedback and self-assessment.
2 PEER-FEEDBACK AND
SELF-ASSESSMENT
2.1 The Impact of Peer-feedback and
Self-assessment
In line with Kelly, Thompson and Yeoman (2015),
the claim that we put forth in this paper is that
“theory-led design has the potential to yield
innovation in the development of LA tools and, in
turn, that the development of LA tools and their use
may contribute to learning theory” (p. 15).
Feedback has among the highest influence on
learning outcomes (Hattie and Timperly, 2007). As
Evans (2013) discovered in a thematic analysis of the
research evidence on assessment feedback in higher
education (based on over 460 articles over a time span
of 12 years), effective online formative assessment can
enhance learner engagement during a semester class.
Focused interventions (e.g., self-checking
feedback sheets, mini writing assessments) can make
a difference to student learning outcomes as long
as their value for the learning process is made explicit
to and is accepted by students. The development of
self-assessment skills requires appropriate
scaffolding on the part of the lecturer working with
the students to achieve co-regulation (Evans, 2013).
Hence, we define digital learning assessments as “the
use of ICT to support the iterative process of
gathering and analyzing information about student
learning by teachers as well as learners and of
evaluating it in relation to prior achievement and
attainment of intended, as well as unintended learning
outcomes” (Pachler et al. 2010, p. 716).
High quality feedback may facilitate the
development of self-assessment skills (Nicol and
Macfarlane-Dick, 2006), which is regarded as a
precondition for lifelong learning.
2.2 Use Case: Peer-feedback and
Self-assessment and in an Academic
Writing Course
2.2.1 Context
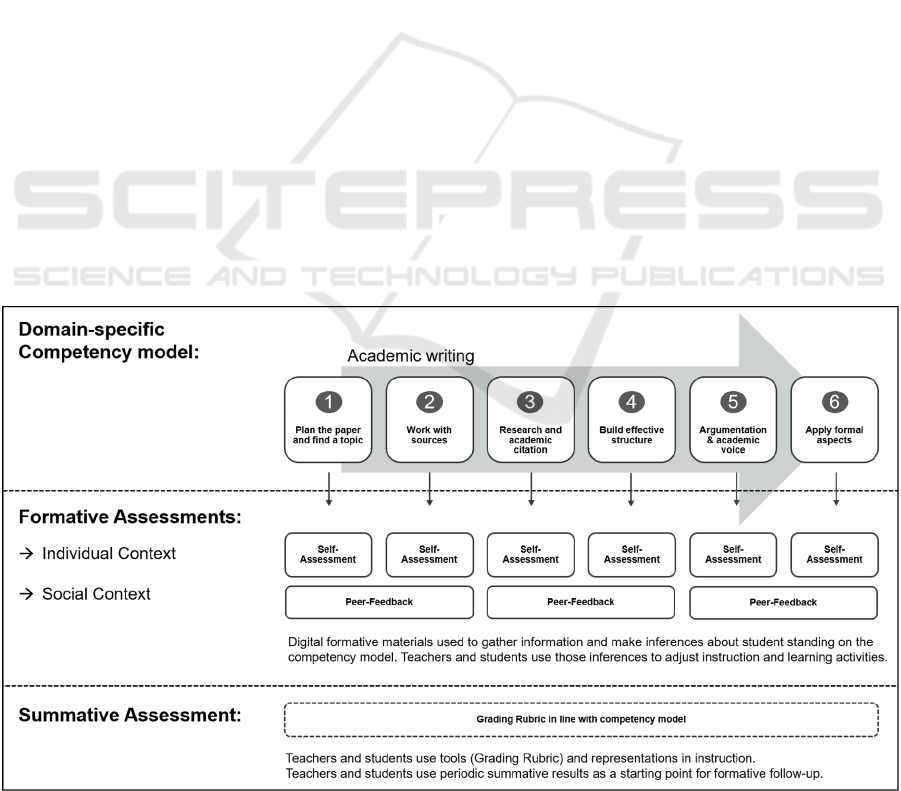
We have implemented technology-supported peer-
feedback and self-assessment in a University
beginner’s course (see figure 1). The utilized tools
can be deemed as dashboard applications (Verbert et
al., 2013). In total, 1615 students attended the course.
They are split up in groups of less than 24 persons. In
every group, a lecturer supports students during their
Figure 1: Use case: Academic writing (own illustration).
CSEDU 2019 - 11th International Conference on Computer Supported Education
316

learning. We utilize “Fronter v10 by itslearning” and
“Loom v2.9.15” as learning management systems
(LMS) to cope with the complexity of this large-scale
course. In the future, we will rely on “Canvas by
Instructure” as LMS.
A competency model of academic writing
structures the learning process and peer-feedback as
well as self-assessment. The model consists of six
development steps in academic writing. These units
correspond to the six units of the course (see figure
1). For a detailed description, see Seufert and
Spiroudis (2017). Our intention is to encourage
students to use domain-specific and theoretically
founded criteria to analyse their own work and that of
others. We think it is important to make students
aware that analysis and inferences should be informed
by theory rather than driven by the available data.
2.2.2 Peer-feedback
Right in the beginning of the course, lecturers inform
students about the decisive role of feedback in the
learning process from an educational point of view.
After every two units, students are supposed to
provide peer-feedback to the writing products of their
fellow students. To ensure high-quality feedback,
students receive an in-depth instruction on the
feedback process and the domain-specific
competency model. To this end, we use learning
videos and direct instruction during the lectures.
Drawing on this knowledge, students assess the
writing products, e.g. research question and abstract,
of two randomly assigned fellow students. We
scaffold the process by providing templates for
evaluation. Students are required to address positive
and negative aspects as well as concrete measures of
improvement. After the peer-feedback phase, the
lecturer reviews selected writing products and peer-
feedbacks. The LMS supports her/him in the selection
process. Good and bad practices of academic writing
are discussed within the groups. Furthermore, the
lecturer addresses the quality of the feedback. This
aims at fostering students’ ability to provide valuable
feedback. The described measures can be deemed as
formative assessments in individual and social
contexts. We regard technology-supported peer-
feedback as promising in many ways. In large-scale
courses, it is not feasible to give detailed feedback on
a regular basis to every single student. However, by
means of peer-feedback, we are able to cover learning
goals on a high taxonomy level of our competency
model. This would be not feasible using selected
response tasks. Moreover, we train a decisive
competence – providing and receiving feedback.
Through this process of in-depth dealing with the
subject matter, students might substantially increase
their academic writing skills. The LMS allows the
lecturer to allocate his/her time in an efficient way,
which is especially important in large-scale courses.
This may include focussing on students with special
needs. Moreover, typical mistakes can easily be
identified and thematised in instruction.
2.2.3 Self-assessment
During the first group session, the lecturer introduces
the students to the idea behind self-assessment and its
pedagogical objectives. The self-assessment is on a
voluntarily basis and can be done and repeated at any
time. However, the LMS reminds the student before
the unit and suggests taking part in the self-
assessment. The self-assessment comprises three
elements: A self-evaluation, a computer-based-
assessment, and an optional peer-comparison of the
results. Concerning self-evaluation, students rate
their current competence level, e.g. of ‘work with
sources’ on a percentage scale using the competency
model. Afterwards they answer test items that consist
of selected response questions and therefore can
automatically be scored. This makes the instrument
suitable for large-scale courses. The results are
presented in the dashboard where students can
compare their test results with their self-evaluation as
well as with the results of their peers. In a last step,
students are requested to analyse their knowledge
gaps, to define next steps, and to reflect the self-
assessment process. To ensure an anxiety-free
learning and reflection environment, lecturers do not
have access to the individual results. However, they
can watch the aggregated learning results of their
group. If they noticed deficits or abnormalities, they
may address these issues in the next unit.
3 STUDENTS’ ACCEPTANCE OF
PEER-FEEDBACK AND
SELF-ASSESSMENT
3.1 Method
3.1.1 Sample
Prior to the beginning of the mandatory academic
writing course for first semester bachelors students,
we asked all 1615 participants to fill in an online-
questionnaire. We obtained 484 responses. The
average student in the sample is aged 19.51 years (SD
Learning Analytics in Higher Education using Peer-feedback and Self-assessment: Use Case of an Academic Writing Course
317
= 1.44). 266 (54.94%) students in our sample come
from the German speaking part of Switzerland, 67
(13.84%) from the French speaking part, 36 (7.44%)
from the Italian speaking part; 66 (13.64%) are from
Germany and 49 (10.14%) from other countries.
Overall, 62.19% in the sample are females.
3.1.2 Theoretical Framework and Analysis
In line with Park (2009), we used a refined version of
the TAM to determine the intention to use peer-
feedback and self-assessment. Drivers for the
behavioural intention (BI) are attitude towards the
behaviour (AT), perceived usefulness (PU),
perceived ease of use (PE), social norms (SN), and
self-efficacy (SE). Drawing on his work, we have
developed items for measuring the constructs: BI (2
items, e.g. “I intend to be a heavy user of online-self-
assessment”), AT (2 items, e.g. “I am positive toward
online-self-assessment.”), PU (3 items, e.g. “Online-
self-assessment would improve my learning
performance.”), PE (3 items, “I find online-self-
assessment easy to use.”), SN (2 items, “My peer-
group would like me to use online-self-assessment.”),
and SE (2 items, “I feel confident using online-self-
assessment.”). The items are measured on a 7-point
rating scale, ranging from 1 “entirely disagree” to 7
“entirely agree”.
We use partial least squares structural equation
modelling (PLS-SEM, SMART-PLS 3.2.7). PLS-
SEM may be (in comparison to CB-SEM) the suitable
approach because we aim at predicting BI (Hair,
Ringle, and Sarstedt, 2011). Moreover, SN is
measured using a formative measurement model, and
our items are not normally distributed (Shapiro-Wilk
test: p < .05) which also suggests using PLS-SEM
(Hair, Ringle, and Sarstedt, 2011).
PLS-SEMs are interpreted in two steps:
evaluation of the measurement model and assessment
of the structural model that deals with the
relationships between the constructs. PLS-SEM also
offers a method that allows us to identify the most
important drivers for BI: importance-performance-
map analysis (IPMA) (Ringle and Sarstedt, 2016). In
our case, IPMA shows how the five constructs are
shaping BI, which considers direct and indirect
effects (importance [I]). Effects are calculated using
unstandardized path coefficients. Students’ average
latent variable scores on a percentage scale indicate
the performance (P). The goal is to identify those
constructs that have a relatively high importance for
BI (i.e. those that have a strong total effect), but also
have a relatively low performance (i.e. low average
latent variable scores). We considered all direct and
indirect paths as claimed by Park (2009).
3.2 Results
3.2.1 Peer-Feedback
The measurement model is sound in every respect
(Hair, Sarstedt, Ringle, and Mena, 2012; Hensler,
Ringle, and Sarstedt, 2015), see table 1. The measures
are reliable, indicated by Cronbach’s alpha and
composite reliability above .70. Convergent validity
is established as all standardized factor loadings
exceed .70. Hence, for every construct, the average
variance extracted (AVE) is greater than .50, which
indicates convergent validity. Discriminant validity
might be ensured because the square roots of AVE are
always higher than the correlations among the
constructs (Fornell-Larcker criterion). Moreover, the
SRMR is .057 and below the threshold of .06 (Hu and
Bentler, 1999).
Table 1: Quality of measurement model: peer-feedback.
Figure 3 depicts the path model for predicting the use
of peer-feedback. Like Park (2009), we considered
direct and indirect relationships. We found the
following significant total effects on BI: AT (β =
0.283, p <.001), PU (β = 0.303, p <.001), SN (β =
0.367, p <.001), and SE (β = 0.265, p <.001.
However, PE does not significantly affect BI (β
= -.096, p = .069).
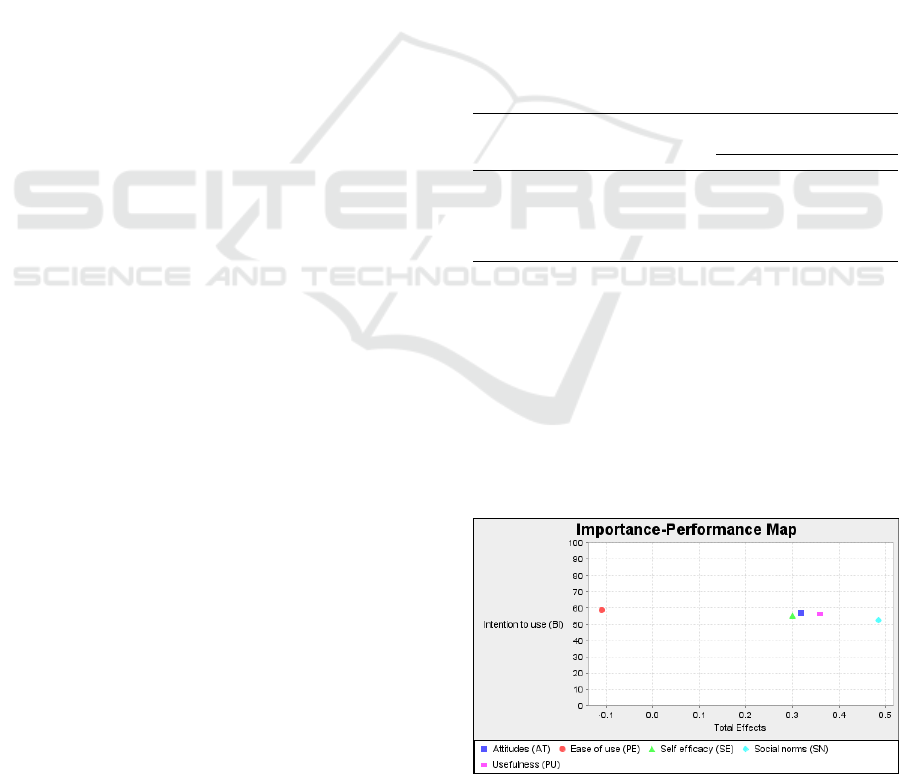
Figure 2: Importance performance map analysis for peer-
feedback (n=484).
Construct
Square root of AVE on diagonal/
Correlations among constructs
α ρc AVE (1) (2) (3) (4) (5) (6)
(1) Attitudes (AT) 0.85 0.93 0.87 .93
(2) Ease of use (PE) 0.90 0.94 0.83 .40 .91
(3) Self efficacy (SE) 0.72 0.88 0.78 .54 .63 .88
(4) Social norms (SN) n/a
.53
.37 .51 n/a
(5) Intention to Use (BI) 0.85 0.93 0.87 .56 .24 .45 .50 .93
(6) Usefulness (PU) 0.89 0.93 0.82 .80 .44 .52 .54 .51 .90
N
ote. α = Cronbach’s alpha; ρ
c
= composite reliability; AVE = average variance extracted.
Social norms: Formative measurement model.
CSEDU 2019 - 11th International Conference on Computer Supported Education
318
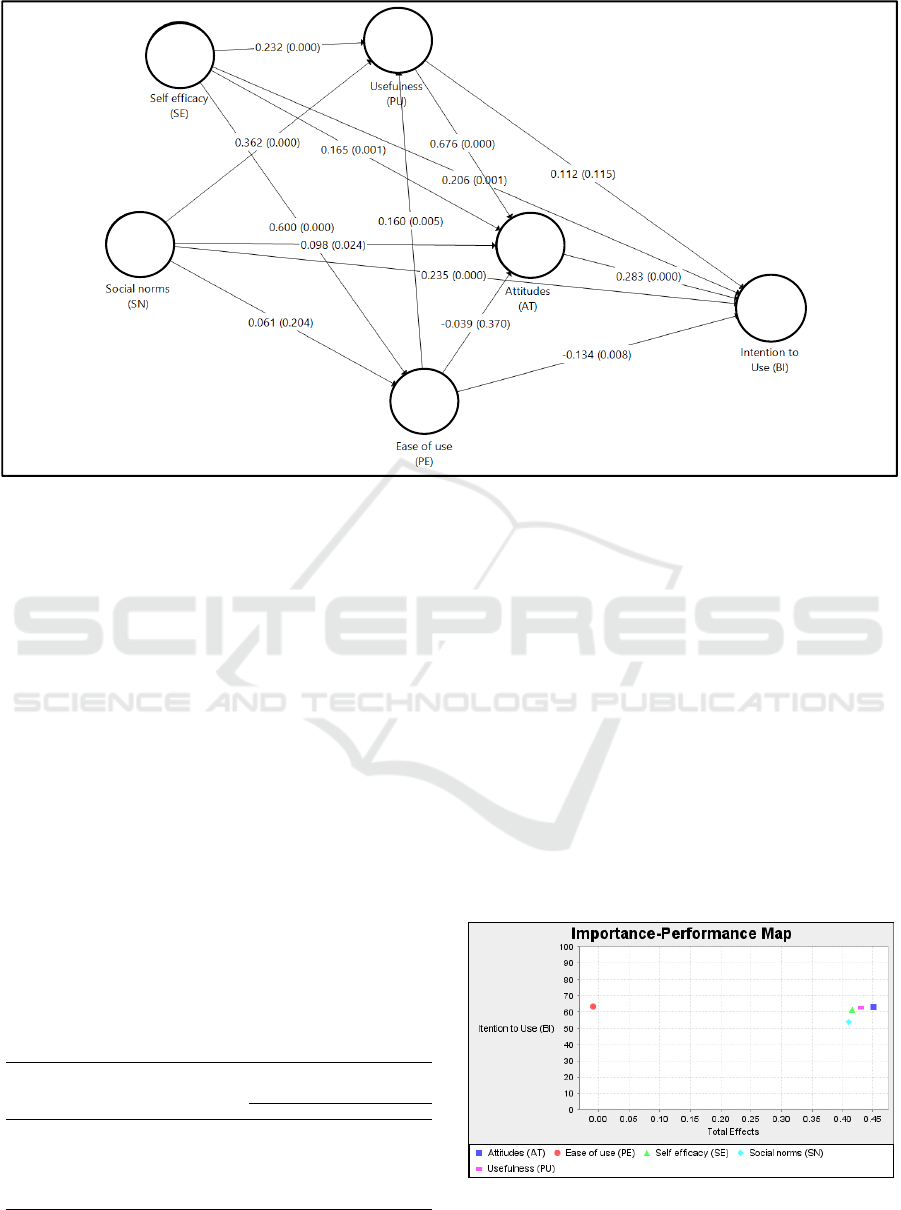
Figure 3: Path model peer-feedback (n=484).
IPMA, see figure 2, indicates that all determinants of BI
show substantial room for improvement; the performan-
ce never exceeds 60%. Concerning importance, SN
shows the highest impact on BI. The performance of SN
is slightly lower than that of the other determinants. PU,
PA, and SE yield similar performance.
3.2.2 Self-assessment
The quality of the measurement model for self-
assessment is high. The measures show decent
reliability, indicated by Cronbach’s alpha and
composite reliability above .80. Convergent validity is
established as all standardized factor loadings exceed
.70 and AVE is always greater than .50, which is
evidence for convergent validity. Discriminant validity
may also be ensured because the square roots of AVE
are always higher than the correlations among the
constructs (Fornell-Larcker criterion). The SRMR
equals .050, which is sufficiently low. The assessment
of the measurement model is summarized in table 2.
Table 2: Quality of measurement model: self-assessment.
We find the following significant total effects on BI: AT
(β = 0.391, p <.001), PU (β = 0.353, p <.001), SN (β =
0.291, p <.001), and SE (β = 0.372, p <.001). However,
PE (β = -0.007, p = .991) does not significantly affect
BI. Figure 5 depicts the SEM for self-assessment. Figure
4 shows the IPMA results. AT has the strongest
influence on BI (importance), followed by PU, SE, and
SN. In terms of performance, all constructs offer
potential for increase as they are below 64%.
3.3 Discussion
The measurement models are sound in terms of
reliability and convergent as well as discriminant
validity. Moreover, SRMR is below .06, which is
sufficiently low (Hu and Bentler, 1999).
Figure 4: Importance performance map analysis for self-
assessment (n=484).
Construct
Square root of AVE on diagonal/
Correlations among constructs
α
ρc AVE (1) (2) (3) (4) (5) (6)
(1) Attitudes (AT) 0.90 0.95 0.91 .95
(2) Ease of use (PE) 0.92 0.95 0.86 .55 .93
(3) Self efficacy (SE) 0.82 0.85 0.85 .64 .74 .92
(4) Social norms (SN) n/a
.47
.39 .45 n/a
(5) Intention to Use (BI) 0.83 0.92 0.85 .62 .39 .50 .46 .92
(6) Usefulness (PU) 0.89 0.95 0.86 .83 .58 .60 .49 .56 .93
N
ote. α = Cronbach’s alpha; ρc = composite reliability; AVE = average variance extracted.
Social norms: Formative measurement model.
R
2
=
39.3%
R
2
=
66.3
%
R
2
=
38.5%
R
2
=
40.1%
Learning Analytics in Higher Education using Peer-feedback and Self-assessment: Use Case of an Academic Writing Course
319
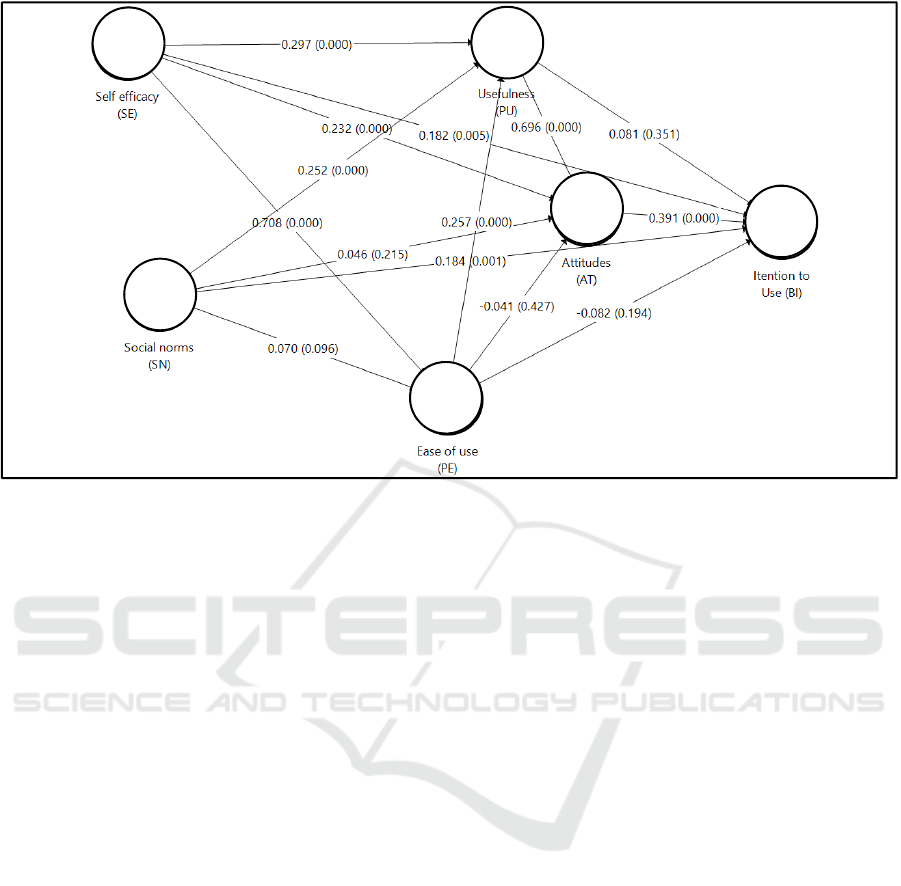
Figure 5: Path model self-assessment (n=484).
Therefore, the items might be suitable for
operationalizing the constructs for evaluating
students’ acceptance of peer-feedback and self-
assessment. The predictive power is sufficiently high.
For the intention to use peer-feedback, R
2
equals
39.3%, for self-assessment 43.1%. Thus, we regard
the model as useful for explaining students’ intention
to use peer-feedback and self-assessment.
Intention to use peer-feedback and self-
assessment both show potential for increase.
Currently, the performance is 41.4% and 49.4%,
respectively. In other words, students rather not have
the intention to use those means. This is an issue
because peer-feedback and self-assessment are
decisive building blocks in a lifelong learning
process.
In terms of peer-feedback, social norms have the
highest influence on intention to use and a moderate
performance (Ι = 0.486, P = 52.4%). Since we use a
formative measurement model, we are able to split up
this effect. The effect can mainly be attributed to the
influence of the peer group. Perceived usefulness has
also an important influence on the intention to use
peer-feedback (Ι = 0.358, P = 56.4%). Self-efficacy
concerning the ability to provide valuable feedback
plays also a considerable role for the intention to use
peer-feedback (I = 0.300, P = 55.2%). Like Park
(2009), we did not find a significant influence of
perceived ease of use on behavioural intentions.
Students might accept reasonable effort to make
themselves familiar with the necessary instruments.
Nevertheless, we regard user-friendly platforms as
vital because ease of use significantly and positively
influences perceived usefulness.
Concerning self-assessment, positive attitudes
have the highest impact on behavioural intentions (I
= 0.451, P = 62.8%). Positive attitudes themselves are
heavily influenced by perceived usefulness (I = 0.736,
62.6%) and self-efficacy (I = .520, P = 62.3%). Both
have also a considerable impact on behavioural
intentions: I = 0.430 and 0.416, respectively.
Again, perceived ease of use does not influence
behavioural intentions.
Comparing the results for peer-feedback and self-
assessment, the main difference is that social norms
play in comparison to the other drivers a smaller role
for self-assessment. This is not surprising as peer-
feedback includes by nature a social component.
The survey was voluntary and yielded a response
rate of 30%. However, self-selection effect may be a
threat to the validity of the results.
3.4 Practical Implication
Social norms in form of perceptions of the peer group
are especially important for the intention to use peer-
feedback. Lecturers may therefore aim at establishing
a positive and commonly shared sentiment towards
this instrument.
In terms of peer-feedback and self-assessment,
lecturers might create positive attitudes by
demonstrating their usefulness. Since an important
R
2
=
44.9%
R
2
=
72.9
%
R
2
=
43.1%
R
2
=
55.5%
CSEDU 2019 - 11th International Conference on Computer Supported Education
320

part of usefulness is the perceived learning outcome,
lecturers might present research results about the high
impact of feedback and self-assessment on learning
outcomes. Moreover, by using peer-feedback and
self-assessment students might gain awareness of its
benefits because the quality of their work
substantially increases due to these means.
Students’ self-efficacy may be addressed through
instruction. Students could be trained in how to
provide and receive proper feedback. Furthermore,
students may be trained in suitable platforms that they
can use for peer-feedback and self-assessment.
4 CONCLUSION AND OUTLOOK
Competency development on the part of the data
clients (students, teachers/tutors, institutions) is a key
requirement. Greller and Drachsler (2012, p. 51) have
pointed out that the large majority of students
currently do not have the required skills to interpret
LA results and to determine appropriate next
activities. A superficial understanding of data
presentation can lead to false conclusions.
Furthermore, it is important to understand that data
not included in the respective LA approach may be
equally if not more important than the data set that is
included. To judge a learner’s performance merely on
one aspect, such as quantitative data provided by a
LMS, is like looking at a single piece taken from a
larger jigsaw puzzle. Lifelong learning takes place
across a wide range of schooling, studying, working,
and everyday life situations. In addition to
competency requirements, acceptance factors
influence the application or decision making that
follows an analytics process. Lack of acceptance of
analytics systems and processes can lead to blunt
rejection of either the results or the suggestions on the
part of relevant constituencies (data clients). In order
to deal with these issues, future research should focus
on empirical evaluation methods of learning analytics
tools (Ali et al., 2012; Scheffel, 2014) and on
competency models for ‘digital learning’ (Dawson
and Siemens, 2014).
Embedded in our use case, we present two LA
measures – technology-supported peer-feedback and
self-assessment. They are based on a Student Tuning
Model as a continual cycle in which students plan,
monitor, and adjust their learning activities (and their
understanding of the learning activities) as they
engage with LA (Wise et al., 2016). Drawing on a
sample of 484 undergraduate students and the TAM,
we identified important drivers for students’
acceptance. From our point of view, the use case
already considers many of these drivers of
behavioural intentions. The current course setting
includes teamwork in smaller groups. These learner
groups can be further supported towards common
learning goals, strategies and closer collaboration.
Once there is a trusted social group established, a
peer-feedback within this group might be better
addressed and perceived. For self-assessments, we
plan to provide more detailed/customized LA
dashboards where learners can set up peer-
comparisons based on their learning groups. Our
results also lead us to further focus on the appropriate
scaffolding on the part of the lecturer, as proposed by
Evans (2013). The development of self-assessment
skills (and meta-cognitive learning strategies)
through LA measures requires close support from the
lecturer from the outset.
For a thorough evaluation of our use case, we will
survey the students after they will have taken the
course. By this means, we want to investigate to what
degree we were successful in fostering students’
acceptance of peer-feedback and self-assessment. To
gain a comprehensive insight, we will also collect
qualitative data and evaluate our use case in a mixed
methods design.
REFERENCES
Abdous, M., He, W., Yen, C.-J., 2012. Using Data Mining
for Predicting Relationships between Online Question
Theme and Final Grade. Educational Technology &
Society, 15(3), 77–88.
Buckingham Shum, S., Ferguson, R., 2012. Social Learning
Analytics. Educational Technology & Society, 15 (3),
3–26.
Cope, B., Kalantzis, M., 2016. Big Data Comes to School:
Implications for Learning, Assessment, and Research.
AERA Open, 2(2), 1-19.
Dawson, S., Siemens, G., 2014. Analytics to literacies: The
development of a learning analytics framework for
multiliteracies assessment. The International Review of
Research in Open and Distributed Learning, 15(4).
Retrieved from http://www.irrodl.org/index.php/
irrodl/article/view/1878/3006
Deterding, S., Dixon, D., Khaled, R., Nacke, L., 2011. From
Game Design Elements to Gamefulness. In Academic
MindTrek 2011, ACM Digital Library. ACM Special
Interest Group on Computer-Human Interaction. and
ACM Special Interest Group on Multimedia. (Eds.),
Proceedings of the 15th International Academic
MindTrek Conference Envisioning Future Media
Environments. Defining „Gamification“(pp. 9–15).
ACM Press: New York.
Dyckhoff, A. L., Zielke, D., Bültmann, M., Chatti, M. A.,
Schroeder, U., 2012. Design and Implementation of a
Learning Analytics in Higher Education using Peer-feedback and Self-assessment: Use Case of an Academic Writing Course
321

Learning Analytics Toolkit for Teachers. Educational
Technology & Society, 15 (3), 58–76.
Evans, C., 2013. Making sense of assessment feedback in
higher education. Review of Educational Research, 83,
70–120.
Greller, W., Drachsler, H., 2012. Translating Learning into
Numbers: A Generic Framework for Learning
Analytics. Educational Technology & Society, 15(3),
42–57.
Hair, J. F., Ringle, C. M., Sarstedt, M., 2011. PLS-SEM.
Indeed a silver bullet. In: Journal of Marketing theory
and Practice 19 (2), S. 139–152.
Hair, J. F., Sarstedt, M., Ringle, C. M., Mena, J. A., 2012.
An assessment of the use of partial least squares
structural equation modeling in marketing research. In:
Journal of the Academy of Marketing Science 40 (3), S.
414–433.
Hattie, J., Timperley, H., 2007. The Power of Feedback.
Review of Educational Research, 77(1), 81–112.
Henseler, J., Ringle, C. M., Sarstedt, M., 2015. A new
criterion for assessing discriminant validity in variance-
based structural equation modeling. In: Journal of the
Academy of Marketing Science 43 (1), S. 115–135.
Hu, L., Bentler, P. M., 1999. Cutoff criteria for fit indexes
in covariance structure analysis: conventional criteria
versus new alternatives. Structural Equation Modeling,
6 (1), 1–55.
Ifenthaler, D., 2015. Learning analytics. In J. M. Spector
(Ed.), The SAGE encyclopedia of educational
technology (Vol. 2, pp. 447–451). Thousand Oaks, CA:
Sage.
Ifenthaler, D., Widanapathirana, C., 2014. Development
and validation of a learning analytics framework: Two
case studies using support vector machines.
Technology, Knowledge and Learning, 19(1–2), 221–
240.
Ifenthaler, D., Adcock, A. B., Erlandson, B. E., Gosper, M.,
Greiff, S., Pirnay-Dummer, P., 2014. Challenges for
education in a connected world: Digital learning, data
rich environments, and computerbased assessment—
Introduction to the inaugural special issue of
technology, knowledge and learning. Technology,
Knowledge and Learning, 19(1), 121–126.
Kelly, N.; Thompson, K., Yeoman, P., 2015. Theory-led
design of instruments and representations in learning
analytics: Developing a novel tool for orchestration of
online collaborative learning. Journal of Learning
Analytics, 2(2), 14–43.
Mah, D.-K., 2016. Learning Analytics and Digital Badges:
Potential Impact on Student Retention in Higher
Education. Technology, Knowledge and Learning
21(2), 285–305.
Nicol, D. J., MacfarlaneDick, D., 2006. Formative
assessment and selfregulated learning: a model and
seven principles of good feedback practice. Studies in
Higher Education, 31(2), 199–218.
Pachler, N., Daly, C., Mor, Y., Mellar, H., 2010. Formative
e-assessment: Practitioner cases.
Computers &
Education 54(3):715–721.
Pardo, A., Kloos, C. D., 2011. Stepping out of the box:
Towards analytics outside the learning management
system. Proceedings of the 1st International
Conference on Learning Analytics and Knowledge (pp.
163–167). ACM Press: New York.
Park, S. Y., 2009. An Analysis of the Technology
Acceptance Model in Understanding University
Students’ Behavioral Intention to Use e-Learning, 12,
150–162.
Ringle, C. M., Sarstedt, M., 2016. Gain more insight from
your PLS-SEM results. Industrial Management & Data
Systems, 116(9), 1865–1886.
Roberts, L. D., Howell, J. A., Seaman, K., 2017. Give Me a
Customizable Dashboard: Personalized Learning
Analytics Dashboards in Higher Education.
Technology, Knowledge, and Learning, 22(3), 317-333.
Seufert, S., Meier, C., 2019 in print. Big Data in Education:
Supporting Learners in Their Role as Reflective
Practitioners. In Kopper, R. (Eds.), Big Data in
Education. New York et al.: Springer.
Seufert, S., Spiroudis, E., 2017. Wissenschaftliche
Schreibkompetenz in der Studieneingangsphase
fördern: Erfahrungen mit einem Rückmelde- und
Bewertungsraster (Rubric). Zeitschrift Schreiben, 15.
Feb., 1-9. Retrieved from https://zeitschrift-schreiben.
eu/globalassets/zeitschrift-schreiben.eu/2017/seufert_s
piroudis_studieneingangsphase.pdf
Siemens, G., Gasevic, D., Haythornthwaite, C., Dawson, S.,
Shum, S. B., Ferguson, R., Baker, R. S. J. d., 2011, July
28. Open Learning Analytics: an integrated &
modularized platform. Retrieved from
http://solaresearch.org/OpenLearningAnalytics.pdf
Verbert, K., Duval, E., Klerkx, J., Govaerts, S., Santos, J.
L., 2013. Learning Analytics Dashboard Applications.
American Behavioral Scientist, 57(10), 1500–1509.
Wise, A. F., Vytasek, J. M., Hausknecht, S., Zhao, Y., 2016.
Developing learning analytics design knowledge in the
“middle space”: The student tuning model and align
design framework for learning analytics use. Online
Learning, 20(2). Retrieved from https://olj.online
learningconsortium.org/index.php/olj/article/view/783
CSEDU 2019 - 11th International Conference on Computer Supported Education
322
