
Towards Visual Explorations of Forums’ Collective Dynamics in
Learning Management Systems
Malik Kon
´
e
1,2
, Madeth May
1
, S
´
ebastien Iksal
1
and Souleyman Oumtanaga
2
1
LIUM, Le Mans Universit
´
e, Le Mans, France
2
LARIT, INP-HB, Yamoussoukro, C
ˆ
ote d’Ivoire
Keywords: Visualization, Forum, Social Network, Learning Analytics.
Abstract:
Discussion and exchange among peers have being hailed as an essential part of learning since at least, Vygot-
sky’s socio-constructivist theory. There, learning is presented as a subtle and dynamical collective process.
Hence, despite numerous efforts to understand how learners engage and maintain inspiring discussions, re-
searchers continue to question how to effectively reinforce the collective actions. In Learning Management
Systems (LMSs) they propose Learning Dashboards (LDBs) to learners, tutors, and managers to help them
monitor various learning indicators. But only recently have they employed Natural Language Processings
(NLPs) and Social Network Analysis (SNA) techniques to display temporal indicators incorporating the fo-
rums’ content analysis and the learners’ behavioral patterns. In this study, we present our design efforts to
model a scalable and portable indicator of collective actions. We aim to support tutors’ monitoring of fo-
rums’ activities through explorable visualizations. We review previous researches about visual explorations
of Forums’ content and online collaboration’s measures. We expose in progress visualizations built from
three different datasets and propose directions towards further development of indicators to monitor collective
actions.
1 INTRODUCTION
Modern online learning environments often rely on
forums and chats for their students to exchange in-
formation about a subject, get help from peers and
tutors or socialize. When attendance is massive –as
currently in popular Massive Open Online Courses
(MOOCs)–, or if the course session spread over a long
period of time, the forums’ messages rapidly become
intractable. Therefore, the mass of information is de-
valued and can even be a burden on the learners and
tutors as the former struggle to find adequate peers to
support learning collectively and the latter are over-
whelmed by numbers.
Efforts have been made to help tutors analyze the
students’ exchanges in forums but, as we will see in
section 3, these analyses are often limited to a small
set of individuals or are topic specific. Also, the anal-
ysis usually takes place at the end of the learning ses-
sion and does not allow “real-time” guidance.
Meanwhile, interactions taking place in fo-
rums account for essential aspects of the socio-
constructivist learning theory. Vygotsky emphasizes
the importance of discussions as they take learners
at the fringe of their knowledge domain, the proxi-
mal development zone. There, they push back their
knowledge barrier and build new knowledge to fill
the gaps spotted during discussions. Therefore, fa-
cilitating forums’ usages in ways that encourage dis-
cussions and collective actions should theoretically be
beneficial to the learning experience of all actors. But
as far as we know, there is yet no method to come
up with a generic and dynamic way to explore the
social interactions taking place in Learning Manage-
ment System (LMS). Learners often struggle to build
a sense of belonging (Khalil and Ebner, 2014) and
tutors have difficulties supporting effective collective
actions (Zheng et al., 2015).
Well-designed learning dashboard could help sup-
port collective actions by enabling the exploration of
the forums’ interactions. They would offer the pos-
sibility for the tutor and administrator to better un-
derstand how students and discussed topics evolve,
as well as facilitate the curriculum design improve-
ments. Learning Dashboards (LDBs) could also help
learners develop reflexive competencies and increase
their engagement.
In this paper, we report our first step towards facil-
Koné, M., May, M., Iksal, S. and Oumtanaga, S.
Towards Visual Explorations of Forums’ Collective Dynamics in Learning Management Systems.
DOI: 10.5220/0007716000670078
In Proceedings of the 11th International Conference on Computer Supported Education (CSEDU 2019), pages 67-78
ISBN: 978-989-758-367-4
Copyright
c
2019 by SCITEPRESS – Science and Technology Publications, Lda. All rights reserved
67
itating collective activities with tools supporting the
tutor in their visual exploration of the Virtual Univer-
sity of C
ˆ
ote d’Ivoire (VUCI)’s forums. In the next
section, we define collective dynamic and explain
why we see it differently from collaboration. Then,
in section 3, we recall previous efforts made to mon-
itor collective actions and use LDBs as support tools.
In section 4, we present our model and propose a way
to come up with an interactive visualization (or ex-
plorable) of the forum’s collective dynamic. We illus-
trate it, in the 5
th
section with our firsts visualizations
built from different datasets that we will have detailed
in the preceding section. Finally, we discuss our vi-
sualizations’ limitations and future developments in
section 6.
2 VISUALIZATION OF
COLLECTIVE DYNAMICS IN
LMSs
The first clarification we make is between visual-
ization and Learning Dashboard (LDB). A Learning
Dashboard is a “single display that aggregates dif-
ferent indicators about the learner learning process
and/or learning context into one or multiple visual-
izations” (Schwendimann et al., 2017). We will use
the term visualization when the LDB can be made of
single visualization and keep the term LDB when it
incorporates clearly several visualizations. We will
consider discussions taking place in LMSs or in other
online applications if they are used in an educational
context. We understand that LMSs are applications
designed with the intention of being teaching tools,
but sometimes we may refer to Google Hangouts as
a LMS too. If so, it is because we consider the spe-
cific Hangouts chat from the G Suite for Education
which was built with the intent to support teaching
and learning.
We collected 7 datasets from Coursera, Hangouts,
and Moodle. The datasets are different in size and
quality. Table 1 and Section 4 further details the
means of collection, the datasets specificities.
2.1 Actions in Forums
We make an important distinction between collab-
orative actions and collective actions. Dillenbourg
(1999) define collaboration as a coordinated syn-
chronous activity born from the persistent will to
share a common perception of a problem originat-
ing from people with similar social roles. Taken as
a bottom-up process with the coordination coming up
from the actors themselves, collaboration is difficult
to automatically analyze. It implies that to coordi-
nate, each actor evaluates the intentions of others and,
doing so, each instantiates a theory of mind (Ger-
stenberg and Tenenbaum, 2017) that would be very
challenging to implement artificially. Therefore we
use the term “collective action” instead of “collabo-
ration” to emphasize the fact that we do not assume
a shared intention or shared goal in the actors’ inter-
actions. We focus on a set of observable actions and
leave the deduction of the interaction’s intent to the
observer. Nevertheless, we use the expression “col-
lective action” instead of the more generic “social in-
teraction” to bear in mind that from the observer point
of view, the studied interactions have a shared goal.
This is not true for all social interactions. So, to wrap
up, in a collaborative interaction the shared goal can
be made explicit by the actors, in a collective inter-
action, it is subjective to the observer, and in social
interactions, it may not exist at all.
The elementary actions we are most concerned
with are those taking place in forum and chats of
LMSs. In general, they are publications and mes-
sages’ comments, but messages’ up and down votes,
publication times are significant and integrated into
the model that we elaborate in section 4.
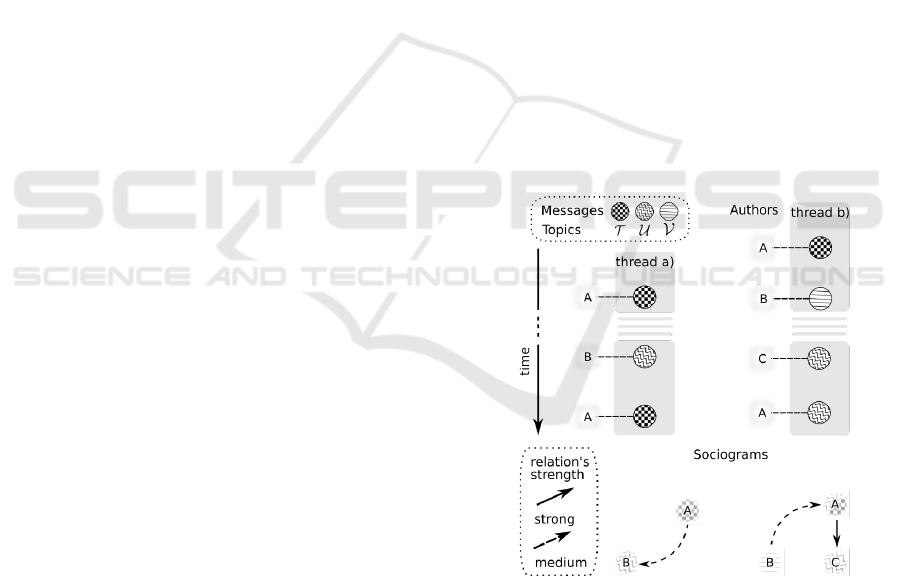
Figure 1: Illustration of how the strength of actors’ ties
(or links) varies as a function of time and topic overlap.
Thread a corresponds to actor-topic dynamic (1a) where B’s
late post after A’s 1
st
publication does not correlate strongly
enough to create the link from B to A. But A’s 2
nd
post is
timely enough, although not exactly on the same topic as
B’s message, to create the tie A 99K B drawn as a dashed
arrow. In thread b, in addition to the tie B 99K A, we have
a topic overlap and time proximity between C and A. This
makes a the strong tie A → C.
CSEDU 2019 - 11th International Conference on Computer Supported Education
68

Forums and Chat. Depending on the LMS, dif-
ferent tools exist to facilitate discussions between
peers. The main distinction is historical and separated
asynchronous tools, forums, from synchronous aimed
chats. Hence, forums’ hierarchical structure is of-
ten more fine-grained than that of chats because their
posts were always meant to be persistent. On the other
hand, chats have better online awareness and presence
indicators.
In this study, we consider that a forum is made
of discussions and that each discussion is created
from an initial message followed by other messages.
This sequence of messages is what we call a dis-
cussion thread. A discussion may contain several
threads if comments are allowed or if explicit refer-
ences are made to previous publications. In that case,
the new thread will contain the referenced messages
up to the initial one and all subsequent comments. In
chats, several interrelated threads may also appear in
a unique discussion when one explicitly mentions a
previous message.
Despite their historical differences, today, both fo-
rum and chat can be used for synchronous and asyn-
chronous online discussions. One can subscribe to
a forum’s discussion and receive alerts as soon as a
new message is published. And a history of posts is
kept in modern chats, while the creation of several
co-existing chats has been facilitated. Each chat is,
then, equivalent to a forum discussion. Finally, both
forums and chats display messages’ timestamp and
authors’ information. So for simplicity, we will call
indifferently “forum” any virtual discussion space in
a LMS.
2.2 Collective Dynamics
Collective dynamics are time-dependent interactions
spurring for the messages co-occurrence in the fo-
rums’ discussions.
Actors’ Messages Dynamics. How do actors’ mes-
sages spread over time ? Let (τ
i
)
1,2,3
be three mes-
sages timestamp and A, B, C three actors. Col-
lectively, the actors’ messages could be distributed
as A
1
, B
2
, C
3
, meaning that A, B and C respectively
posted one message at timestamp τ
1
, τ
2
, τ
3
. But an-
other dynamic could be that actor A, alone, published
the three messages, thus A
1
, A
2
, A
3
; or alternatively
that A published a message at τ
1
and B at timestamp τ
2
and τ
3
, thus A
1
, B
2
, B
3
. These denote different dynam-
ics for the actors’ messages. Visualizing them helps to
identify the users posting behavior and distinguishing
learners’ behavior, for example, active from lurkers.
Topics’ Messages Dynamics. How do messages
spread over time and topics ? Or how topics are cov-
ered by messages over time ? Latent Dirichlet Al-
location (LDA) based methods are commonly used
Bayesian parametric methods to approximate a mes-
sage’s topic or topics mixture (Jelodar et al., 2017).
To map each message to a point in topic space Φ we
can also use other statistical non-parametric methods
such as stochastic block model (Gerlach et al., 2018).
The aim is to represent a message M in the topic
space which can be, for example, the set of probabil-
ity distributions over Φ = T × U × V where a point
M = (.7, .1, .2) denotes that the message is made of
topics T , U and V respectively in proportions .7, .1
and .2. To simplify the next examples we suppose that
each message maps to a unique topic. M from topic
T would be the point (1, 0, 0).
A simple topic message dynamics example is
T
1
, T
2
, T
3
, where all three messages are on the topic
T . At the opposite we could have T
1
, U
2
, V
3
where
each message maps respectively to topics T , U and
V .
This type of dynamic shows the evolution of the
topics’ popularity in the LMS, or the evolution of top-
ics’ interest over time.
Actor-topics’ Dynamics. How do an actor’s mes-
sages cover topics over time? Let (AT )
i
be the mes-
sage with timestamp τ
i
posted by actor A and on topic
T . The two threads in Figure 1 illustrate the follow-
ing actor-topics dynamics:
(AT )
1
, · ·· , (BU)
8
, (AT )
9
(1a)
(AT )
1
, (BV )
2
, · ·· , (CU)
8
, (AU)
9
(1b)
Where (1a) denotes that actor A published two
messages both on topics T , but the 2
nd
came after
B’s message on topic U that was published long after
(·· ·) A’s 1
st
message.
In (1b), B publishes a message on topic V imme-
diately after A’s message on T . Then, after some time
and other publications, A posts a message on yet a 3
rd
topic U, similar to what C had just published on.
From the above observable dynamics, we can de-
fine two more dynamics: the actor-actor and topic-
topic dynamics.
Actor-actor’s Dynamics. The actor-actor’s dynam-
ics can be taken as the evolution of the actor’s social
network where the actors are linked by message close-
ness and past interactions. We suppose that messages
posted on overlapping topics in the same discussion
Towards Visual Explorations of Forums’ Collective Dynamics in Learning Management Systems
69

by different actors potentially indicate some interac-
tions between the authors. This may not always be the
case.
Figure 1 exemplifies how the strength of mes-
sages correlation is made of, topic, temporal and actor
closeness. What is not shown in this figure is that the
strength of the tie may also depend on previous ac-
tors’ interactions, that is the social network built from
previous messages correlations. We will detail this in
section 4 and explain how we avoid inferring causal
interactions from the messages’ correlations.
If a message is published shortly after another then
their correlation should be strong. In example (1b),
actors A and C would have a strong interaction be-
cause they published on the same topic U and their
respective messages’ timestamp are close. An inter-
action also exists between actors A and B but proba-
bly weaker because it is only based on the messages’
timestamp and not the topic overlaps. The relation-
ship between actors B and C would be even weaker if
it existed at all. Their messages are far apart and not
on the same topic.
So, from the message topic, time and actor cor-
relations we build a directed graph representing the
social network of messages exchanged between the
LMS actors. The evolution of that network is what
we call the actor-actor dynamic.
Topic-topics’ Dynamics. This type of dynamic
concerns the way the topic’s correlations evolves over
time. For example, if at the beginning of a course,
topics T and U tend to be closely connected because
students often mix them up in discussions, we hy-
pothesize that as the course’s concepts disambiguate,
the relationship between the two topics will likely de-
crease because fewer students will publish messages
mixing both topics in the same discussion.
As for the actor-actor dynamic, the topic-topic dy-
namic can be expressed as a temporal network (or
temporal graph), but where nodes are topics and links
between them represent relationships whose strength
depend on a topic, time and actor’ correlation. This
can be seen as a message based distance.
In Figure 1a), some relation between T and U
would occur for the same reason than that of A 99K B.
Incidentally, in the 2
nd
thread, we would have V 99K
T based on time proximity, but also U 99K T based
on the shared author A.
As we will explain in the literature review, the
topic-topic network may be best suited for student tar-
geted visualization than the actor-actor network.
Finally, let’s recall that for us collective dynamic
is the evolution of relationships between topics and
actors spurring from the messages’ co-occurrences in
a LMS’s forum without making any assumption about
the actors’ intentions.
3 RELATED WORKS
We review previous works pertaining to collective ac-
tions and those about supporting learning with visual-
izations.
3.1 Analyzing Collective Actions
Studies that consider collaboration usually try to iden-
tify the intentions by studying the student’s behavior
and message publications.
Detecting Collective Action. In a 250 strong Com-
munity of Learning (COL), Rehm et al. (2015) com-
pare on-task users, those showing engagement and
high performance, with off-task users. They use
questionnaires to relate the different behaviors to the
users’ hierarchical position in the COL. They com-
pared the actors’ social network position and their en-
gagements in learning discussions. They found a pos-
itive correlation between social position and engage-
ment, therefore the authors did not invalidate their hy-
pothesis that the social position influenced the learn-
ing behavior. Social Network Analysis (SNA) tech-
niques are also used to collect statistical measures
from the social network of messages’ exchange in or-
der to automatically operationalize collaborative in-
dicators. In (Lobo et al., 2016), for example, SNA
is used to compute initiative, activity, regularity of
activity, regularity of initiation, and reputation, that
permits identifying isolated learners and learners with
potentially assistant roles.
Figure 2: iForum’s Dashboard (Fu et al., 2017) showing (a)
overall changes of post in the forum, (b) a thread represen-
tation, (c) discussions in packed forms.
CSEDU 2019 - 11th International Conference on Computer Supported Education
70

Wang et al. (2016) are other researchers interested
in the learning differences between off-topic and on-
topic users. After a detailed analysis of forum mes-
sages, they demonstrate that on-topic users, that is
high-order thinking users displaying constructive and
interactive behaviors in the forums, have more learn-
ing gain than off-topic learners. In conclusion, the
authors advocate for an off-topic discussion detector
mechanism to guide users back on more constructive
grounds.
In (Chua et al., 2017), the authors’ approach is
to study the turn-taking in discussions. They iden-
tify different types of conversation and categorize the
users as: loner, replier, initiator without reply, initiator
who respond, active social learner, active social with-
out turn-taking, reluctant active social learners. Be-
side their valuable categorization, an important result
is that they observe more engagement from recurrent
posters, that is poster replying to comments made to
their initial posts.
If the importance of collective action for learning
is agreed upon, the difficulty is identifying it at scale.
It is a complex process needing content, temporal and
social network analysis. The previous studies justify
the importance of a detailed content analysis but they
relied on human intervention limiting their potential
to scale up.
Scaling Up. Dascalu et al. (2017); Boroujeni et al.
(2017) are the first big scale attempts that we found
taking into account time, message content, social and
dialogue structure. Each model the students’ dynam-
ics with a mixture of Natural Language Processing
(NLP) techniques such as LDA or Latent Semantic
indexing (LSI), and SNA (eg. block models) ap-
plied to big temporal datasets. Dascalu et al. (2017)’s
dataset contains 3,685 contributions from 179 partic-
ipants and spans 2 years. Boroujeni et al. (2017) use
2 datasets of respectively 7,699 and 12,283 messages
written by 1,175 and 1,902 participants.
Dascalu et al. (2017) operationalize collaboration
with a Cohesion Network Analysis score applied to
synchronous chat discussions. It correlates signifi-
cantly with human discussions’ analysis but it is not
tested to identify collective actions as the learners
were forced by pedagogical design in collaborative
groups.
Boroujeni et al. (2017) analyze the influence of
the course structure (timing and # of the staffs’ pub-
lications) on the forum structure, content and on the
social network of learners. They show that the course
structure correlates to the forum structure (timing and
# of students’ posts), but not to the forum content or
to the social network grown from the students’ in-
Figure 3: Convis Dashboard (Hoque and Carenini, 2016)
helps explore conversations. On the left, the topics found in
the forum using LDA and organized hierarchically. In the
middle, the colored rectangles show a sentiment analysis for
each message. Each message is linked to his author placed
on a semi-circle and thus creating a social network. Finally,
on the right, Convis display the detail of the conversation.
teractions in the forum. They report that although
some learners do not publish often, those still have
an important impact in forums because they some-
times trigger long discussions on course’s topics. Fi-
nally, the authors recommend combining forum activ-
ity prediction model with content analysis to support
instructors focusing on important discussions.
These two studies exemplify the possibility to get
collective actions indicators based on content, struc-
ture and time, and as in (Ezen-Can et al., 2015) they
push for better support tools for tutors.
3.2 Visualizations as Support Tools
Visualization as supporting tools have been used suc-
cessfully in teaching contexts. Heer and Shneider-
man (2012) classify the important visualization, while
Emmons et al. (2017) and citeLeeuwen2014 advocate
their generalization to support all LMS users.
Exploration and Awareness Tools. Medina et al.
(2016) use a LDB to provide quick and precise feed-
back with their Behavioral Awareness Mechanism.
They tackle the problem of portability and provide
dynamic feedback across several platforms to 24
students working on collaborative projects. They
use communication, coordination, motivation, perfor-
mance and satisfaction indicators to operationalized
collective actions. Other studies showed how group
awareness, i.e. rapid feedback about collective ac-
tion, and visual narratives (Yousuf and Conlan, 2015)
are beneficial to the students’ engagement, even if no
content analysis is done (May et al., 2011). Davis
Towards Visual Explorations of Forums’ Collective Dynamics in Learning Management Systems
71

et al. (2017) evaluated the impact of a radar type visu-
alization given to students in a two MOOCs providing
them with awareness on what previous sessions learn-
ers had done at the same time of the course. Their vi-
sualization had a positive impact on older students but
it did not improve significantly the younger students’
activity in the forums.
Generally, as Qu and Chen (2015) note, there is
a “need to develop both advanced data mining meth-
ods to reveal patterns from MOOC data and visual-
ization techniques to convey the analytical results to
end users and allow them to freely explore the data
by themselves”. VisForum Fu et al. (2017) answers
Qu and Chen (2015)’s call. This LDB (Figure 2) pro-
vide a visual analytic system to interactively explore
the forum of a LMS. The complex interface helps the
tutor group users and compare them to gain insights
on the general forum’s dynamic in terms of structure
but also in terms of sentiment analysis. In G
´
omez-
Aguilar et al. (2015), an original spiral visualization
of Moodle’s activities enabled the authors to spot that
students’ activities peaked on the same days for stu-
dents with similar grades. The visualization cleared
helped the author identify this interesting behavioral
trend. Convis, as an exploratory visualization, also
satisfies Bull and Kay (2016)’s recommendation for
negotiable user models (Figure 3). It is a forum explo-
ration tool designed around a topic model that evolves
with users’ feedback. It facilitates finding insight-
ful messages from discussions crammed within hun-
dreds. Finally, Guo et al. (2017) propose TieVis, an
original scalable visualization specifically tailored to
track explore and analyze dynamics in interpersonal
links, like those we could have between the actors
mentioned in the previous section.
The limit of these researches is their complex vi-
sualizations. iForum required an extensive explana-
tion from the designers to help the instructor grasp
what was shown. Similarly, in Convis some users re-
ported difficulties to use the visualization efficiently
and in TieVis the authors recognized that some of
their visualizations were not intuitive at all.
It is clear that visualizations can help creativity
and holistic thinking; improve the ability to make ef-
fective inferences; that translating or making visual
analogies reinforces conceptual development; im-
pacts cognition, helps sense-making and understand-
ing (Klerkx et al., 2014). Without contradicting the
later, Twissell (2014) clarify the visualizations lim-
its : a) different learning styles, natural differences
in learners have a significant impact on the way dia-
grams are perceived, visualized and understood b) vi-
sualizations do not equally affect all types of learning
activities.
Visualizations’ Effectiveness. The study from
Anaya et al. (2016) investigates how to reinforce stu-
dent collective actions in the LMS dotLRN. Notice-
ably they focus on directly helping the students, by
designing a comprehensible tree-based visualization
explaining to the student why they received a recom-
mendation to act more collectively and how having a
higher-order thinking behavior would be beneficial to
them. The engineer students working on a collabora-
tive project reported to understand the tool and gener-
ally found it useful.
Nevertheless, precaution has to be taken with vi-
sualizations for young learners because, for the least,
Lonn et al. (2015) found that a LDB could have unde-
sired side effects on teenagers. Analyzing students in
a summer camp remedial program, they reported that
extensive referral to a LDB downgraded some mas-
tery goal willing students to students only willing to
show proof of competence only. The opposite was not
witnessed. Therefore, some students abandoned their
initial motivation to understand and aimed to trick the
system so that the LDB showed that they understood.
This last experiment justifies that although we aim
to support tutors with explorable visualizations, we
will consider topic based visualizations rather than
user-based ones. Topic-based visualizations do not
emphases individual actions and, therefore, should
damper the motivations to trick the system by adopt-
ing a superficial behavior.
4 THE EXPLORABLE
COLLECTIVE DYNAMIC
MODEL
In this section, we detail our datasets and present the
model that we are going to use to analyze the collec-
tive dynamics from them.
4.1 Dataset Collection
Table 1 lists our seven datasets collected in 2017 and
2018. They are organized into four groups based
on the datasets’ origins. The datasets contain fo-
rum information from the following online courses:
1) Coursera (2018), a database extraction for a Hu-
man Right (HR) and Understanding Financial Mar-
kets (UFM) MOOCs. 2) Moodle (2009), a database
extraction without message content for a French as a
Foreign Language (FFL) course. 3) Hangouts (2018),
a JSON export from the VUCI’s G Suite for Educa-
tion with the data from 5 chats setup-up by the uni-
versity staff for the staffs or the students. 4) Coursera
CSEDU 2019 - 11th International Conference on Computer Supported Education
72
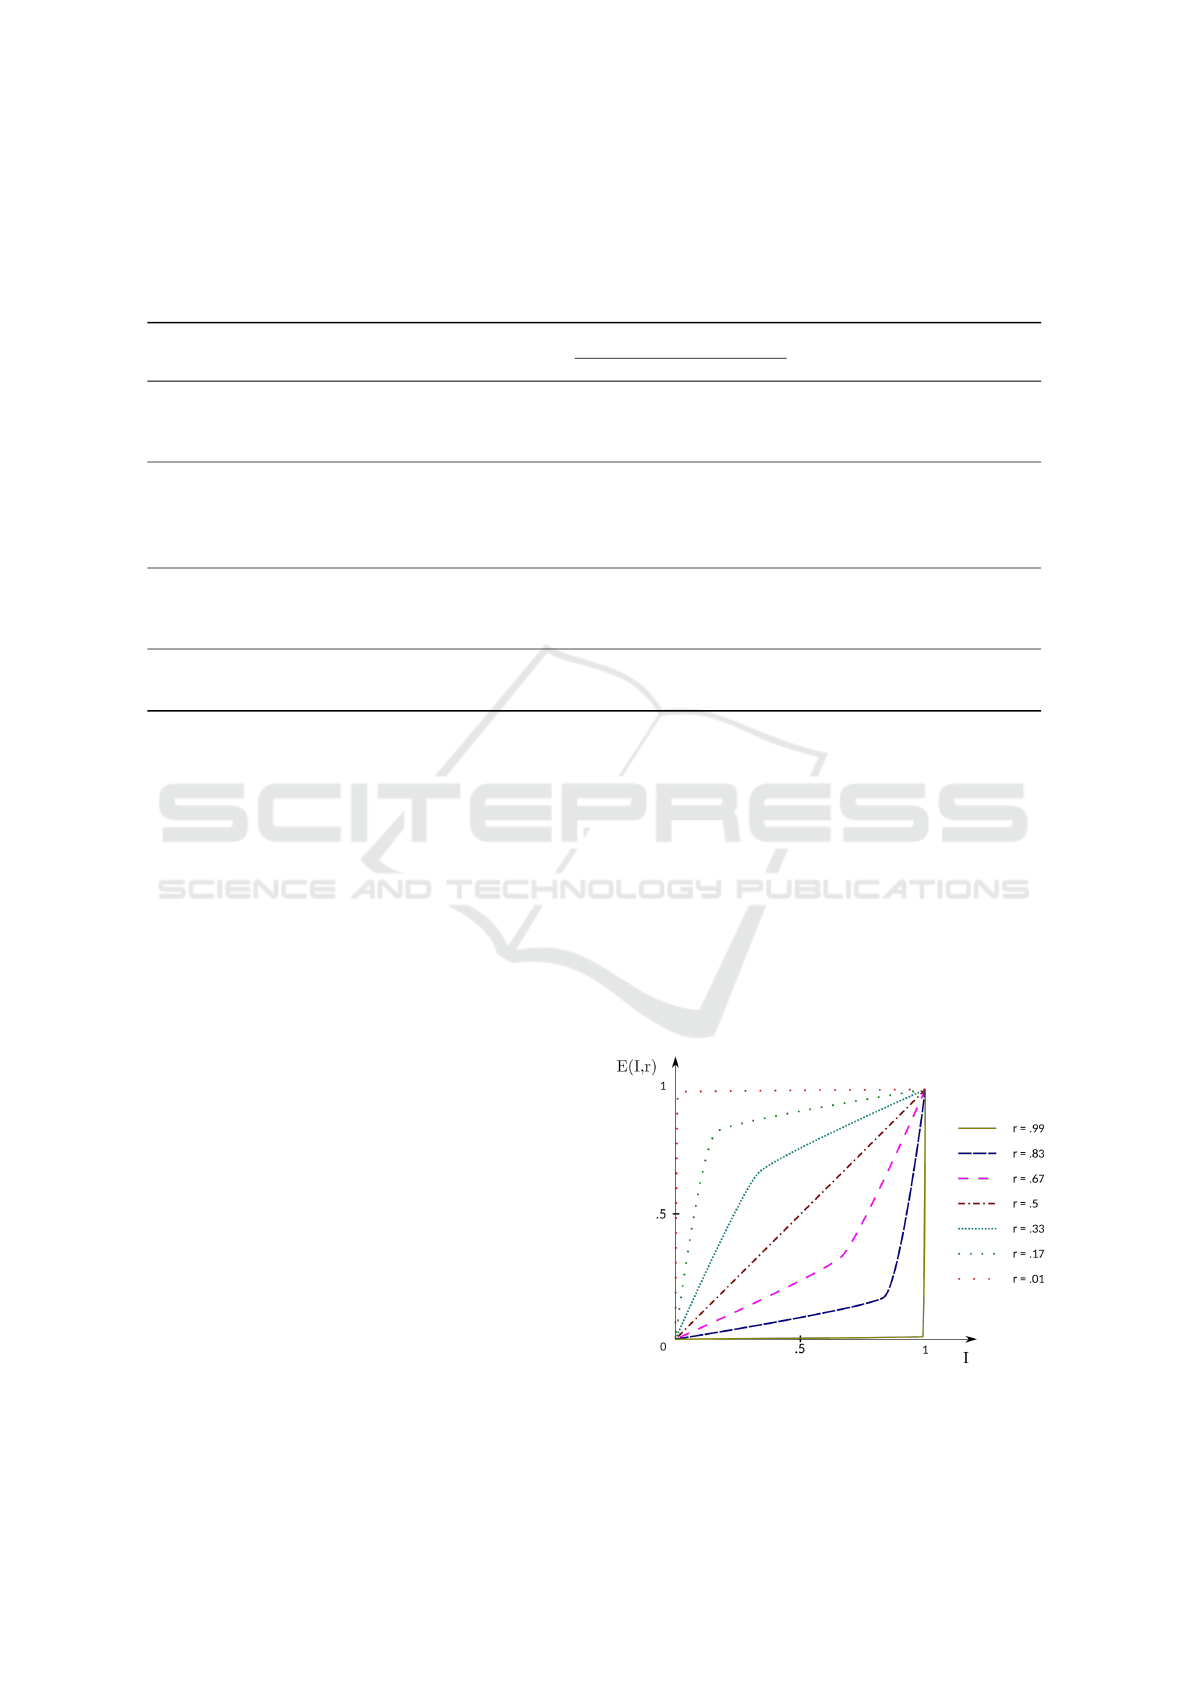
Table 1: List of datasets and courses that we use to experiment our LDB.
i
The forum structure is given by the existence of
different forum types: Weekly (W), General (G), Technical Support (S), Thematic (T) or Assignment (A) related.
ii
Extra
information is often available, such as messages up votes (V), comments (C), subscription (Sub.) or file attachment (Att.).
iii
When data was scrapped, the dates were in humanized format (e.g. 6 month ago, 23 minutes ago), therefore the precision
varies with the posts’ ages. Recent posts can be compared with greater precision than older ones. We give the intervals in
which the precision varies in hours (h), days(d), month (m) and year (y).
Dataset Discussion Message Author
Time
Structure
i
Extra
ii
source (#) (#) (#) Span (d) Precision
Moodle (2009)
FFL 348 1490 19 78 s T Active time,
Citations, Att.
Coursera (2017)
PP 868 2548 1112 365 [1 h; 2 m]
iii
W, G & A V & C
PML 1135 4157 982 240 [5 h; 1 m]
iii
W, G & A V & C
AT 248 549 311 728 [1 d; 1 y]
iii
W & A V & C
Coursera (2018)
HR 499 1004 638 989 ms W, G & S V, C & Sub.
UFM 1318 9460 4609 1022 ms W, G & S V, C & Sub.
Hangouts (2018)
VUCI 5 7297 96 327 s G & S -
(2017), a saving of online courses using selenium web
scraper. The dataset is then transformed and stored
as a CSV file to be processed by a Python engine.
It has messages’ content but approximates the times-
tamp. Three courses are available: Python Plotting
(PP), Python Machine Learning (PML) and African
Towns (AT) an urban planning course.
4.2 Collective Dynamic Model
Implicit Relationship’S Strength. Figure 1 gives
a first example of messages’ correlation, or close-
ness, translated as interaction’s strength between their
authors. There, the strength is either high, low or
null. In practice the strength I, that we will refer to
as implicit relationship’s strength, could be anything
in [0;1]. We propose to define the implicit relation-
ship strength between two messages as a function of
time, topics and actors. This translates the idea that
the messages relationship depends on :
Who: wrote them. Do the messages’ authors have
already interacted together before ? Is the author
a super poster, a lonely lurker ? One will probably
consider a message differently depending on his
relationship to the message’s author.
Time: Obviously, the delay (or time delta) between
two messages influence the strength of their rela-
tionship. The quicker the response, the stronger
the link.
Content: should also play an import role in the way
messages relate to one another. The difficulty is to
reliably automate content analysis, but NLP tech-
niques exist to advance in that direction.
Required Message Correlation. As we said ear-
lier, deducting the causal relationship between mes-
sages is difficult because one has to guess what is the
real intention of the message’s author. To avoid er-
rors, we do not directly deduce the messages real cor-
relation based uniquely on the implicit strength. In-
stead, we propose to make the relationship strength
Figure 4: Graphical proposition for the function E(I, r),
the explicit messages’ interaction strength. I is the “im-
plicit” strength based on content, time and social network
structure. r is “requirement” set by the observer.
Towards Visual Explorations of Forums’ Collective Dynamics in Learning Management Systems
73

Figure 5: Interactions cycles built from a bi-party actor-
topic graph Thread c and d are transformed to an actor-actor
graph. Dotted arrows denotes weaker links.
dependent on a parameter set interactively by the ob-
server. We call it the required message correlation r
(r ∈ [0; 1]). If the observer set r ≈ 0 then, for him, the
requirement for a message to be linked to other mes-
sages is weak and the interactions between messages,
actors and topics will be common. Although that
would probably lead to overly complex and unusable
dynamics metrics and visualizations. Conversely, if
r ≈ 1, the requirement is high, meaning that the ob-
server wants linked messages to be close in time, have
a lot of topic overlap and be written from closely con-
nected authors. In that case messages, actor and top-
ics will hardly have any relations with one another and
dynamic will probably be invisible.
Explicit Relationship’S Strength. The graph of
the function E could be like the one pictured in Fig-
ure 4. If the observer’s requirement is high, r ≈ 1,
then, for most Is, the interaction E should be low, and
conversely, if the observer’s requirement is low, r ≈ 0,
then the interaction E should be high, for most Is.
We care about this interaction because it’s based
on its value that we display the actor-actor or topic-
topic dynamics. To further illustrate our intent, we
complete our first example with longer threads (Fig-
ure 5). We set four strengths to I: high, medium, low
or ≈ 0. Each time or topic delta decreases the implicit
strength by one unit. Therefore, in our case, keeping
the topic unchanged, the maximum number of rela-
tions a message can have with “previous” messages is
3. We call this connection pattern previous-3. But, the
I function could have other forms. For example, the
star pattern, i.e., I been strong for the initial message
but null for the others; or the previous-∞ pattern, also
called “total co-presence” in Wise et al. (2017), de-
noting existing correlations with all the previous mes-
sages. In Figure 5c), not only does actor D connects
to actor C but he also connects to actor B. He po-
tentially could have been connected to actor A but in
addition to their time delta of 3, there a is topic delta
dropping the strength of I nearly to 0. Hence, only an
exceptionally low requirement r would explicit E the
interaction between the messages of actors A an D. In
our case, only if D had published on the same topic
as A would their implicit relationship be high enough
to gain visibility in our sociogram since this is not the
case, D is not directly connected to A in the associated
sociogram.
The results of these manipulations are a temporal
actor-actor network and a temporal topic-topic net-
work that can be represented by weighted oriented
graphs. Snapshots of an actor-actor network from the
PP dataset is presented in Figure 9.
Identifying Collective Actions. Once we built the
actor-actor and topic-topic networks, we want to iden-
tify potential collective actions. Those are derived
from the actor-actor network structure. We make the
hypothesis that collective actions need the presence of
a recurrent actor, that is an actor replying to one of his
replier (Chua et al., 2017). We take it as the evidence
that at least one of the actors has potentially assimi-
lated someone else’s message before acting, therefore
initiating a collective action. Structurally, recurrent
actors form cycles in the sociogram. For example,
in Figure 5c), actor A who posted twice the thread,
close the cycle A ← B ← C L99 D L99 E L99 A. Fur-
thermore, since actor E is in cycle with A and F, and
F with H, we will consider that actor A and all of
the above are engaged in a common collective action
with H. G on the other side is not part of any cycle
and, therefore, does not participate in collective ac-
tion. In fact, G published a message and disappeared.
We have no evidence that his message had an impact
on others or others on his. That is why we consider
necessary (but not sufficient) that the recurrent inter-
actions conditions collective action. In that sense, we
further Chua et al. (2017)’s findings that recurrent in-
teractions are important for discussions.
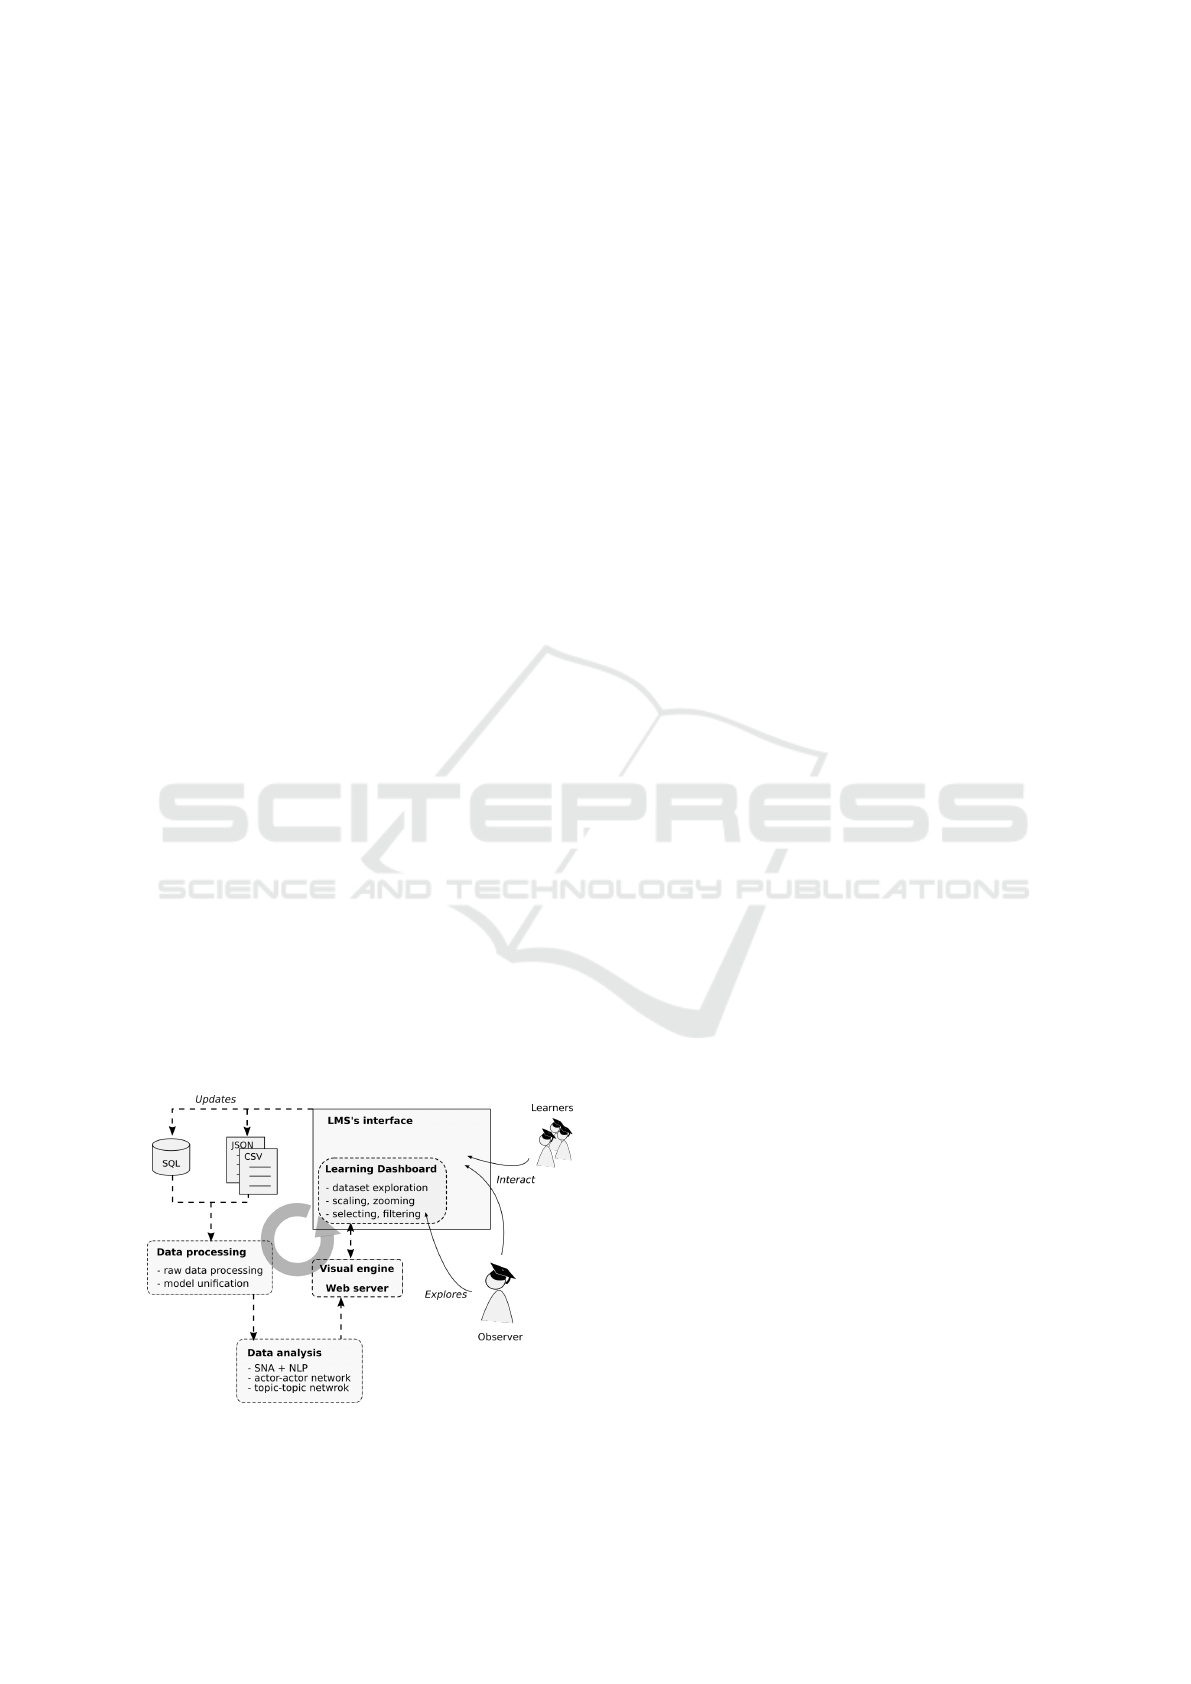
5 FIRSTS VISUALIZATIONS
We now introduce three visualizations from our work
in progress. They were made separately, each testing
some elements of the global conception model pre-
sented in Figure 8.
CSEDU 2019 - 11th International Conference on Computer Supported Education
74

Figure 6: Visualizations from the FFL dataset.
5.1 Moodle Dataset
We used the FFL dataset to sketch our first visual-
izations. Our Moodle dataset has the particularity to
contains detailed information about the actors’ activ-
ity type and duration. It enabled us to distinguish the
users’ active time from their idle times. With that
information, we came up with the visualizations of
Figure 6, built as part of a standalone web applica-
tion. Once we selected a user, we see the visualiza-
tions corresponding to his active time. The top chart
presents, in yellow, the total time spent in the forums
for a user, day per day and relates it with his active
time, shown in blue. To handle the scaling problem,
we implemented a monthly, weekly and daily based
grouping criteria. On the lower chart, we compared
the activity time of two users. We see that, although
they display similar activity patterns over time, one is
generally more active than the other.
This was a successful test to sketch our firsts vi-
sualizations, but the FFL dataset lacked content and
its size did not create a huge monitoring problem for
the tutors. Albeit, this dataset is interesting because it
emphasizes the importance of the activity type. The
following step is to scale up with a bigger dataset that
includes content.
5.2 Hangouts Dataset
The hangouts dataset is slightly different from the
other datasets. It is less structured because it comes
from chats and not forums. Figure 7 displays 6 274
messages from one chat, gathering several threads
of exchanges between the VUCI’s administration and
their tutors, from March 2018 to December 2018.
We started from a manual, but automatable, export
of Google’s hangouts services. It gave us a JSON file
that we preprocessed in python and fed to d3, a visu-
alization JavaScript library, via a standalone Django
Figure 7: Detail of VUCI conversation taking place in 2
hours. Each circle is a message, and hovering over them
brings up its content. The circle’s size is proportional to
their content’s length. Message are layered vertically by ac-
tors. On the left is an indication of the actors total messages
count.
web application. We built a LDB, testing on that
larger dataset, interactive features such as zooming,
panning, data point selection. The figure’s pane (a)
contains a bird’s eye view of all messages. Users
are represented vertically, in the middle, with their
names. On the left is a histogram of message count for
each user. On the right, along with the time axis, we
plotted the messages as discs whose areas are propor-
tional to the messages’ length. Activating the mouse
wheel while on the time axis zoom in and out. Bel-
low, is the 3 hours period framed in red, zoomed. It
shows a message pop-up, with full detail, activated by
the mouse hovering a data point.
In this investigation, we did not include the SNA
and NLP analysis because our objective was the vi-
sualization of a large dataset with content and the
handling of the scaling problem. It proved that our
technology choices were sound. We transformed the
dataset of several thousand messages, from the JSON
file to the HTML rendering, in a few seconds. But
it also pinpointed the importance to implement many
interactive exploration functions to alleviate the scal-
ing problem. For examples, ways to quickly zoom on
a few data points without losing the overall picture, as
well as ways to filter and order data point or axis la-
bels, and also enabling more intricate communication
between the different LDB’s charts. In addition to all
Towards Visual Explorations of Forums’ Collective Dynamics in Learning Management Systems
75
this, a major drawback to our visualization is that it
did not take into account, yet, the final users. Finally,
besides defining visual modalities, we still need to test
the algorithm to compute the collective activity indi-
cator.
5.3 Coursera’s Dataset
We used the PP dataset from Coursera 2017 to in-
vestigate the construction of a collective activity in-
dicator with SNA techniques. We came up with the
sociogram (Figure 9) illustrating an actor-actor dy-
namics. Nodes are all learners. We removed the
tutors and the course’s mentors to approach Dillen-
bourg’s collaboration definition that we gave in Sec-
tion 2. The users are linked based on their proximity
to the previous-3 actors who published in the same
discussion. The arrows’ width depends on the mes-
sages’ timestamp closeness, # of co-occurrences of
the authors and # of votes that the message collected.
We colored them by discussion, and order them by
age, the oldest being the lightest. This is an interme-
diate visualization that is used for analysis purposes
and will not be presented to the end users for two
reasons: a) it gives abstruse information for some-
one that does not have access to the raw data, b) it
represents the actors as nodes and as we noted in sec-
tion 3, we would rather have visualizations showing
topics than persons. We present it to illustrate what
a social network from our dataset looks like, and be-
cause, zoomed and reduced to the three snapshots (b),
(c), (d), representing three successive yearly quarters,
we distinguish an evolving pattern. In particular a de-
tailed analysis of actor 642, circled in red, show that
he started to designate two other messages probably
because they were meaningful to him (a), then he en-
gaged in several message exchanges designating oth-
ers’ message meaningful as his where also bringing
Figure 8: Data Analysis cycle.
attention (c), and in the most recent quarter someone
commented one of his earlier message (d). It is not
clear from Figure 9 if actor 642 was part of cycles.
Testing our hypothesis that actors in cycles share a
collective dynamic is in our perspectives.
6 PERSPECTIVES AND
CONCLUSION
6.1 Perspectives
The three test and visualizations presented are prepar-
ing further work to build: a collective activity indica-
tor taking in account the social network structure, the
content of messages and their evolution in time, and
visualizations for that indicator.
To further our effort to find visual modalities for
the indicator, we conducted a small survey in July
2018 with 48 tutors from the VUCI to introduce our
project and start engaging them in a co-construction
process. 27 were not satisfied or unsure about their
current tools’ effectiveness to monitor their students’
work. 39 agreed or strongly agreed that ICTs could
help their students better collaborate and 40 that col-
laboration was, indeed important for learning. In a
second survey, we plan to ask the tutors the kind of
visual representation they would find useful to moni-
tor the collective activities of their students, but also
what dimensions of the relationships between mes-
sages they would like to leverage to explicit visually
those relationships. This is part of a co-construction
approach that should engage the tutors, facilitating the
adoption of our visualization while increasing its us-
ability and impact.
Concerning the portability and validation of our
pipeline stages (Figure 8), we will need to continue
working with several datasets, extending our unified
model to incorporate SNA and NLP statistics for all
datasets. The portability assumption rests on our
capacity to extract periodically, every few minutes,
hours or days, data from the main LMS. This we will
necessitate proper APIs authorizations to make our
LDB communicate effectively with the LMS.
6.2 Conclusion
In this paper, we presented a model to detect collec-
tive activities from the forums’ discussions. We based
our model on an implicit message relationship and an
external parameter set by an observer to explicit that
relationship. Doing so, we hope to facilitate the porta-
bility of our indicator to courses covering different
CSEDU 2019 - 11th International Conference on Computer Supported Education
76
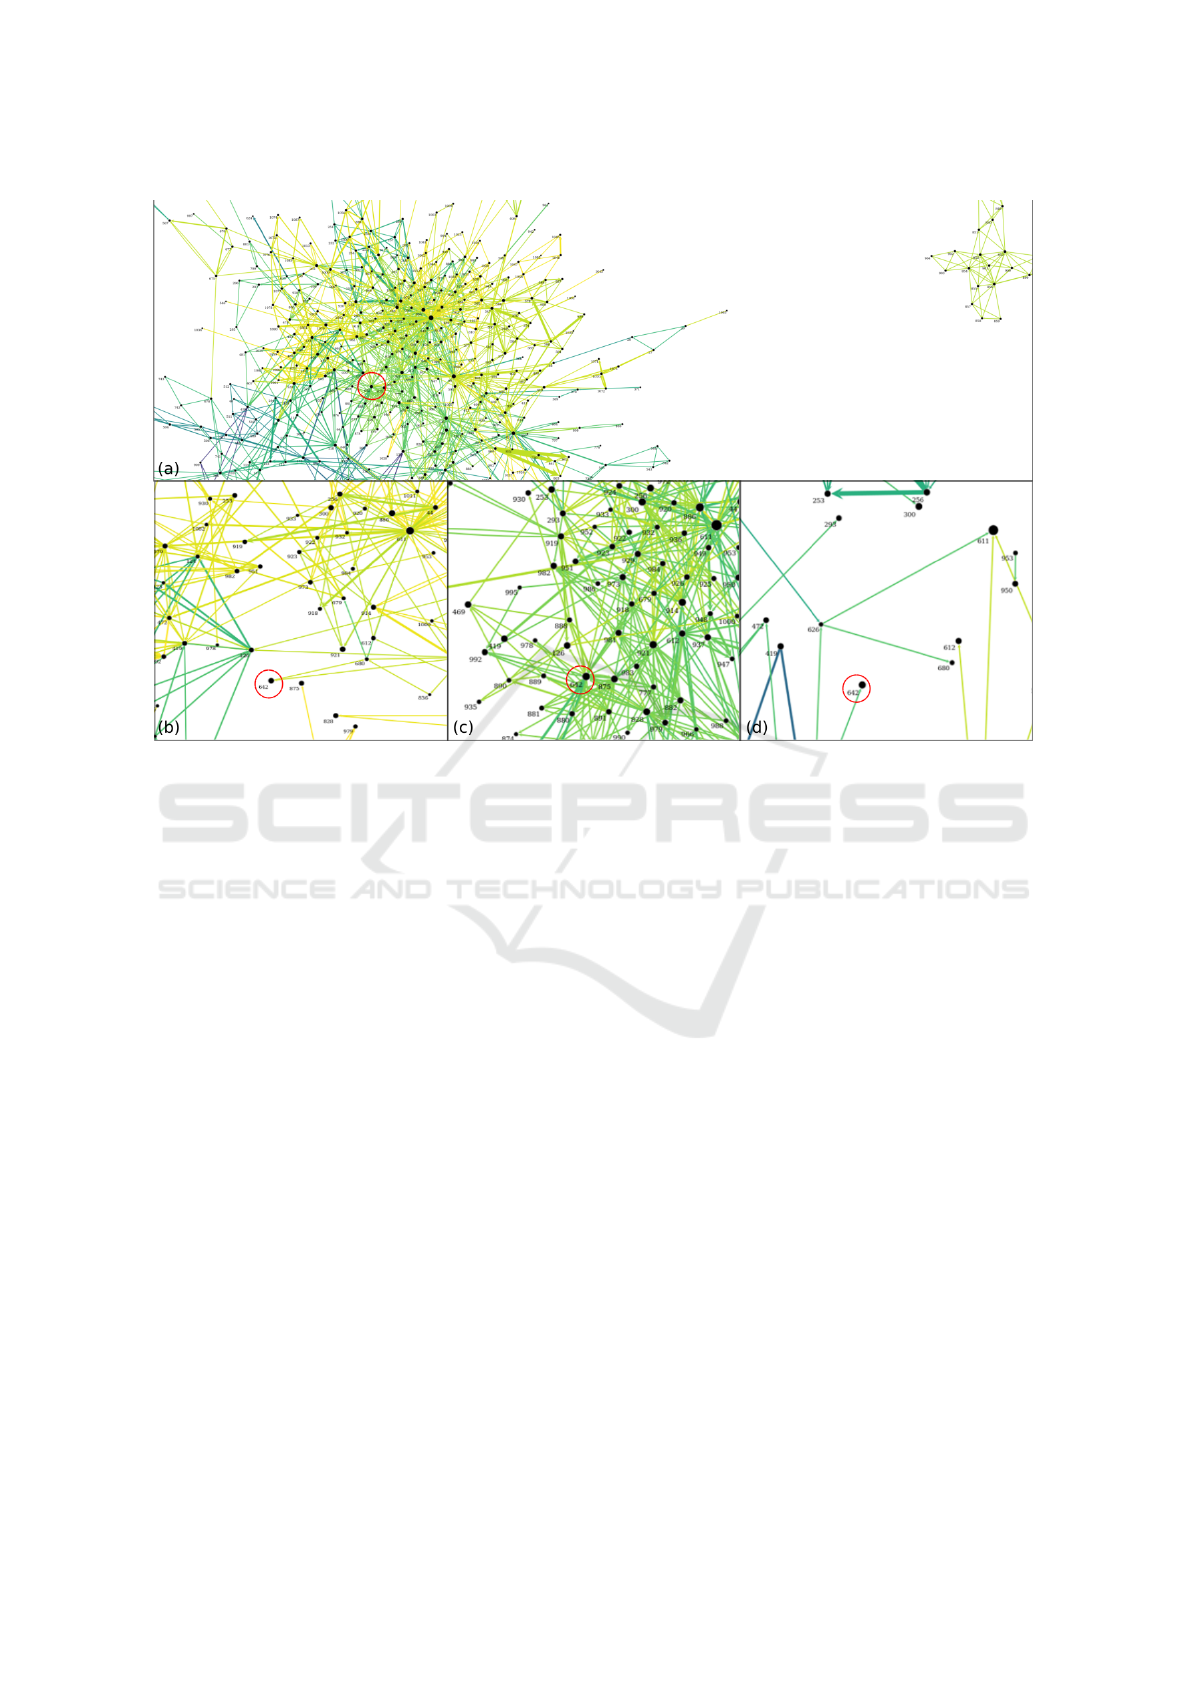
Figure 9: At the top (a) is half of compound yearly actor-actor network. The three bottom images (b), (c) and (d) are
closeup around actor 642 during the quarters of the year. Higher resolution images for all figures are available at https:
//git-lium.univ-lemans.fr/mkone/csedu-2019
domains, spanning various time periods and having
different populations. Learning Analytics (LA) is at
a turning point where lots of attention is moving to
support tools rather than fully automated learning so-
lutions (Kon
´
e et al., 2018; Baker, 2016). Therefore,
we started investigating ways to give a visual feed of
the collective dynamics spurring from the LMSs fo-
rums, back to the tutors. We illustrated our work in
progress with three visualizations pushing for more
data analysis and data visualization for learning. We
further hope that this work will help tutors and, even-
tually, students discover the topic-topic dynamics in
their MOOCs and support collectives activities, so
beneficial to learning.
REFERENCES
Anaya, A. R., Luque, M., and Peinado, M. (2016). A visual
recommender tool in a collaborative learning experi-
ence. Expert Systems with Applications, 45:248–259.
Baker, R. S. (2016). Stupid Tutoring Systems, Intelligent
Humans. International Journal of Artificial Intelli-
gence in Education, 26(2):600–614.
Boroujeni, M. S., Hecking, T., Hoppe, H. U., and Dillen-
bourg, P. (2017). Dynamics of MOOC discussion fo-
rums. In LAK, pages 128–137.
Bull, S. and Kay, J. (2016). SMILI: a framework for inter-
faces to learning data in open learner models, learning
analytics and related fields. International Journal of
Artificial Intelligence in Education, 26(1):293–331.
Chua, S. M., Tagg, C., Sharples, M., and Rienties, B.
(2017). Discussion Analytics: Identifying Conversa-
tions and Social Learners in FutureLearn MOOCs.
Dascalu, M., McNamara, D. S., Trausan-Matu, S., and
Allen, L. K. (2017). Cohesion network analysis of
CSCL participation. Behavior Research Methods,
pages 1–16.
Davis, D., Jivet, I., Kizilcec, R. F., Chen, G., Hauff, C., and
Houben, G.-J. (2017). Follow the successful crowd:
raising MOOC completion rates through social com-
parison at scale. In LAK, pages 454–463.
Dillenbourg, P. (1999). What do you mean by collabora-
tive learning. Collaborative-learning: Cognitive and
computational approaches, 1:1–15.
Emmons, S. R., Light, R. P., and B
¨
orner, K. (2017). MOOC
visual analytics: Empowering students, teachers, re-
searchers, and platform developers of massively open
online courses. Journal of the Association for Infor-
mation Science and Technology, 68(10):2350–2363.
Ezen-Can, A., Boyer, K. E., Kellogg, S., and Booth, S.
(2015). Unsupervised modeling for understanding
MOOC discussion forums: a learning analytics ap-
proach. In Proceedings of the fifth international con-
ference on learning analytics and knowledge, pages
146–150. ACM.
Towards Visual Explorations of Forums’ Collective Dynamics in Learning Management Systems
77

Fu, S., Zhao, J., Cui, W., and Qu, H. (2017). Visual Analysis
of MOOC Forums with iForum. IEEE Transactions
on Visualization and Computer Graphics, 23(1):201–
210.
Gerlach, M., Peixoto, T. P., and Altmann, E. G. (2018). A
network approach to topic models. Science Advances,
4(7).
Gerstenberg, T. and Tenenbaum, J. B. (2017). Intuitive the-
ories. In The Oxford Handbook of Causal Reasoning.
G
´
omez-Aguilar, D. A., Hern
´
andez-Garc
´
ıa, A., Garc
´
ıa-
Pe
˜
nalvo, F. J., and Ther
´
on, R. (2015). Tap into visual
analysis of customization of grouping of activities in
eLearning. Computers in Human Behavior, 47:60–67.
Guo, F., Chen, W., Lin, T., Zhu, B., Zhang, F., Wu, Y.,
and Qu, H. (2017). TieVis: visual analytics of evo-
lution of interpersonal ties. Journal of Visualization,
20(4):905–918.
Heer, J. and Shneiderman, B. (2012). Interactive dynamics
for visual analysis. Queue, 10(2):30.
Hoque, E. and Carenini, G. (2016). Multiconvis: A vi-
sual text analytics system for exploring a collection
of online conversations. In Proceedings of the 21st In-
ternational Conference on Intelligent User Interfaces,
pages 96–107. ACM.
Jelodar, H., Wang, Y., Yuan, C., Feng, X., Jiang, X., Li,
Y., and Zhao, L. (2017). Latent Dirichlet Allocation
(LDA) and Topic modeling: models, applications, a
survey. arXiv:1711.04305 [cs].
Khalil, H. and Ebner, M. (2014). MOOCs completion rates
and possible methods to improve retention-A litera-
ture review. In World Conference on Educational Mul-
timedia, Hypermedia and Telecommunications, vol-
ume 1, pages 1305–1313.
Klerkx, J., Verbert, K., and Duval, E. (2014). Enhancing
Learning with Visualization Techniques. In Spector,
J. M., Merrill, M. D., Elen, J., and Bishop, M. J., ed-
itors, Handbook of Research on Educational Commu-
nications and Technology, pages 791–807. Springer
New York.
Kon
´
e, M., May, M., and Iksal, S. (2018). Towards a Dy-
namic Visualization of Online Collaborative Learning.
In CSEDU (1), pages 205–212.
Lobo, J. L., Santos, O. C., Boticario, J. G., and Del Ser, J.
(2016). Identifying recommendation opportunities for
computer-supported collaborative environments. Ex-
pert Systems, 33(5):463–479.
Lonn, S., Aguilar, S. J., and Teasley, S. D. (2015). Inves-
tigating student motivation in the context of a learn-
ing analytics intervention during a summer bridge pro-
gram. Computers in Human Behavior, 47:90–97.
May, M., George, S., and Pr
´
ev
ˆ
ot, P. (2011). TrAVis to
enhance online tutoring and learning activities: Real-
time visualization of students tracking data. Interac-
tive Technology and Smart Education, 8(1):52–69.
Medina, E., Meseguer, R., Ochoa, S. F., and Medina, H.
(2016). Providing Behaviour Awareness in Collabora-
tive Project Courses. Journal of Universal Computer
Science, 22(10):1319–1338.
Qu, H. and Chen, Q. (2015). Visual analytics for MOOC
data. IEEE computer graphics and applications,
35(6):69–75.
Rehm, M., Gijselaers, W., and Segers, M. (2015). The
impact of hierarchical positions on communities
of learning. International Journal of Computer-
Supported Collaborative Learning, 10(2):117–138.
Schwendimann, B. A., Rodriguez-Triana, M. J., Vozniuk,
A., Prieto, L. P., Boroujeni, M. S., Holzer, A., Gillet,
D., and Dillenbourg, P. (2017). Perceiving learning
at a glance: A systematic literature review of learning
dashboard research. IEEE Transactions on Learning
Technologies, 10(1):30–41.
Twissell, A. (2014). Visualisation in applied learning con-
texts: a review. Journal of Educational Technology &
Society, 17(3).
Wang, X., Wen, M., and Ros
´
e, C. P. (2016). Towards trig-
gering higher-order thinking behaviors in MOOCs.
In Proceedings of the Sixth International Conference
on Learning Analytics & Knowledge, pages 398–407.
ACM.
Wise, A. F., Cui, Y., and Jin, W. Q. (2017). Honing in on
social learning networks in MOOC forums: examin-
ing critical network definition decisions. In Proceed-
ings of the Seventh International Learning Analytics
& Knowledge Conference, pages 383–392. ACM.
Yousuf, B. and Conlan, O. (2015). VisEN: Motivating
Learner Engagement Through Explorable Visual Nar-
ratives. In Design for Teaching and Learning in a Net-
worked World, pages 367–380. Springer.
Zheng, S., Rosson, M. B., Shih, P. C., and Carroll, J. M.
(2015). Designing MOOCs as interactive places for
collaborative learning. In Proceedings of the Second
(2015) ACM Conference on Learning@ Scale, pages
343–346. ACM.
CSEDU 2019 - 11th International Conference on Computer Supported Education
78
