
Communicating Learning Analytics: Stakeholder Participation and
Early Stage Requirement Analysis
Filothei Chalvatza
1
, Sokratis Karkalas
1
and Manolis Mavrikis
2
1
Technology, Research and Experimentation Ltd, Hertfordshire, U.K.
2
UCL Knowledge Lab, London, U.K.
Keywords:
Learning Analytics Dashboard Design, Educational Stakeholders, Requirements Elicitation.
Abstract:
This paper reflects on a user-centered design methodology for requirements elicitation at early stages of a
design process for Learning Analytics tools. This methodology may be used as a domain specific instrument
to elicit user perspectives about the communicational aspects of learning analytics dashboards. The focus of
this work is identifying ways to communicate the data analysis findings in a way that is easily perceptible
and facilitates actionable decision making. We present the structure as well as the logic behind the design of
this instrument. As a case study, the paper describes an implementation of this methodology in the context of
school-wide analytics communicating to stakeholders quality indicators through summarising and visualising
data collected through student and parent surveys. We provide high-level and transferable recommendations
derived from the analysis of the workshop with key stakeholders and identify future improvements in our
methodology.
1 INTRODUCTION
Learning dashboards have grown in popularity over
the past few years and are becoming a mainstream
tool for monitoring and decision making. While peo-
ple are using them to address real world problems,
there is little evidence that these dashboards convey
the right information to stakeholders and reflect those
burning issues in a way that facilitates actionable de-
cision making. According to (Schwendimann et al.,
2017), the question of how to present relevant infor-
mation effectively remains largely unresolved.
The core concern of this paper is not ‘what’ to
present but ‘how’ to present it. In our view, this as-
pect is relatively neglected as there is a lot of work
on how to analyse and enhance the data but very lit-
tle work on how to make this data easily understand-
able by end users and usable with very little cogni-
tive load for decision making. While the same view is
being supported by (Davenport and Kim, 2013) and
by others looking at the design of learning analytics
mostly in higher education (Avella et al., 2016; Fer-
guson, 2012; Dawson et al., 2014), this issue is even
more pronounced at K-12 where additional data liter-
acy training needs have been identified (Mandinach
and Gummer, 2016). Research in the field has, with
a few isolated exceptions that we review below, so far
focused on the analytical methods themselves and not
enough on how to communicate the analysis results
effectively. This is predicated on the false assump-
tion that it is enough for the end users to be exposed
to data to be able to make sense and take appropriate
decisions.
A sign of this fallacy can be seen in the Refer-
ence Model for Analytics (Chatti et al., 2012), that
defines the four benchmarks: what, who, why and
how. The latter refers to methods and techniques
about analysing data but fails to address the specific
need for techniques on how to present data and con-
vey the appropriate information to end users. Shifting
from matrixes to dashboards is not enough. We opine
that challenging the way a visualisation is designed
in order to express interesting aspects in a meaningful
way should be in line with the ‘how’ benchmark. An-
other example is the Framework of Characteristics of
Analytics (Cooper et al., 2012). This is an attempt to
describe the ontology behind analytics at a very high
level. One aspect of it is referring to data presentation
and the only level of detail it prescribes is limited to
visual and numerical. There is no reference to forms
of expression that should be used to answer user ques-
tions. In that respect, we are following this work and
we are extending this particular aspect of it to make
it more relevant to what is actually needed in real im-
Chalvatza, F., Karkalas, S. and Mavrikis, M.
Communicating Learning Analytics: Stakeholder Participation and Early Stage Requirement Analysis.
DOI: 10.5220/0007716503390346
In Proceedings of the 11th International Conference on Computer Supported Education (CSEDU 2019), pages 339-346
ISBN: 978-989-758-367-4
Copyright
c
2019 by SCITEPRESS – Science and Technology Publications, Lda. All rights reserved
339

plementations.
A methodology that is specifically developed to
provide a framework for the design of learning ana-
lytics tools is LATUX (Martinez-Maldonado et al.,
2015). This is presented as a systematic workflow
for producing learning analytics tools that are both
technologically feasible and truly underpin the learn-
ing experience. Although this methodology is mostly
intended for learning analytics tools for classroom
awareness, orchestration and for informing pedagog-
ical decisions, rather than institutional-wide analytics
for decision-making at a school level, we consider it a
very useful framework that offers a transferable so-
lution to design such analytics. In that respect we
are inspired by LATUX as we have a common ob-
jective. The part that relates to what we do is the first
two steps of stage 1: “what are the requirements?”
and “what are the unexplored possibilities?”. LATUX
simply mentions requirements elicitation without giv-
ing a workflow for it. This particular step is the con-
tribution of our work. We are focusing on the require-
ments step of LATUX to provide a systematic work-
flow that helps elicit stakeholder requirements and in-
volve them in early stages of the design process in a
meaningful way.
Consequently, the focus of this work is on how to
involve stakeholders at early stages of the design pro-
cess. Our premise is that learning analytics is a com-
municational process whose primary purpose is to
enable and facilitate timely and actionable decision-
making. Therefore, we are focused on stakehold-
ers and are concerned with their preferences, needs,
and requirements with regard to data communica-
tion in terms of meaningful visualisations and action-
able feedback. Our research instrument materialises
through a case study in the form of a requirements
elicitation workshop that investigates ways to com-
municate analysis findings in a simple, easily under-
standable and actionable manner.
2 RELATED WORK
Learning analytics is aimed at a wide range of stake-
holders on both individual and organisational level
(Chatti et al., 2012). Learning analytics stakeholders
can be learners, instructors, teachers, trainers, admin-
istrators, developers, researchers, parents, and gov-
ernment bodies or other policy makers (Khalil and
Ebner, 2015). In the context of this project, poten-
tial stakeholders are people who work in the educa-
tional sector holding a managerial or teaching po-
sition, come into contact with students and can use
the outcome of this project to the benefit of one
or more schools. The fact that learning analytics
has a wide variety of stakeholders leads to chal-
lenges due to individual differences. Focusing par-
ticularly on dashboards as a display that ”aggregates
multiple visualizations of different indicators about
learner(s), learning process(es) and/or learning con-
text(s)” (Schwendimann et al., 2017), the challenge
is that they are created for various audiences and this
affects both their appearance and functionality. The
key advantage of visual displays is the fact that they
present complex concepts in an accessible format and
allow stakeholders to capture vital information easily
and quickly. A learning analytics dashboard is a pow-
erful communication medium that increases aware-
ness, supports reflection, and facilitates decision-
making and intervention (c.f. (Karkalas et al., 2016;
Schwendimann et al., 2017)). (Chatti et al., 2012)
also admit that text, tables of data and other tra-
ditional report methods lag behind dashboards that
utilise user-friendly graphical representations. More-
over, they declare the advantages are not in the dash-
board per se. The key is to use proper visual indica-
tors to effectively go through the objectives of each
project. Similarly, (Davenport and Kim, 2013) over-
stress the importance of the effective findings presen-
tation explaining that problem solving is not the core
of analytical thinking. Problems must be framed cor-
rectly to reflect a relevant context. Then the results
need to be communicated in a manner which facili-
tates correct interpretation and sense-making (Dav-
enport and Kim, 2013; Zowghi and Coulin, 2005).
(Baker and Inventado, 2014) specify that learning an-
alytics is a methodology that extracts actionable infor-
mation. Reporting and theoretical description is not
the end of the learning analytics process as it does not
fulfil its ultimate purpose.
Learning analytics is a scientific field that seeks
and provides answers that lead to practical actions
(Cooper et al., 2012). As such, in our view, action-
able is a word that should be at the core of the na-
ture of learning analytics. Educational stakeholders
leverage learning analytics in order to make rational
decisions and follow a reasonable course of action to
achieve their purpose (Dietz-Uhler and Hurn, 2013).
2.1 Early Stakeholder Design
Involvement
Involving the stakeholders early enough minimises
the risk of failure, improves the usability, and
draws greater understanding from LA interventions
(Dollinger and Lodge, 2018). In the literature there
are several cases where stakeholders are asked to con-
tribute to the improvement of aspects of learning an-
CSEDU 2019 - 11th International Conference on Computer Supported Education
340

alytics. There is also a lot educational projects that
follow this approach. The project in (Drachsler and
Greller, 2012) makes use of a survey in order to col-
lect information on stakeholders understandings, ex-
pectations and confidence on learning analytics. An-
other project that captures stakeholders perceptions is
described by (Van Harmelen and Workman, 2012).
Stakeholders completed a survey giving their opinion
about benefits and challenges of applying learning an-
alytics on institutional level. The project presented
in (Ali et al., 2012) involved stakeholders of online
learning as evaluators of a system designed to inform
teachers about students activities and performance.
The project shown in (Mavrikis et al., 2016) de-
scribes the stakeholders contribution in the evaluation
of an assisting tool for teachers. The tool provides
the teachers with visualisations to help them monitor
students activity when they work on an exploratory
learning environment. (Holstein et al., 2017) adopted
a participatory design approach with the aim to design
a dashboard that answers real-time teachers’ needs in
the context of an intelligent-tutoring system. Finally,
the project presented in (Govaerts et al., 2012) in-
volved teachers and students in designed based re-
search iterations to evaluate the effectiveness of vi-
sualisations used to increase awareness and support
self-reflection.
3 METHODOLOGY
To elicit stakeholders’ requirements means to
learn, uncover, extract, surface, or discover their
needs (Hickey and Davis, 2004). The activities
that are involved in this process must allow com-
munication, prioritisation, negotiation, and collabora-
tion (Zowghi and Coulin, 2005). Requirements elic-
itation is a very crucial process that defines the suc-
cess or the failure of the final product (Gottesdiener,
2003). There is a significant number of techniques
that can be used in order to facilitate requirements
elicitation (see examples in (Fernandes et al., 2012;
Nistala et al., 2013; Millard et al., 1998; Hofmann and
Lehner, 2001)).
In this project, the primary technique employed
is a requirements workshop. Complementary tech-
niques are scenario, hybrid personas, and focus
groups. The purpose of the workshop is to present
to the stakeholders alternative ways of presenting and
communicating surveys findings, gather their feed-
back on these and elicit further requirements. The
process to gather the desired information is to elabo-
rate on existing data communication models, propose
alternative models, and give the ability to stakehold-
ers to express their preferences, thoughts, and sug-
gestions on them. The following section provides a
detailed step-by-step presentation of this process.
3.1 The Instrument
The instrument is structured as follows:
Scenario: The first step utilises the requirements elic-
itation technique of scenario or use case. In this part
the participants are given the following scenario: You
work for a secondary school in London. For the past
four years the Ofsted rating for your school is Good.
Last year the new school governors launched a se-
ries of actions for school improvement. One of these
actions is to use a survey to take students feedback on
certain aspects of the school life. The survey was com-
pleted by the students at the end of the school year. A
commercial partner has undertaken the survey data
processing and the findings presentation through vi-
sualisation dashboards. Now, it is your turn to see the
dashboards and take the information you need. The
aim of the scenario is to stimulate the participants in-
terest, to help them situate themselves in a real con-
text, and to put the early prototypes in a context of
use.
Hybrid Personas: For the second step the partici-
pants are asked to complete a fill-the-gaps card (figure
1). They have to consider their real-life roles, to ex-
press the main need they would have had if they were
part of the school presented in the scenario, and to
explain the way they would expect this to help them.
This could be seen as an alternative way to create per-
sonas (Caddick and Cable, 2011) with the partici-
pants emerge themselves in the context of the given
scenario. The card is designed to have a very simple
layout and help the participants to articulate the ele-
ments needed for the exercise. After they complete
the cards, the participants have to present themselves
through the cards to the group.
Figure 1: Fill the gaps card.
Communicating Learning Analytics: Stakeholder Participation and Early Stage Requirement Analysis
341
The aim of this is twofold. Firstly, to implicitly
force the participants to think about and articulate
their primary needs. Secondly, to make all the par-
ticipants aware of the others viewpoints in order to
be able to participate and contribute to the subsequent
discussions.
Current Model: For this part we present a dashboard
that is fairly representative of the current model used
for learning analytics. In our case we used a com-
mercial platform provided by a company the name of
which will not be revealed for confidentiality reasons.
The goal of this process is to provide stakeholders
with easily perceptible information allowing them to
focus on specific areas that need improvement.
The participants are asked to explore the com-
pany platform and answer four questions regarding
the effectiveness of the platform. The aim of this is
the participants to see the platform not as a presen-
tation but with an exploratory eye, to think about ad-
vantages and disadvantages, to discuss about the pro-
vided services, and to start thinking about alternative
approaches.
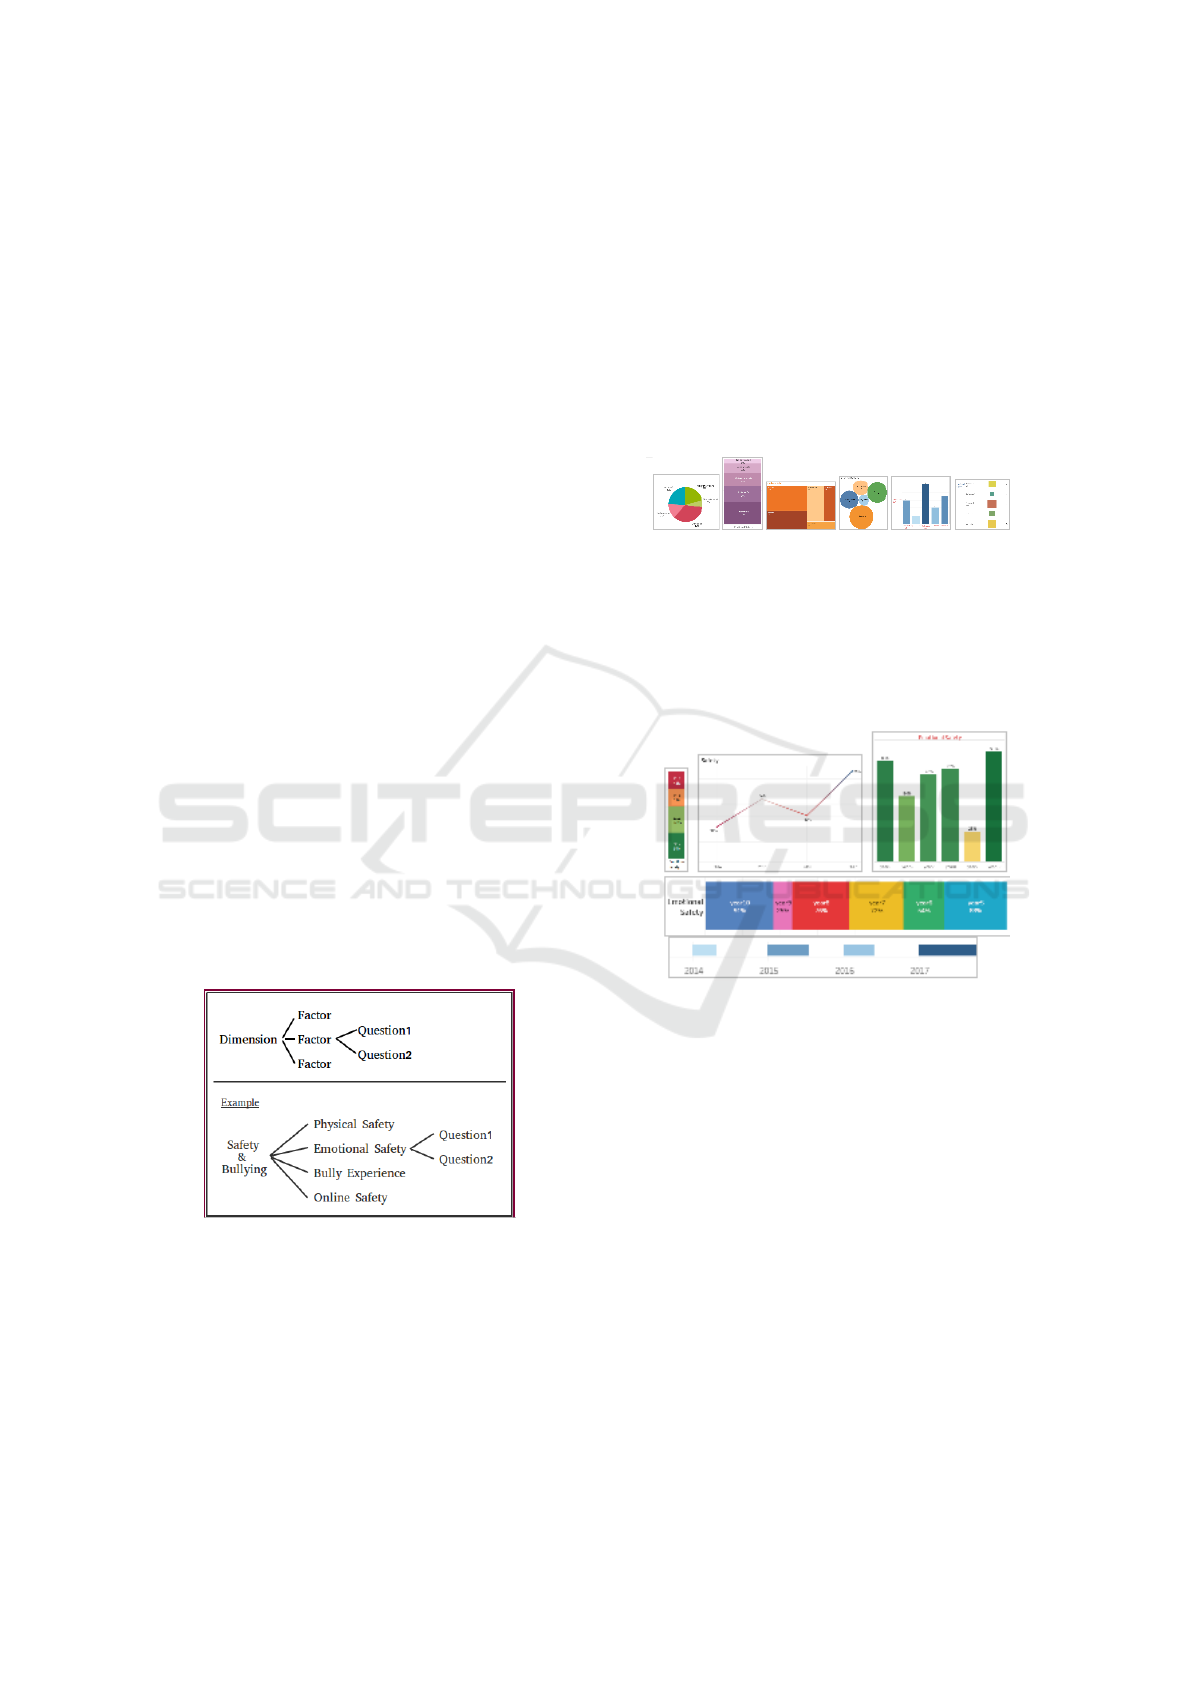
Dimension-factor-Question Scheme: This is in-
tended to discuss alternatives in terms of level of
specificity. This feature is inspired by the Shneider-
man’s Mantra principle “overview first, zoom and fil-
ter, then details-on demand” (Shneiderman, 1996).
As mentioned above, the company’s current data
communication model displays information in two
levels: question and group of questions. Once it is
clear that the stakeholders establish an understand-
ing of this, they are presented the rationale of the
Dimension-Factor-Question Scheme as a principle of
configurability (figure 2). The level of dimension
Figure 2: The Dimension-Factor-Question Scheme.
provides a general overview and informs on general
trends. The level of factor provides a greater level of
granularity and focuses on more specific issues. Fi-
nally, the level of question is optional as sometimes
the user may need to delve into particular questions
whereas other times this may not be necessary. The
presentation is followed by a discussion and feedback
on the scheme.
Evaluation of Alternative Designs: This step is con-
cerned with the evaluation of:
• Alternative designs of individual visualisations on
the level of factor (figure 3). The purpose is to
investigate whether alternative visualisations that
can convey the same messages can be used to
communicate survey findings to the stakeholders
and to see whether certain visualisations are more
popular than others. The visualisations are devel-
oped with Tableau 3.
Figure 3: Visualisations on factor level.
• Visualisations of additional information (progress
and comparison) (figure 4). In this part the stake-
holders are also asked whether they want to see
the full range of the answers or only the positive
(or negative) ones.
Figure 4: Visualisations on Additional Information.
• Visualisations of navigation or organisation of the
data. The purpose here is to elicit stakeholders
preferences regarding the different approaches to
accessing the available information in the dash-
board. The company’s dashboard gives a flat pre-
sentation of all the given questions and the way to
narrow down the information that is presented is
through the use of filters. Alternatively, systems
use menus as navigation tools. There are different
types of menus like flat menus or tree-like menus
that may be used for navigation. For the purposes
of this project there are two interactive menus pre-
sented (figures 5 and 6). These representations -
that also adopt the Mantra’s guidelines- give the
ability to multiple users to view the data on dif-
ferent levels of specificity. For instance, a school
principal would be possibly more interested at
first in school-level data. After the first reading
CSEDU 2019 - 11th International Conference on Computer Supported Education
342

of the data, they can drill down to the levels of
subject, teacher, and class in order to obtain in-
formation in more depth. This part attempts to
address the challenging task of satisfying needs
of multiple stakeholders (Siemens and d Baker,
2012).
Figure 5: Interactive Menu 1.
Figure 6: Interactive Menu 2.
The participants are given a series of visualisations
and are told to rate them according to their prefer-
ences (1 - least preferred to 4 - most preferred). Af-
ter that they are given space to write the criteria they
used to rate the visualisations and draw or describe
the ideal visualisation for them.
Evaluation of Additional Information: This step is
also divided into three parts:
The first part seeks answers on both the content
of information as well as the visual representation of
the information. More specifically, it has to do with
the presentation of all the dimensions in a list along-
side the percentage of the positive answers on dimen-
sion level. Proposed visual representations for this
information include dark/light blue thumb-ups and
dark/light red thumb-downs (the answers are divided
in four equal parts), traffics lights (three parts), smi-
ley/sad emoticons (two parts). The second part asks
about the amount of information on the level of factor.
Simply putting it, once the user selects a factor from
the respective dimension they can see only the graph
that corresponds to this particular factor. Additionally
the user can see the progress of the factor over time
and to comparatively look the answers of this factor
on the level of class, teacher, or subject. The third
part is complementary to the second part. It asks the
stakeholders if they want the system to present all the
information in one dashboard (figure 7) or to give the
ability to the user to see one visualisation at a time
using different buttons.
Features for Effective Data Interpretation: The
aim here is to gather stakeholders’ feedback on fea-
tures that may be used to facilitate effective data in-
terpretation without excessive cognitive load. This
includes consideration of colours (one colour, one
colour in different hues, different colours), thresholds
set by the user, banners that briefly describe the visu-
alised information, push notifications (SMS, e-mail)
to the user with worth noting findings, voice chatbots
i.e. Alexa by Amazon, which interacts with the user
and simplifies the presentation of desired findings on
the users screen.
Features for Actionable Decision Making: The fi-
nal step deals with features that may be used to fa-
cilitate actionable decision making. The stakeholders
feedback is required in the following four features:
1. A blank box with a prompt to the user to keep
notes on immediate thoughts
2. Direct question to the user about what they are
planning to do to address possibly problematic
cases
3. A box that contains information on how other peo-
ple usually react to similar cases
4. A drop down window with a list of predefined al-
ternative reactions
4 A CASE STUDY
4.1 Requirements Workshop
The requirements elicitation process took place in the
context of a requirements workshop. The workshop
took place at the UCL Knowledge Lab (London) on
the 2nd of December 2017. It was a 90-minute session
attended by a cohort of seven stakeholders. The group
of participants was fairly diverse as it comprised one
teaching assistant, two teachers (history and ICT), one
Communicating Learning Analytics: Stakeholder Participation and Early Stage Requirement Analysis
343

special educational needs teacher, one school princi-
pal, one school manager, and one member of a school
committee. The diversity among the stakeholders cre-
ated opportunities for stimulating and engaging dis-
cussions. The models presented were seen and evalu-
ated from different viewpoints and that was perceived
as beneficial by the participants. The workshop was
driven by the four general pillars on running work-
shops as they presented by (Lys
´
en, 2003). The pillars
suggest that the workshop must be built on partici-
pants experience and understanding, the aims need
to be understandable by all the participants, the lan-
guage used has to be adjusted to the participants level,
and all the participants must be involved and have op-
portunities to talk and participate. Following these
rules proved to be a challenge especially when par-
ticipants were approaching things from quite diverse
viewpoints.
The methodology of the workshop is an adapta-
tion of the SCRAM (Sutcliffe and Ryan, 1998). The
workshop was organised as a series of eight phases
that took place in a linear manner. The structure
of each phase follows the scheme “presentation, fo-
cus group discussion, summarisation through writ-
ten feedback”. These scheme borrows from the task
characteristics technique proposed by (Browne and
Rogich, 2001).
4.2 Findings
The workshop brought to the fore several specific re-
quirements but here we focus on two general require-
ments that could be transferred to other work. The
first is the participants’ need to take answers easily
and quickly without putting effort to interpret the vi-
sualisation of the findings. The second one goes one
step further. The participants require the system to
provide suggestions that assist the decision-making
process. The workshop also facilitated the elicitation
of more specific requirements. According to these re-
quirements:
• The participants would prefer visualisations to
contain simple graphs that provide certain infor-
mation in a straightforward manner. Enhance-
ment of visualisations with additional and assis-
tive indicators should be very careful and limited.
In many cases, the additional information seems
to confuse instead of help.
• They want to see the way a variable moves over
time so that they can be aware of its progress.
They also want to be able to compare analysis re-
sults between entities (schools. classrooms, teach-
ers, subjects). They want this information to be
part of the main visualisation of a variable in or-
der to take the maximum amount of information
at once.
• They need to see a navigation menu -preferably
multidimensional and interactive- in order to un-
derstand the way the information is organised and
access the level of interest easily. For instance, a
teacher might be interested in classroom-level an-
swers, a principal in school-level answers, and a
manager in company-level answers.
• Once they find the organisational level they are in-
terested in, they want to be able to select the level
of specificity, that is the level of dimension, factor,
and question. Configurable presentation of anal-
ysis results enables them to find the information
easily and quickly.
• The system must provide the user with a ”search
engine”. The search engine has to enable the user
to find answers easily and quickly providing them
with the maximum selection of options that can
be combined during the search.
The first four points are in essence agreements,
disagreements, or enhancements on the given proto-
types. These suggestions can be taken into account
and inform the refinement of the prototypes. On the
contrary, the last point needs further discussion as it is
a new idea emerged from the focus group discussions
during the workshop.
5 CONCLUSION
This paper introduces a new instrument that can be
used to elicit educational stakeholder requirements
and inform the design process of learning analytics
tools and dashboards in particular. This instrument
addresses an existing problem and complements other
well-established frameworks and techniques in the
area of learning analytics design. The instrument can
be used to capture their requirements with regards to
communication of learning analytics results to end
users through learning analytics visualisation dash-
boards. Its aim is to explore characteristics of visuali-
sations that help stakeholders firstly access easily the
analysis findings and secondly make well-educated
decisions based on these findings.
The instrument was implemented as a case study
in the form of a workshop. The logic of the work-
shop was to develop early prototypes as demonstra-
tions of various data visualisations and to present
them to stakeholders. The stakeholders’ role was to
look at the prototypes with a critical eye and dis-
cuss the degree that they achieve their purpose as al-
ternative communicational approaches. The design
CSEDU 2019 - 11th International Conference on Computer Supported Education
344

of the prototypes was informed by a review on in-
formation visualisation in and on existing visualisa-
tion dashboards. Some features of the prototypes
are borrowed from existing systems whereas others
are developed from scratch. This paper presented a
case study with findings from a stakeholders’ work-
shop that mainly demonstrated the need for visual-
isations that are as simple as possible and provide
the maximum information in easy-to-read interfaces.
While this may be retrospectively expected, the work-
shop emphasised the need for accompanying visu-
alised findings with recommendations that move be-
yond interpretation and help stakeholders make mean-
ingful fact-based decisions. To cover different needs
of teachers, educators and other stakeholders, a learn-
ing analytics system should be flexible to give them
the ability to choose the information they need to see
as well as the depth and the breadth of the information
presented at different levels of granularity.
With the specific design recommendations we are
making above, this work is a step towards an apprecia-
tion that data analysis cannot act alone in fulfilling the
purpose of communication as it may not convey the
intended messages in an actionable manner. While
further work is needed to understand how best to com-
municate learning analytics in a way that helps stake-
holders make the most out of these tools, the work
presented here demonstrates how an appropriate in-
strument can lead to design requirements that reflect
the actual stakeholders decision-making needs.
ACKNOWLEDGEMENTS
The research leading to these results is co-funded
from the European Union’s Horizon 2020 research
and innovation programme under grant agreement No
732489. For information about the CRISS project see
http://www.crissh2020.eu/
REFERENCES
Ali, L., Hatala, M., Ga
ˇ
sevi
´
c, D., and Jovanovi
´
c, J. (2012).
A qualitative evaluation of evolution of a learning an-
alytics tool. Computers & Education, 58(1):470–489.
Avella, J. T., Kebritchi, M., Nunn, S. G., and Kanai, T.
(2016). Learning analytics methods, benefits, and
challenges in higher education: A systematic litera-
ture review. Online Learning, 20(2):13–29.
Baker, R. S. and Inventado, P. S. (2014). Educational data
mining and learning analytics. In Learning analytics,
pages 61–75. Springer.
Browne, G. J. and Rogich, M. B. (2001). An empirical in-
vestigation of user requirements elicitation: Compar-
ing the effectiveness of prompting techniques. Journal
of Management Information Systems, 17(4):223–249.
Caddick, R. and Cable, S. (2011). Communicating the user
experience: A practical guide for creating useful UX
documentation. John Wiley & Sons.
Chatti, M. A., Dyckhoff, A. L., Schroeder, U., and Th
¨
us,
H. (2012). A reference model for learning analytics.
International Journal of Technology Enhanced Learn-
ing, 4(5-6):318–331.
Cooper, A. et al. (2012). What is analytics? definition
and essential characteristics. CETIS Analytics Series,
1(5):1–10.
Davenport, T. H. and Kim, J. (2013). Keeping up with the
quants: Your guide to understanding and using ana-
lytics. Harvard Business Review Press.
Dawson, S., Ga
ˇ
sevi
´
c, D., Siemens, G., and Joksimovic,
S. (2014). Current state and future trends: A cita-
tion network analysis of the learning analytics field.
In Proceedings of the fourth international conference
on learning analytics and knowledge, pages 231–240.
ACM.
Dietz-Uhler, B. and Hurn, J. E. (2013). Using learning ana-
lytics to predict (and improve) student success: A fac-
ulty perspective. Journal of Interactive Online Learn-
ing, 12(1):17–26.
Dollinger, M. and Lodge, J. M. (2018). Co-creation strate-
gies for learning analytics. In Proceedings of the 8th
International Conference on Learning Analytics and
Knowledge, pages 97–101. ACM.
Drachsler, H. and Greller, W. (2012). Confidence in learn-
ing analytics.
Ferguson, R. (2012). Learning analytics: drivers, develop-
ments and challenges. International Journal of Tech-
nology Enhanced Learning, 4(5/6):304–317.
Fernandes, J., Duarte, D., Ribeiro, C., Farinha, C., Pereira,
J. M., and da Silva, M. M. (2012). ithink: A game-
based approach towards improving collaboration and
participation in requirement elicitation. Procedia
Computer Science, 15:66–77.
Gottesdiener, E. (2003). Requirements by collaboration:
getting it right the first time. IEEE Software, 20(2):52–
55.
Govaerts, S., Verbert, K., Duval, E., and Pardo, A. (2012).
The student activity meter for awareness and self-
reflection. In CHI’12 Extended Abstracts on Human
Factors in Computing Systems, pages 869–884. ACM.
Hickey, A. M. and Davis, A. M. (2004). A unified model
of requirements elicitation. Journal of Management
Information Systems, 20(4):65–84.
Hofmann, H. F. and Lehner, F. (2001). Requirements engi-
neering as a success factor in software projects. IEEE
software, 18(4):58.
Holstein, K., McLaren, B. M., and Aleven, V. (2017). In-
telligent tutors as teachers’ aides: exploring teacher
needs for real-time analytics in blended classrooms.
In Proceedings of the Seventh International Learning
Analytics & Knowledge Conference, pages 257–266.
ACM.
Karkalas, S., Mavrikis, M., et al. (2016). Towards an-
alytics for educational interactive e-books: the case
of the reflective designer analytics platform (rdap).
In Proceedings of the Sixth International Conference
Communicating Learning Analytics: Stakeholder Participation and Early Stage Requirement Analysis
345

on Learning Analytics & Knowledge, pages 143–147.
ACM.
Khalil, M. and Ebner, M. (2015). Learning analytics: prin-
ciples and constraints. In EdMedia: World Conference
on Educational Media and Technology, pages 1789–
1799. Association for the Advancement of Computing
in Education (AACE).
Lys
´
en, A. (2003). Dialogue in pursuit of development–
ngo experiences. Dialogue in Pursuit of Development,
page 96.
Mandinach, E. B. and Gummer, E. S. (2016). What does
it mean for teachers to be data literate: Laying out
the skills, knowledge, and dispositions. Teaching and
Teacher Education, 60:366–376.
Martinez-Maldonado, R., Pardo, A., Mirriahi, N., Yacef,
K., Kay, J., and Clayphan, A. (2015). The latux
workflow: designing and deploying awareness tools
in technology-enabled learning settings. In Proceed-
ings of the Fifth International Conference on Learning
Analytics and Knowledge, pages 1–10. ACM.
Mavrikis, M., Gutierrez-Santos, S., and Poulovassilis, A.
(2016). Design and evaluation of teacher assistance
tools for exploratory learning environments. In Pro-
ceedings of the Sixth International Conference on
Learning Analytics & Knowledge, pages 168–172.
ACM.
Millard, N., Lynch, P., and Tracey, K. (1998). Child’s
play: using techniques developed to elicit require-
ments from children with adults. In Requirements
Engineering, 1998. Proceedings. 1998 Third Interna-
tional Conference on, pages 66–73. IEEE.
Nistala, P., Kummamuru, S., and Narayana, M. (2013). An
approach to understand and elicit requirements using
systemic models: Ensuring a connect from problem
context to requirements. Procedia Computer Science,
16:786–795.
Schwendimann, B. A., Rodriguez-Triana, M. J., Vozniuk,
A., Prieto, L. P., Boroujeni, M. S., Holzer, A., Gillet,
D., and Dillenbourg, P. (2017). Perceiving learning
at a glance: A systematic literature review of learning
dashboard research. IEEE Transactions on Learning
Technologies, 10(1):30–41.
Shneiderman, B. (1996). The eyes have it: A task by data
type taxonomy for information visualizations. In Vi-
sual Languages, 1996. Proceedings., IEEE Sympo-
sium on, pages 336–343. IEEE.
Siemens, G. and d Baker, R. S. (2012). Learning analytics
and educational data mining: towards communication
and collaboration. In Proceedings of the 2nd inter-
national conference on learning analytics and knowl-
edge, pages 252–254. ACM.
Sutcliffe, A. G. and Ryan, M. (1998). Experience with
scram, a scenario requirements analysis method. In
Requirements Engineering, 1998. Proceedings. 1998
Third International Conference on, pages 164–171.
IEEE.
Van Harmelen, M. and Workman, D. (2012). Analytics
for learning and teaching. CETIS Analytics Series,
1(3):1–40.
Zowghi, D. and Coulin, C. (2005). Requirements elicita-
tion: A survey of techniques, approaches, and tools.
In Engineering and managing software requirements,
pages 19–46. Springer.
CSEDU 2019 - 11th International Conference on Computer Supported Education
346
