
Global and Local Spatial Autocorrelation of Motorcycle Crashes in
Chile
Carola Blazquez
1
and María José Fuentes
2
1
Department of Engineering Sciences, Universidad Andres Bello, Quillota 980, Viña del Mar, Chile
2
Universidad Andres Bello, Quillota 980, Viña del Mar, Chile
Keywords: Motorcycle Crashes, Spatial Autocorrelation, Clusters.
Abstract: In Chile, the usage of motorcycles as a mode of transport is growing in unison with the number of crashes
that have arisen in recent years. Spatial statistical methods were used in this study to determine whether
motorcycle crashes showed spatial clustering over time from a global and local perspective. The global spatial
autocorrelation results indicate that high intensity clusters of collisions at intersections with traffic signals and
curved road sections resulting in fatalities persisted during the five-year study period. Locally, recurrent high
spatial patterns of motorcycle collisions arose along straight road sections and on sunny days due to the loss
of control of the vehicle, or the imprudence of the driver or pedestrian. Communes located in the centre zone
of Chile, particularly in the city of Santiago and the surrounding areas, presented a large number of highly
clustered crash attributes. The findings of this study may help authorities to target efforts towards policy
measures to improve motorcycle safety in Chile.
1 INTRODUCTION
According to the World Health Organization, traffic
crashes cause 1.2 million fatalities every year and are
the main cause of death of young adults between 15
and 29 years of age worldwide. Approximately 23%
of these deaths are motorcyclists, 22% are
pedestrians, and 4% are cyclists (WHO, 2015). In
Chile, 2,178 people were killed as a result of traffic
crashes in 2016, presenting an increase of 4.9% with
respect to 2010. This high mortality rate is partly due
to the exponential increase of vehicles in the last few
years. Additionally, Chile is the OECD member
country with the worst fatality rate with 11.9 per
100,000 inhabitants (IRTAD, 2017).
In Chile, almost 19,000 crashes occurred between
2011 and 2015 that involved motorcycles. The
national statistics indicate that deaths caused by such
crashes are ranked third and that the total number of
injuries are placed fourth with respect to other types
of crashes (CONASET, 2016). Being vulnerable road
users, motorcyclists are 27 times more frequently
killed in crashes per travelled vehicle mile than motor
vehicle passengers (NHTSA, 2012).
The motorcycle market increases every year in
many countries worldwide, and it is expected to
continue increasing in Chile as well (ANIM, 2015;
MT Motores, 2016). On average, the total number of
motorcycles has increased in 65% between 2011 and
2015. In 2016, 175,019 motorcycles were registered
throughout the country with approximately 9.6
motorcycles per 1,000 inhabitants (INE, 2016).
Motorcycles are deemed as an economical and
convenient transport mode with respect to congestion,
fuel consumption, etc. Therefore, it may be
anticipated that the number of motorcycle crashes
will grow in time. Thus, there is a need for a spatial
and temporal analysis of these crashes in Chile.
Recent studies have analysed motorcycle crashes
employing different approaches. A multiple
correspondence analysis was performed by Jalayer
and Zhou (2016) to conclude that light conditions,
time of day, driver condition, and weather conditions
are the key factors contributing to the frequency and
severity of at-fault motorcycle-involved crashes in
the state of Alabama. Flask et al (2014) employed
Bayesian multi-level mixed effects models to analyse
motorcycle crashes at the road segment level. The
authors concluded that among different
characteristics of the road segments, smaller lanes
and shoulder widths, larger horizontal degree of
curvature and larger maximum vertical grades will
increase the prediction of crashes. In another study, a
Blazquez, C. and Fuentes, M.
Global and Local Spatial Autocorrelation of Motorcycle Crashes in Chile.
DOI: 10.5220/0007716701590170
In Proceedings of the 5th International Conference on Vehicle Technology and Intelligent Transport Systems (VEHITS 2019), pages 159-170
ISBN: 978-989-758-374-2
Copyright
c
2019 by SCITEPRESS – Science and Technology Publications, Lda. All rights reserved
159

deep learning framework was developed to predict
motorcycle crash severities, which were related to
rider ejection, two-way roads, curved roads, and
weekends (Das et al, 2018). Lee et al (2018)
employed a flexible mixed multinomial logit
fractional split model to analyse the proportions of
crashes by vehicle type (including motorcycles). This
study concluded that the total employment density
has the most significant and negative influence on the
motorcycle crash proportion, and that the proportions
of households with no vehicle negatively impacts the
proportion of motorcycle crashes. Lastly, Chung and
Song (2018) employed multivariable statistical
methods to identify the critical factors associated to
age, motorcycle speed, curved sections, among others
that impact motorcycle crash severity in Korea.
Other researchers have studied the spatial problem
using statistical methods such as spatial
autocorrelation to identify spatial clusters of crashes.
For example, Dezman et al (2016) analysed hotspots
of traffic crashes at the census tract level in Baltimore
using spatial autocorrelation techniques. Spatial
autocorrelation was used to examine hotspots of time
of occurrence, severity, and location of traffic crashes
aggregated to the traffic analysis zonal level in Shiraz,
Iran (Soltani and Askari, 2017). In another study,
Pour et al (2018) applied spatial autocorrelation to
detect any dependency between time and location of
vehicle-pedestrian crashes in Melbourne. Blazquez et
al (2018) performed a spatial autocorrelation of cargo
trucks on Chilean highways at the global and local
level. Yet another study was performed by Aghajani
et al (2017) to identify spatial and temporal patterns
of traffic crashes, and to determine hotspots of fatal
and injury outcomes in Iran.
The authors are not aware of any study performed
in Chile that employs spatial autocorrelation methods
to analyse recurrent spatial clustering of motorcycle
crashes through time. The objective of this study is to
employ spatial statistical indicators to distinguish
significant patterns of motorcycle crashes at the
commune level in Chile, and to assess whether a
spatial dependence of such patterns exists with
respect to the main crash attributes (e.g., type of
crash, relative location, contributing factors, and
weather) that persisted during the 2011-2015 period.
The results of this macroscopic crash study provides
a decision-making tool for helping authorities and
safety professionals allocate resources and apply
policy based countermeasures.
2 METHODOLOGY
The spatial statistical methods were applied to
determine the spatial association of the value of a
certain variable at a given location with values of that
variable at neighbouring locations at the global and
local level (Mitra, 2009). First, the global Moran´s I
index was employed to test the general spatial
autocorrelation of the main crash attributes for each
year of the studied period. Second, a local Moran´s I
statistic was employed to detect statistically
significant clusters with respect to each of these crash
attributes. The following subsections describe each
statistic.
2.1 Global Spatial Autocorrelation
The global Moran´s I indicator is used to identify
statistically significant spatial patterns of crashes by
quantifying the magnitude of clustering or dispersion
of these crashes with Equation 1.
(1)
where x
i
is the variable value at a particular location
i, is the mean of the variable, w
ij
are the elements of
a spatial matrix with weights representing proximity
relationships between location i and neighbouring
location j, S
0
is the summation of all elements w
ij
, and
n is the total number of locations.
The values of Moran´s I may range between -1
(representing perfect dispersion with a strong
negative autocorrelation) and 1 (indicating perfect
clusterisation with a strong positive autocorrelation).
A random spatial pattern exists when the value of
Moran´s I is near zero. The results of the spatial
autocorrelation are interpreted within the context of
its null hypothesis, which denotes that an attribute is
randomly distributed among features in the study
area. The Z score method is employed to compute the
statistical significance of the Moran´s I index. A
positive Z score for a feature indicates that the
neighbouring features have similar values, whereas a
negative Z score denotes that the feature is
surrounded by dissimilar values.
2.2 Local Spatial Autocorrelation
While the global Moran´s I provides a single value to
measure the overall spatial pattern of a certain
attribute throughout a complete study area, Anselin´s
local Moran´s I examines the existence of local
spatial clusters of similar high, low, or atypical values
VEHITS 2019 - 5th International Conference on Vehicle Technology and Intelligent Transport Systems
160
(e.g., high value surrounded by low attribute value
location, and low values with high attribute value
neighbouring features) at certain locations, as
described in Anselin (1995). Thus, the results of this
statistic shows the value similarity of a location to its
neighbours, and in addition, tests the significance of
this similarity (Meng, 2016). The local Moran´s I
index is expressed by Equation 2.
(2)
where x
i
is the variable value at location i, is the
mean of the variable, w
ij
is the spatial weight between
locations i and j, S
i
is the sum of the weights, and n is
the total number of locations.
Similarly to the global indicator, the spatial
patterns are associated to Z score values to determine
the statistical significance of the results. Positive Z
score values imply that neighbouring values are
similar and negative values indicate that near values
are dissimilar (Manepalli et al, 2011). This study will
focus on identifying locations of clusters of
motorcycle crashes with particularly high crash
attribute values.
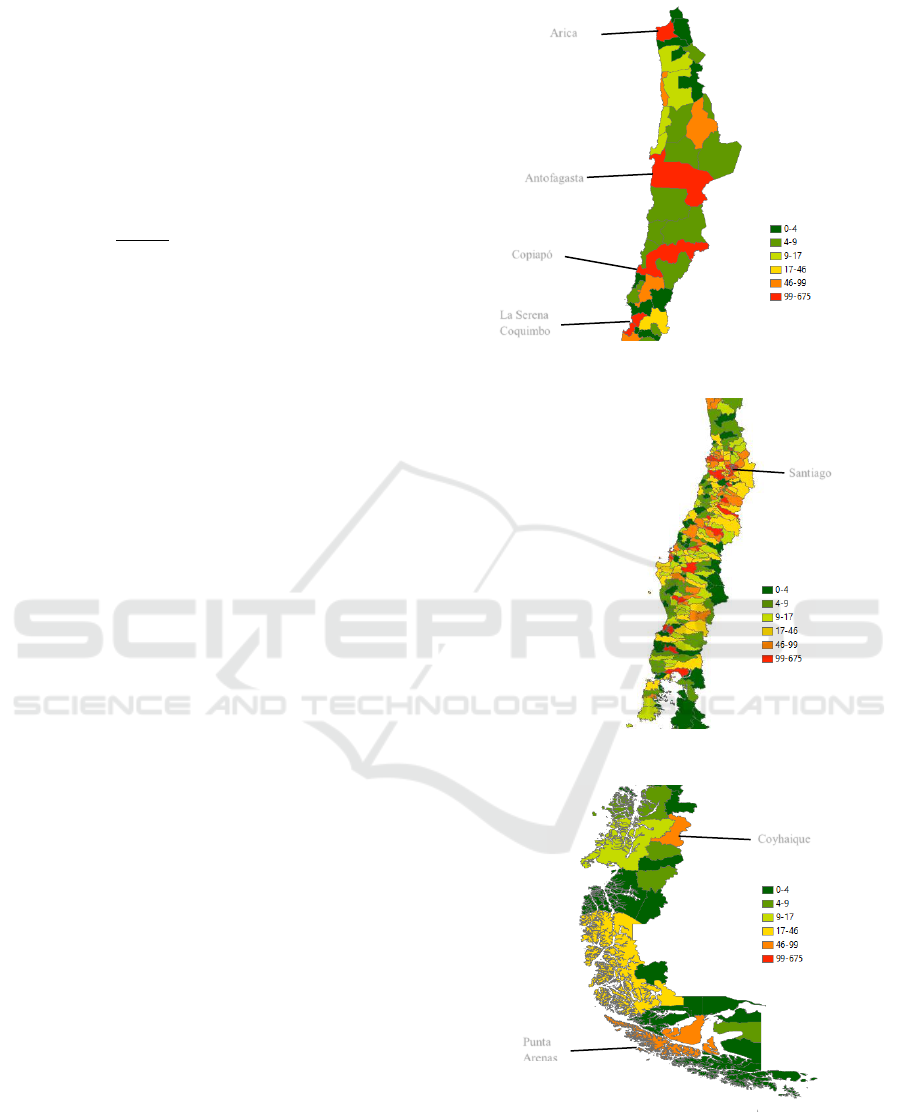
3 DATA DESCRIPTION
The 2011-2015 crash database employed in this study
was provided by the National Commission of Traffic
Safety (CONASET, acronym in Spanish). A total of
18,826 motorcycle crashes were successfully
aggregated into 343 communes, as shown in Figure 1.
This figure shows that five communes (Arica,
Antofagasta, Copiapó, La Serena, and Coquimbo)
present a high number of such crashes in the north
zone of Chile, many crashes prevailed in several
communes of the centre zone of the country, and the
communes of Coyhaique and Punta Arenas in the
south zone have the largest number of motorcycle
crashes. Note that over 40% of the motorcycle crashes
occurred in the Metropolitan Region during the
studied period, where most of the Chilean population
resides in the capital city, Santiago. Figure 2 shows
an increase in the total number of motorcycle crashes
over time and that this number almost doubled in
2015 with respect to previous years.
a) North Zone
b) Centre Zone
c) South Zone
Figure 1: Motorcycle crashes for the 2011-2015 period
aggregated at the commune level for the a) North Zone, b)
Centre Zone, and c) South Zone.
Santiago
Arica
Antofagasta
Copiapó
La Serena
Coquimbo
Punta
Arenas
Coyhaique
Global and Local Spatial Autocorrelation of Motorcycle Crashes in Chile
161
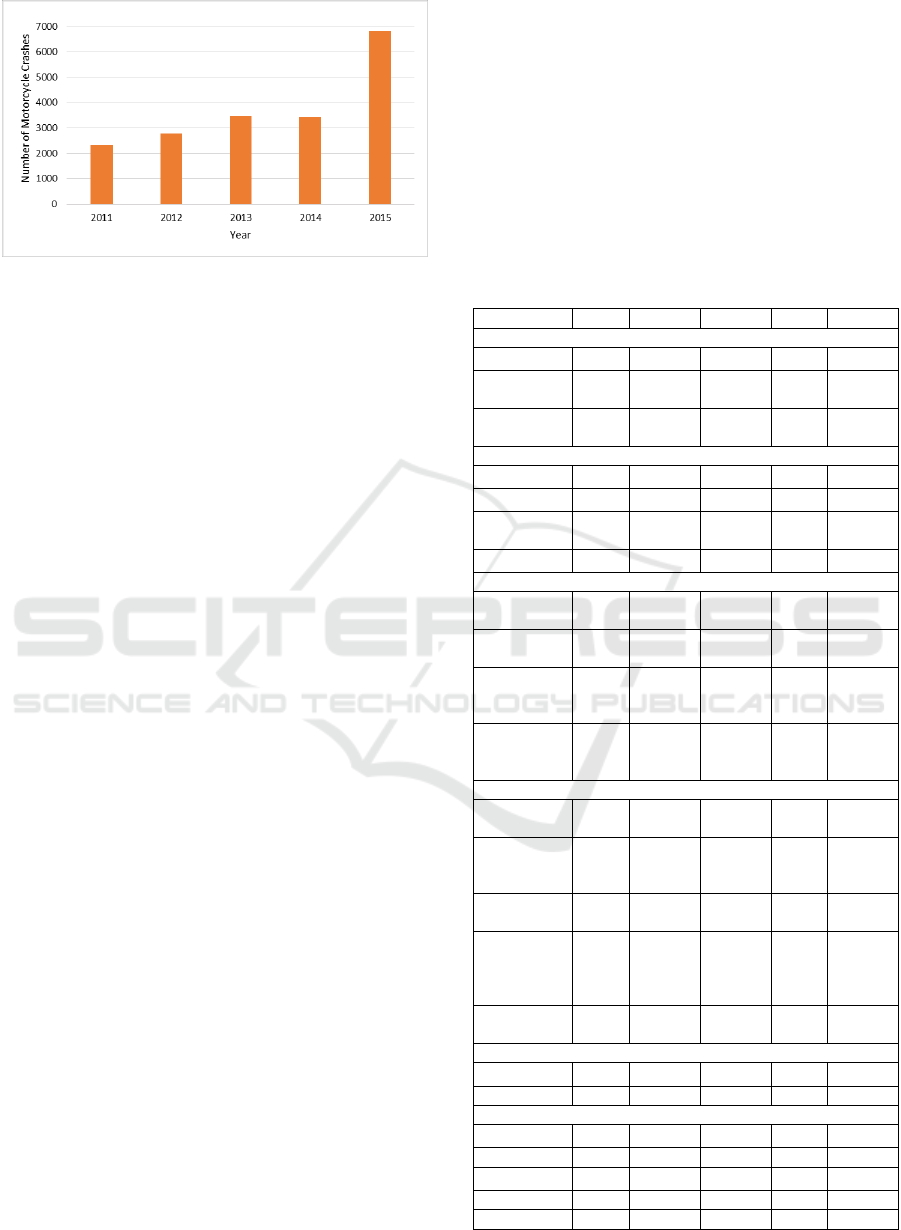
Figure 2: Number of motorcycle crashes for the 2011-2015
period.
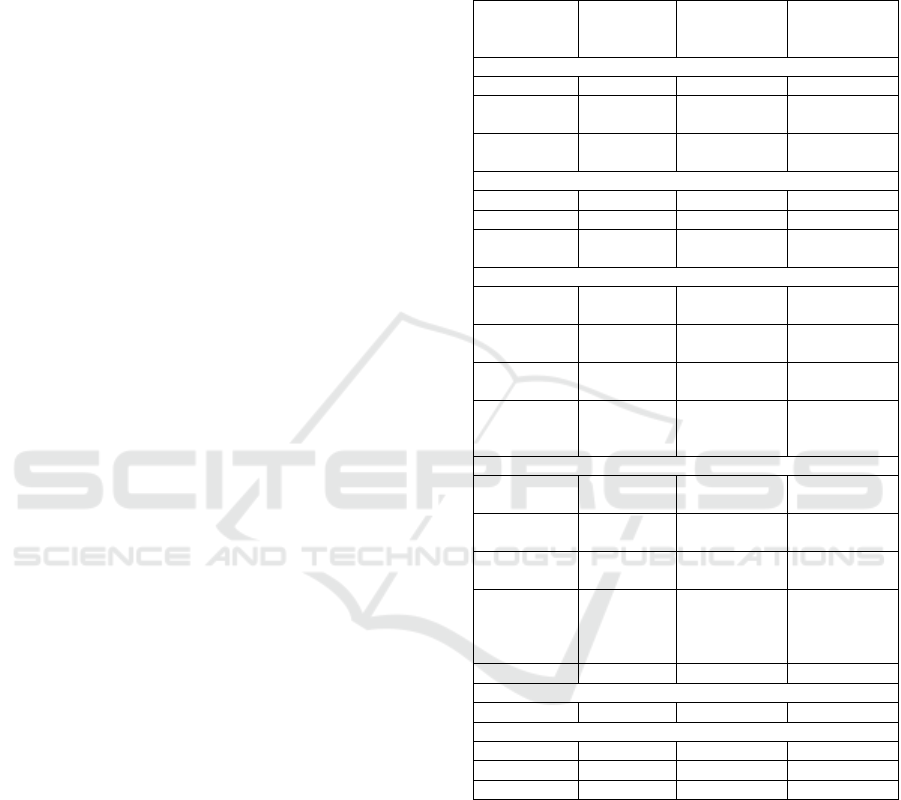
The main attributes of the motorcycle crashes
were classified into six groups (type of injury, type of
crash, relative location, contributing factors, type of
zone, and weather conditions), as shown in Table 1.
This table indicates that most crashes occurred in
urban areas (85%) and on sunny days (86%). The
imprudence of the driver was the main contributing
cause of these crashes, representing 40% of the total
number of crashes. On average, collision between two
or more moving vehicles (56.8%) was the most
frequent type of crash, followed by impacts with
static vehicles or objects (19.9%), pedestrian crashes
(10.3%), and rollovers (8.9%). With respect to the
relative location of motorcycle crashes, 38.0% of
these crashes occurred on straight road segments and
6.7% on curved road sections, whereas 22.7% and
4.4% of motorcycle crashes arose at intersections
with traffic signals and without signage, respectively.
Regarding the type of injury, 405 victims were
killed, and 2,450 people suffered serious injuries as a
result of motorcycle crashes during the studied
period. Male victims were more involved in
motorcycle crashes (80%), and young adults between
19 and 33 years of age (42.6%). Approximately 22%
(4,089) motorcycle crashes occurred between 6 pm
and 9 pm. Friday is the day of the week with the
largest occurrence of motorcycle crashes, which
accounted for 16.3% of all studied crashes. On
average, almost 60% of the crashes occurred between
January and June with the highest number of
motorcycle crashes arising in March (2,069).
4 RESULTS
An incremental spatial autocorrelation analysis was
first performed to obtain a distance threshold or
bandwidth value for each analysed crash attribute and
year. This parameter value maximizes the spatial
autocorrelation (Z score), meaning that a cluster
exists up to this calculated distance with a statistical
significance of 0.01. Both global and local spatial
autocorrelation analyses employed these distance
thresholds, as shown in the following subsections.
Additionally, notice that in both spatial
autocorrelation, Z score values greater than 1.96 with
a 95% confidence were utilised to determine the
statistical significance for each value of the
motorcycle crash attributes.
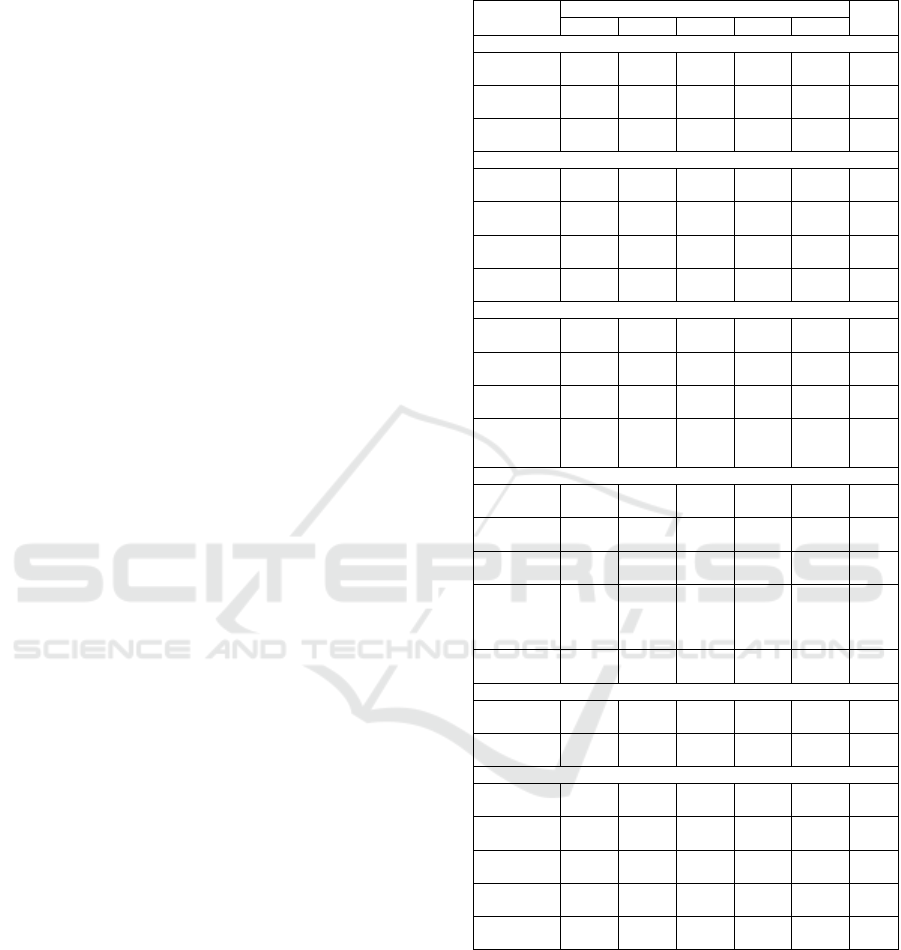
Table 1: Number of motorcycle crashes for each analysed
variable per year.
Variable
2011
2012
2013
2014
2015
Type of injury
Fatalities
29
78
72
75
151
Seriously
Injured
146
285
349
334
1336
Slightly
Injured
2127
2647
2588
6569
5339
Type of crash
Collision
1150
1393
1811
1826
4508
Impact
579
649
854
899
779
Pedestrian
crash
318
410
431
407
370
Rollover
156
170
217
175
950
Relative location
Straight
section
1250
1513
1850
1783
3660
Curved
section
138
162
242
265
461
Intersection
with
signage
654
822
967
1019
1877
Intersection
without
signage
111
123
147
148
324
Contributing factors
Imprudence
of driver
866
1079
1756
1433
2428
Imprudence
of
pedestrian
242
296
312
357
467
Loss of
control
225
282
272
309
1900
Driving
under
influence
alcohol
197
213
237
244
748
Other
causes
420
533
639
732
944
Type of zone
Urban
1962
2341
2903
2928
5868
Rural
353
445
560
517
949
Weather conditions
Sunny
2154
2323
2907
2799
5939
Drizzly
8
41
28
38
34
Foggy
5
15
23
19
16
Rainy
55
133
150
180
332
Cloudy
93
272
351
408
495
VEHITS 2019 - 5th International Conference on Vehicle Technology and Intelligent Transport Systems
162
4.1 Global Moran´s I
Table 2 shows the global spatial autocorrelation
results. The average and standard deviation values of
the global Moran’s I index were computed only for
those crash attributes that presented a recurrent
clustering of at least three years during the studied
period.
Different strength measures of persistent global
spatial patterns are observed among the different
crash attributes. For example, motorcycle crashes that
occurred at intersections with traffic signals presents
a stronger positive spatial pattern with an average
Moran´s I value of 0.088 during the five years of the
study than any other analysed attribute in the table.
With respect to the type of injury, victims that
were seriously injured have the lowest clustering
intensity with an average Moran´s I value of 0.021
compared to the remaining attributes. Crash-caused
fatalities clustered during all five years of the 2011-
2015 period with a high average clustering intensity
of 0.073, followed by slight injury outcomes with an
average global positive autocorrelation of 0.050.
Regarding the type of crash, collisions between
moving vehicles present a global positive
autocorrelation of 0.053 and are clustered during the
five years of the study period, followed by impacts
with static vehicles (0.036) and pedestrian crashes
(0.034). Whereas, rollovers of motorcycle crashes
were insignificant during the study period.
The relative locations of motorcycle crashes show
positive spatial dependences of arising along straight
(0.053) and curved (0.066) road sections, and at
intersections with and without traffic signals for all
studied years. Insignificant results were obtained for
crashes that occurred on rural zones, and thus, these
were not listed in Table 2. Whilst motorcycle crashes
that arose in urban zones tend to cluster during four
years of the study period with an average clustering
intensity of 0.051.
The contribution cause related to driving under
the influence of alcohol shows the largest clustering
intensity (0.064) among the other contributing
factors, as in the results of Blazquez et al (2015).
However, the loss of control of the vehicle, the
imprudence of pedestrians and the imprudence of
drivers are other causes with high average Moran´s I
values of 0.059, 0.055, and 0.051, respectively, which
persisted for three or more years. Finally, the weather
conditions of motorcycle crashes tend to cluster
during all five years of the study period for sunny
days with an average statistic value of 0.064, and
during four years for drizzly and foggy days with an
average global Moran´s I value of 0.085 and 0.044,
respectively. No significant results were observed for
motorcycle crashes that occurred on rainy or cloudy
days.
Table 2: Results of recurrent global spatial autocorrelation
of motorcycle crashes.
Variable
Average
Moran´s I
Standard
Deviation
Moran´s I
Number of
Clustering
Years
Type of injury
Fatalities
0.073
0.029
5
Seriously
injured
0.021
0.019
3
Slightly
injured
0.050
0.041
5
Type of crash
Collision
0.053
0.027
5
Impact
0.036
0.015
5
Pedestrian
crash
0.034
0.036
3
Relative location
Straight
section
0.053
0.027
5
Curved
section
0.066
0.031
5
Intersection
with signage
0.088
0.017
5
Intersection
without
signage
0.053
0.028
5
Contributing factors
Imprudence
of driver
0.051
0.041
4
Imprudence
of pedestrian
0.055
0.041
3
Loss of
control
0.059
0.036
5
Driving
under
influence
alcohol
0.064
0.039
4
Other causes
0.037
0.023
5
Type of zone
Urban
0.051
0.035
4
Weather conditions
Sunny
0.064
0.023
5
Drizzly
0.085
0.023
4
Foggy
0.044
0.023
4
4.2 Local Moran´s I
As aforementioned, the local Moran´s I statistic
identifies high and low value clusters, and spatial
outliers. This subsection presents the local spatial
autocorrelation results regarding the location of
motorcycle crash clusters of high attribute values
surrounded by high attribute values (High-High local
spatial pattern, HH).
The number of HH spatial clusters for each
analysed motorcycle crash attribute per year are
shown in Table 3. This table indicates that the largest
Global and Local Spatial Autocorrelation of Motorcycle Crashes in Chile
163
total number of HH crashes (287) during the studied
period are related to motorcycle crashes that occurred
on road segments with straight sections, followed by
roads with curved sections and fatality outcomes.
Overall, HH clusters appeared in four or five years of
the studied period. However, motorcycle crashes that
resulted in rollovers on rainy or cloudy days along
rural areas present a low existence or lack of
clustering of HH values over time, concurring with
the global spatial autocorrelation results.
A considerable increase in the number of HH
spatial crash clusters that arose in rural areas are
detected in the last couple of years. This increase
should be further investigated using crash data from
more recent years to identify any additional trend.
Also notice that the total number of HH clusters for
all contributing causes of motorcycle crashes is
greater than 200, which highlights the importance of
these factors among the generation of these crashes.
On average, there are several large number of HH
clusters of motorcycle collisions that occurred on
sunny days along straight or curved road segments
caused by the loss of control of the vehicle or the
imprudence of the driver or the pedestrian generating
fatality outcomes.
Note that although approximately 7% of all
reported crashes occurred on curved road segments,
these tend to locally cluster with high values over
time. Similarly, very few motorcycle crashes
occurred on drizzly days compared to the other
weather conditions. However, 226 HH clusters of
such crashes arise on drizzly days during the 2011-
2015 period.
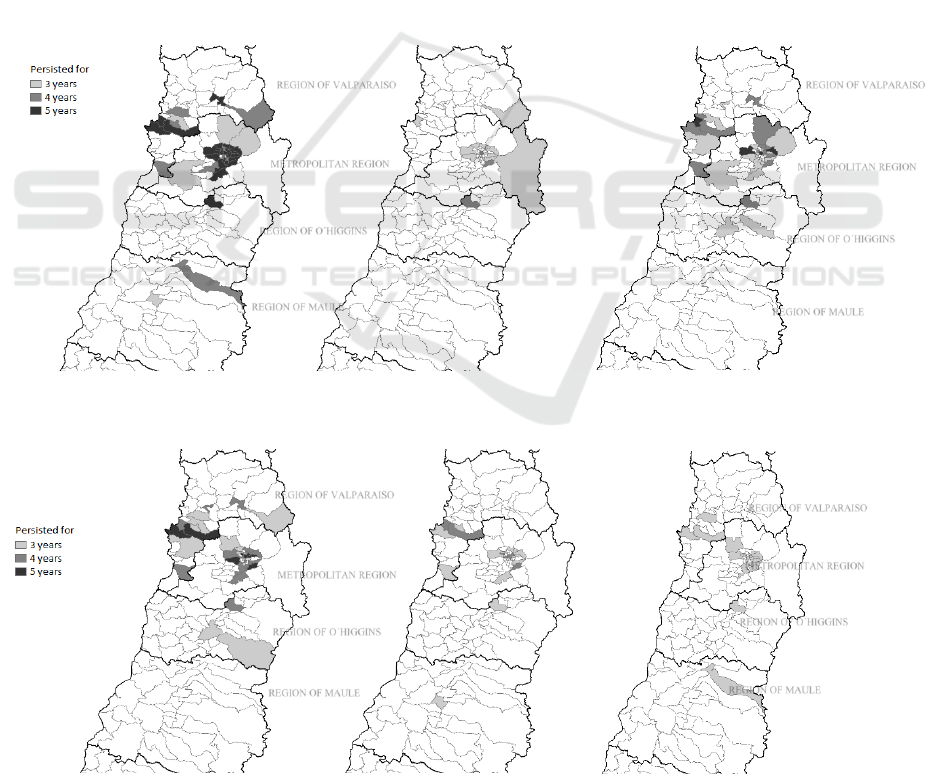
Figures 3-8 present spatial clusters at the
commune level for each analysed motorcycle crash
attribute that persisted for three, four, or five years of
the studied period using the local Moran´s I statistic.
These figures depict that the communes belonging to
four regions of the country (Region of Valparaiso,
Metropolitan Region, and regions of O´Higgins and
Maule) represent statistically significant HH spatial
patterns. This result may be explained by the high
population and the substantial increase in the usage of
motorcycles as a transport mode in these four regions
between 2011 and 2015.
Figure 3 shows the HH clusters of fatality
outcomes that persisted for the whole studied period
in the communes situated in the Metropolitan Region,
the Region of Valparaiso, and the Region of
O´Higgins. Whereas HH clusters of seriously or
slightly injured victims are recurrent for less number
of years and only in some communes of these regions.
Similarly to the results presented in Table 3,
Figure 4 shows that collisions represent the largest
Table 3: Number of HH spatial clusters of motorcycle crash
attributes that arose during the 2011-2015 period.
Variable
Year
∑HH
2011
2012
2013
2014
2015
Type of injury
Fatalities
54
(46.4)
46
(44.9)
52
(48.4)
51
(58.4)
50
(61.5)
253
Seriously
Injured
46
(31.5)
0
23
(33.0)
31
(38.4)
49
(44.7)
149
Slightly
Injured
55
(44.7)
39
(20.8)
20
(12.8)
48
(45.7)
61
(56.4)
223
Type of crash
Collision
57
(41.6)
45
(31.3)
53
(33.6)
24
(59.8)
45
(42.5)
224
Impact
61
(32.6)
30
(70.3)
31
(80.7)
38
(52.2)
4 (72.3)
164
Pedestrian
crash
62
(28.4)
12 (4.4)
7 (11.6)
54
(45.4)
49
(45.3)
184
Rollover
10
(23.4)
0
7 (16.3)
14 (5.9)
25
(39.6)
56
Relative location
Straight
section
61
(34.7)
50
(38.2)
58
(37.1)
68
(35.9)
50
(53.7)
287
Curved
section
35
(41.2)
50
(39.4)
60
(37.4)
51
(53.2)
57
(55.0)
253
Intersection
with signage
30
(83.3)
34
(63.8)
39
(52.2)
39
(75.1)
34
(84.1)
176
Intersection
without
signage
34
(42.5)
35
(37.5)
39
(54.8)
40
(52.1)
35
(77.6)
183
Contributing factors
Imprudence
of driver
51
(44.5)
44
(17.1)
43
(37.5)
55
(58.9)
47
(20.2)
240
Imprudence
of pedestrian
30
(24.3)
48
(39.7)
53
(43.1)
56
(53.5)
53
(58.3)
240
Loss of
control
27
(13.3)
50
(61.2)
56
(36.9)
53
(49.1)
59
(53.7)
245
Driving
under
influence
alcohol
25
(12.1)
55
(31.3)
45
(15.1)
54
(56.2)
53
(54.6)
232
Other causes
48
(62.9)
38
(38.4)
42
(21.3)
49
(63.9)
29
(44.3)
206
Type of zone
Urban
56
(46.9)
4 (13.3)
24
(11.3)
51 (5.9)
60
(20.8)
195
Rural
0
8 (9.8)
5 (5.1)
49
(39.1)
61
(20.4)
123
Weather conditions
Sunny
50
(49.6)
41
(42.5)
47
(36.2)
48
(52.4)
54
(53.1)
240
Drizzly
0
57
(48.1)
62
(50.7)
52
(59.5)
55
(57.2)
226
Foggy
0
30
(26.4)
17
(41.9)
48
(44.2)
55
(35.2)
150
Rainy
19
(43.2)
0
0
21
(52.5)
16
(61.4)
56
Cloudy
40
(72.8)
0
0
0
36
(59.9)
76
Note: Average local Moran´s I values are shown in parenthesis.
number of HH spatial clusters among other types of
crashes. These clusters are mostly located in
communes of the Region of Valparaiso and
Metropolitan Region. Notice that rollover-related
crash HH clusters are not shown since such clusters
in all communes were positive and significant for less
than three years.
Figure 5 presents the recurrent HH clusters of
motorcycle crashes with respect to their relative
VEHITS 2019 - 5th International Conference on Vehicle Technology and Intelligent Transport Systems
164
location at the commune level. This figure shows that
HH clusters in some communes in the Region of
Valparaiso and in the Metropolitan Region, and in the
commune of Rancagua in the Region of O´Higgins
persisted for the five years of the studied period, and
for all types of relative locations. Conversely,
recurrent HH clusters appeared in many communes in
the centre of the Metropolitan Region (coinciding
with the city of Santiago) along straight and curved
road sections.
Communes in the four regions shown in Figure 6
present persistent HH clusters due to the imprudence
of the pedestrian, whereas clustering of crashes due to
imprudence of the driver that persisted for all five
years of the 2011-2015 are concentrated in the city of
Santiago, a couple of communes in the Region of
Valparaiso, and Rancagua in the Region of
O´Higgins. This figure also suggests that motorcycle
crashes due to the loss of control and driving under
the influence of alcohol are highly clustered during
the five years of the studied period in a few
communes in the city of Santiago and Region of
Valparaiso. HH clusters appear in a lesser degree a a
result of other causes.
Recurrent spatial clustering of crashes that
occurred in urban areas are recurrent for 3 or 4 years
during the studied period in communes of the regions
of O´Higgins and Maule, as shown in Figure 7. No
HH clustering of crashes in rural zones was perceived
in any commune for three or more years.
Regarding the weather conditions, Figure 8
depicts HH spatial clusters of crashes that arose on
sunny and drizzly days that persisted for three or more
years. Concurring with the results in Table 3, this
figure shows that communes with clustering of
crashes on sunny days persisted for three to five
years, whilst more communes are displayed with
crash clusters during drizzly days, however for three
and four years of the studied period.
a) Fatalities b) Seriously injured c) Slightly injured
Figure 3: HH spatial clusters for each type of injury.
a) Collision b) Impact c) Pedestrian crash
Figure 4: HH spatial clusters for each type of crash.
REGION OF VALPARAISO
METROPOLITAN REGION
REGION OF O´HIGGINS
REGION OF MAULE
REGION OF VALPARAISO
METROPOLITAN REGION
REGION OF O´HIGGINS
REGION OF MAULE
REGION OF VALPARAISO
METROPOLITAN REGION
REGION OF O´HIGGINS
REGION OF MAULE
REGION OF VALPARAISO
METROPOLITAN REGION
REGION OF O´HIGGINS
REGION OF MAULE
Global and Local Spatial Autocorrelation of Motorcycle Crashes in Chile
165
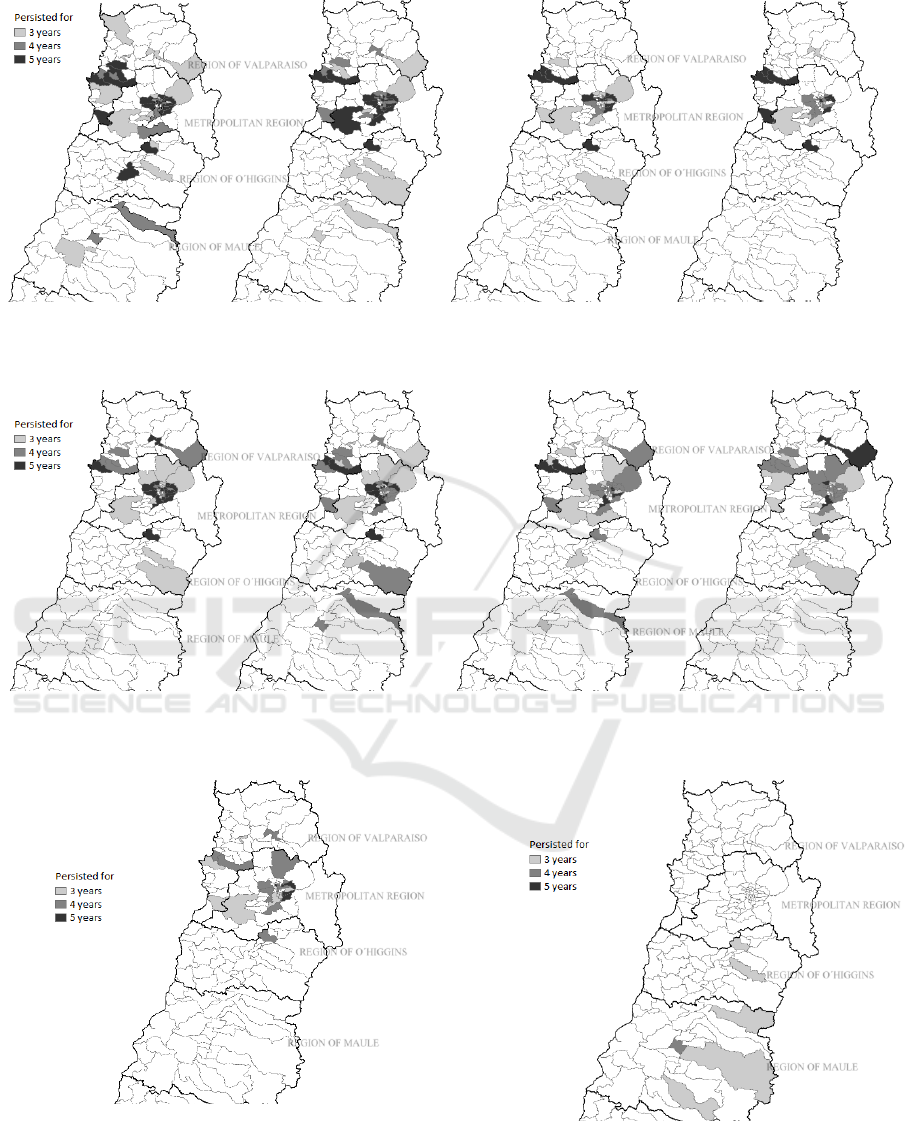
a) Straight section b) Curved section c) With signage d) Without signage
Figure 5: HH spatial clusters for the relative location of motorcycle crashes.
a) Driver´s imprudence b) Pedestrian´s imprudence c) Loss of control d) Alcohol of driver
Figure 6: HH spatial clusters for the contributing factor attribute.
e) Other causes
Figure 6 (continued): HH spatial clusters for the
contributing factor attribute.
a) Urban zone
Figure 7: HH spatial clusters of crashes in urban zones.
REGION OF VALPARAISO
METROPOLITAN REGION
REGION OF O´HIGGINS
REGION OF MAULE
REGION OF VALPARAISO
METROPOLITAN REGION
REGION OF O´HIGGINS
REGION OF MAULE
REGION OF VALPARAISO
METROPOLITAN REGION
REGION OF O´HIGGINS
REGION OF MAULE
REGION OF VALPARAISO
METROPOLITAN REGION
REGION OF O´HIGGINS
REGION OF MAULE
REGION OF VALPARAISO
METROPOLITAN REGION
REGION OF O´HIGGINS
REGION OF MAULE
REGION OF VALPARAISO
METROPOLITAN REGION
REGION OF O´HIGGINS
REGION OF MAULE
VEHITS 2019 - 5th International Conference on Vehicle Technology and Intelligent Transport Systems
166
a) Sunny days
b) Drizzly days
Figure 8: HH spatial clusters for weather conditions.
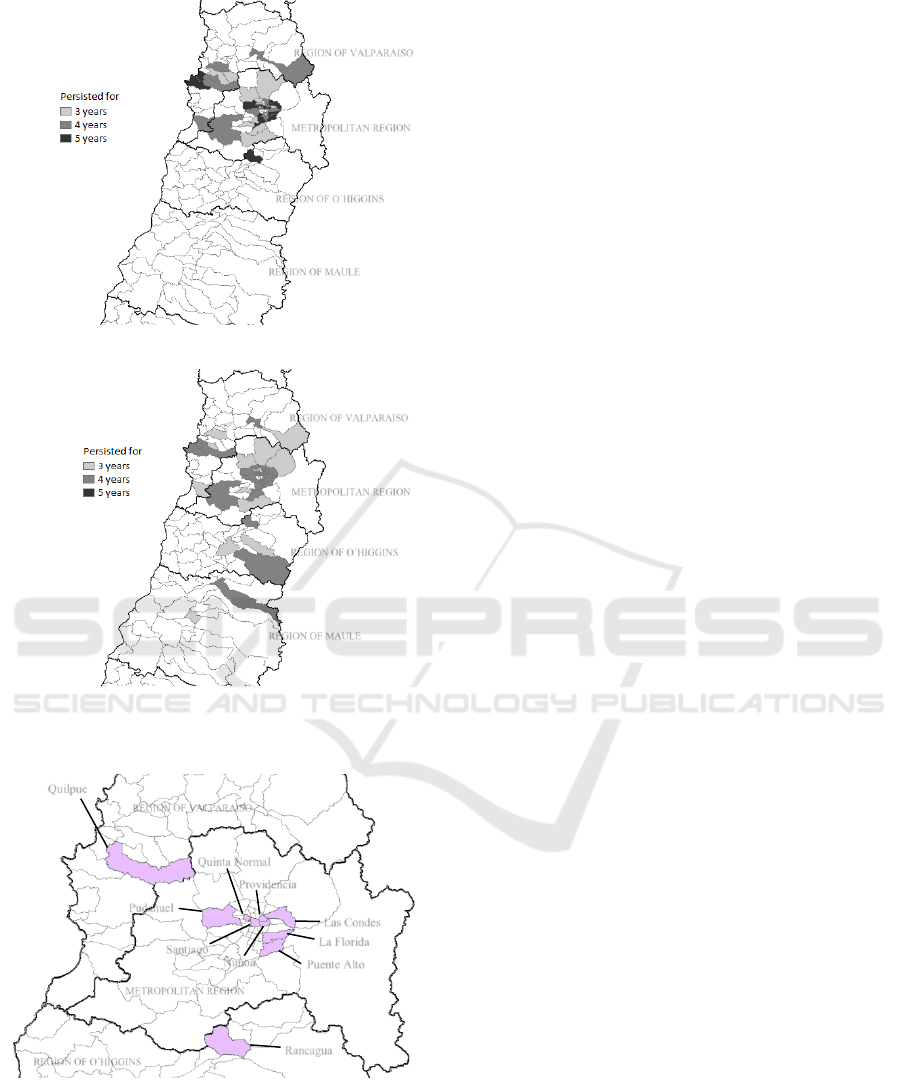
Figure 9: Communes with the largest number of HH
attribute clusters during the 2011-2015 period.
The top ten Chilean communes with the largest
number of HH for the 23 analysed crash attributes in
the five-year period are shown in Figure 9. This figure
shows that 8 out of these 10 communes with the most
number of HH crash attributes are located in the
Metropolitan Region. The communes in the regions
of O´Higgins and Valparaiso (Rancagua and Quilpue,
respectively) are located in the vicinity of the
Metropolitan Region. The large number of HH
clusters of crashes in this area is due to the fact that
over 50% of Chile´s population resides in the
Metropolitan Region and the surrounding areas, and
approximately 65.5% of the total number of
motorcycles nationwide are registered in these three
regions, which are more prone to be exposed to traffic
crashes.
Table 4 presents the average value of the local
Moran´s I index and average Z score in parenthesis
for recurrent crash attributes for the ten communes
depicted in Figure 9. Those communes with no values
indicate that that particular variable was significant
for less than three years. Therefore, HH crash clusters
are not present for those vehicles that rolled over in
rural areas on cloudy or foggy days for any of the ten
analysed communes. HH clusters only exist for the
attributes associated to urban areas and rainy days in
Rancagua and Santiago, respectively.
Overall, Santiago has the highest intensity of HH
clusters in 13 of the crash attributes when compared
to the rest of the communes, similarly to the findings
in Blazquez and Celis (2013) and Blazquez et al
(2016). This result may be attributed to that this
commune has the largest number of registered
motorcycles in Chile with a total of 5.571
motorcycles in 2015, and an increase of 23.6% in the
number of registered motorcycles between 2011 and
2015. Additionally, Santiago is a commune that has a
daily floating population of approximately 2 million
people due to its strong political, economic, and
commercial activities in an area of only 23.2 km
2
, and
a residential population of 404,495 inhabitants (INE,
2017). Authorities and CONASET should prioritize
the promotion and education of the community about
road safety in this commune.
5 CONCLUSIONS
In this study, the global Moran´s I index was
employed to detect overall spatial autocorrelation of
motorcycle crashes in Chile at the commune level. In
addition, a local spatial autocorrelation was
performed with Anselin´s local Moran´s I to identify
statistically significant crashes that are recurrent
during the 2011-2015 period. Six groups of
motorcycle crash attributes were examined in the
autocorrelation analysis. Certain crash attributes tend
to be located closer together than randomly over time.
REGION OF VALPARAISO
METROPOLITAN REGION
REGION OF O´HIGGINS
REGION OF MAULE
METROPOLITAN REGION
Quilpue
Ñuñoa
Las Condes
La Florida
Puente Alto
Santiago
Quinta Normal
Pudahuel
Providencia
Rancagua
REGION OF O´HIGGINS
REGION OF VALPARAISO
REGION OF VALPARAISO
METROPOLITAN REGION
REGION OF O´HIGGINS
REGION OF MAULE
Global and Local Spatial Autocorrelation of Motorcycle Crashes in Chile
167

Table 4: Number of HH spatial clusters of motorcycle crash attributes per commune that persisted for three or more years
during the 2011-2015 period.
Variable
Commune
La
Florida
Las
Condes
Ñuñoa
Providencia
Pudahuel
Puente
Alto
Quilpue
Quinta
Normal
Rancagua
Santiago
Type of injury
Fatalities
96.9
(4.3)
107.2
(4.2)
118.1
(4.2)
117.2 (4.4)
62.4
(4.2)
162.5
(4.2)
84.3
(4.1)
56.8
(4.3)
120.0
(4.0)
207.1
(4.2)
Seriously
Injured
83.2
(2.8)
42.3
(2.7)
41.3
(2.8)
-
102.8
(2.6)
80.4
(2.5)
-
-
50.2 (2.7)
48.7
(2.7)
Slightly
Injured
62.9
(3.7)
71.5
(3.4)
138.3
(3.8)
85.8 (3.8)
41.4
(3.4)
147.5
(3.8)
42.9
(2.9)
36.0
(3.9)
85.8 (3.7)
113.7
(3.3)
Type of crash
Collision
66.6
(3.5)
58.6
(3.6)
96.2
(3.7)
81.7 (3.6)
30.9
(3.5)
124.7
(3.6)
79.3
(3.7)
38.4
(3.8)
84.7 (3.0)
141.1
(3.5)
Impact
35.5
(3.4)
82.1
(3.4)
72.9
(2.7)
86.7 (3.6)
26.5
(3.3)
71.1
(3.7)
105.7
(3.6)
-
73.0 (3.2)
180.4
(3.6)
Pedestrian
crash
51.9
(3.6)
105.8
(3.5)
40.3
(3.6)
108.7 (3.5)
58.8
(3.6)
117.4
(3.5)
41.7
(3.4)
27.2
(3.7)
62.8 (3.5)
149.6
(3.5)
Relative location
Straight
section
88.0
(3.7)
74.4
(3.7)
108.6
(3.8)
91.9 (3.7)
49.4
(3.6)
163.2
(3.7)
73.7
(3.7)
48.1
(3.6)
95.5 (3.6)
134.4
(3.6)
Curved
section
88.0
(3.8)
86.1
(4.0)
87.9
(3.9)
114.2 (4.1)
50.2
(3.8)
129.1
(3.8)
91.1
(3.9)
52.7
(4.0)
84.1 (3.5)
176.0
(3.8)
Intersection
with signage
106.2
(12.4)
132.5
(15.6)
122.3
(14.3)
128.5
(15.0)
80.8
(9.4)
169.9
(19.8)
108.3
(12.9)
41.0
(4.8)
136.7
(16.0)
216.5
(25.2)
Intersection
without
signage
88.5
(10.3)
53.3
(6.3)
151.2
(17.6)
83.2 (9.7)
84.2
(9.8)
88.8
(10.4)
46.7
(5.6)
84.6
(9.9)
84.6 (9.9)
117.3
(13.6)
Contributing factors
Imprudence
of driver
61.4
(3.4)
64.2
(3.6)
58.2
(3.3)
82.1 (3.4)
32.5
(3.4)
68.5
(3.4)
71.8
(3.7)
38.5
(3.4)
97.5 (3.2)
153.7
(3.1)
Imprudence
of pedestrian
96.0
(4.2)
98.0
(3.8)
104.1
(4.0)
103.1 (4.1)
50.7
(3.7)
142.1
(4.1)
75.0
(3.7)
43.3
(3.9)
86.3 (3.5)
187.1
(4.1)
Loss of
control
58.9
(3.9)
124.0
(4.2)
111.7
(3.8)
137.5 (3.7)
69.1
(4.2)
174.8
(4.2)
38.1
(3.8)
42.4
(4.4)
70.8 (4.0)
194.6
(4.2)
Driving
under
influence
alcohol
75.9
(3.7)
105.3
(3.7)
103.9
(3.6)
98.5 (3.6)
44.8
(3.5)
111.3
(3.7)
69.4
(3.7)
58.3
(3.6)
95.7 (3.5)
149.3
(3.5)
Other causes
74.3
(3.2)
59.9
(3.4)
122.3
(3.3)
76.5 (3.4)
92.4
(3.4)
93.4
(3.2)
109.4
(3.4)
32.0
(3.4)
67.2 (3.3)
62.8
(2.9)
Type of zone
Urban
-
-
-
-
-
-
-
-
57.0 (2.6)
-
Weather conditions
Sunny
96.2
(4.0)
98.1
(4.1)
71.9
(4.0)
84.6 (4.4)
78.7
(3.9)
161.8
(3.9)
72.9
(4.5)
52.5
(4.0)
94.7 (3.9)
133.5
(3.9)
Drizzly
113.3
(4.7)
122.5
(4.5)
136.0
(4.7)
133.4 (4.6)
74.6
(4.6)
171.5
(4.5)
104.0
(4.5)
65.5
(4.7)
129.0
(4.2)
235.8
(4.5)
Rainy
-
-
-
-
-
-
-
-
-
62.3
(2.3)
From a global perspective, the results indicate that
crash attributes associated with intersections with
traffic signals as a relative location, collisions, and
fatality outcomes are spatially autocorrelated for the
whole study period with the largest intensities among
the remaining analysed attributes. In addition, driving
under the influence of alcohol on drizzly days
strongly clustered during four years of the study
period.
The findings from the local spatial autocorrelation
technique revealed similarities and differences
among the communes. The communes with the
largest number of HH clusters are portrayed,
indicating the persistence and intensity of this
clustering for each group of crash attributes. In
particular, communes located in city of Santiago are
smaller in size and closer together, and present high
number of spatial clustering of motorcycle crashes. In
addition, the presence and persistence of HH spatial
VEHITS 2019 - 5th International Conference on Vehicle Technology and Intelligent Transport Systems
168

clusters of crash attributes in the communes located
in the Region of Valparaiso, Metropolitan Region,
Region of O´Higgins, and Region of Maule are
particularly distinguished.
Overall, a large number of HH clusters of
collisions due to the loss of control are present on
sunny days in the aforementioned regions. Most
motorcycle crashes also tended to spatially cluster
along straight and curved road segments. Drivers tend
to increase their travel speeds as straight road sections
are encountered, which may increase the likelihood of
causing crashes with serious outcomes. Motorcyclists
are more prone to crashes at curves, which may
generate a significant impact on crash severity or
fatality, as shown in Chung and Song (2018).
There is a considerable increase in the use of
motorcycles nationwide in the last few years,
particularly in the centre part of Chile. However, the
number of motorcycle crashes has also presented a
dramatic increase. Future research should prioritize
those communes with high clustering of motorcycle
crashes, in order to implement specific interventions
that help improve traffic safety.
The Road Coexistence Law became effective in
November of 2018 with the aim of equating road
spaces and imposing an equality among all transport
modes (motorised vehicles, bicycles, pedestrians,
etc.). This law enforces road users to become aware
of their rights and obligations when travelling, and
thus, increasing road safety. Further investigation is
required to analyse the impact of this law in the traffic
crashes that involve motorcycles.
REFERENCES
Aghajani, M., Dezfoulian, R., Arjroody, A., Rezaei, M.,
2017. Applying GIS to identify the spatial and temporal
patterns of road accidents using spatial statistics (case
study: Ilam Province, Iran). Transportation Research
Procedia, 25:2126-2138.
Asociación Nacional de Importadores de Motocicletas,
ANIM, 2015. Actualidad del mercado en Mundo Motos
2016 http://www.anim.cl/httpwww-anim-clp1820/
(Accessed on September 22, 2018)
Anselin, L., 1995. Local indicators of spatial association-
LISA. Geographical Analysis, 27: 93–115.
Blazquez, C. and Celis, M., 2013. A Spatial and Temporal
Analysis of Child Pedestrian Crashes in Santiago,
Chile. Accident Analysis & Prevention, 50:304-311.
Blazquez, C., Puelma, I. and Khan, G., 2015. Spatial
Analysis of Bicycle Crashes in Chile. In Proceedings
18th IEEE International Conference on Intelligent
Transportation Systems, Las Palmas de Gran Canaria,
Spain, 2745-2750.
Blazquez, C., Lee, J. S., and Zegras, C., 2016. Children at
Risk: An Initial Comparison of Child Pedestrian Traffic
Collisions in Santiago, Chile and Seoul, South Korea.
Traffic Injury Prevention, 17(3):304-312.
Blazquez, C., Picarte, B., Calderon, J.F., and Losada, F.,
2018. Spatial Autocorrelation Analysis of Cargo Trucks
on Highway Crashes in Chile. Accident Analysis &
Prevention, 120:195-210.
Chung, Y., and Song, T-J, 2018. Safety analysis of
motorcycle crashes in Seoul metropolitan area, South
Korea: An application of nonlinear optimal scaling
methods. International Journal of Environmental
Research and Public Health, 15(12):2702.
CONASET, 2016. Siniestros de Tránsito de ocupantes de
motocicletas y consecuencias. https://www.conaset.cl/
programa/observatorio-datos-estadistica/biblioteca-
observatorio/informes-tematicos/#motocicletas
(Accessed on Abril 13, 2018)
Das, S., Dutta, A., Dixon, K., Minjares-Kyle, L., and
Gillette, G., 2018. Using deep learning in severity
analysis of at-fault motorcycle rider crashes. Journal of
Transportation Research Board, In press.
Dezman, Z., de Andrade, L., Vissoci, J., El-Gabri, D.,
Johnson, A., Hirshon, J., and Staton, C., 2016. Hotspots
and causes of motor vehicle crashes in Baltimore,
Maryland: A geospatial analysis of five years of police
crash and census data. Injury, 47(11):2450-2458.
Flask, T., Schneider, W., and Lord, D., 2014. A segment
level analysis of multi-vehicle motorcycle crashes in
Ohio using Bayesian multi-level mixed effects models.
Safety Science, 66:47-53.
Instituto Nacional de Estadística, INE, 2016. Anuario
Estadísticas vitales. http://www.ine.cl/estadisticas/
demograficas-y-vitales (Accessed on July 31st, 2018)
Instituto Nacional de Estadística, INE, 2017. Censo
https://www.censo2017.cl/ (Accessed on April 15,
2018)
International Traffic Safety Data and Analysis Group,
IRTAD, 2017. Road Safety Annual Report. https://
www.oecd-ilibrary.org/transport/road-safety-annual-
report-2017_irtad-2017-en (Accessed on July 31, 2018)
Jalayer, M., and Zhou, H., 2016. A multiple correspondence
analysis of at-fault motorcycle-involved crashes in
Alabama. Journal of Advanced Transportation, 50:
2089-2099.
Lee, J., Yasmin, S., Eluru, N., Abdel-Aty, M., and Cai, Q.,
2018. Analysis of crash proportion by vehicle type at
trac analysis zone level: A mixed fractional split
multinomial logit modeling approach with spatial
eect. Accident Analysis and Prevention, 111: 12-22.
Manepalli, U., Bham, G., Kandada, S., 2011. Evaluation of
hot spots identification using Kernel Density
Estimation (K) and Getis-Ord (Gi*) on I-630. In
Proceedings 3
rd
International Conference on Road
Safety and Simulation 17.
Mitra, S., 2009. Spatial autocorrelation and bayesian spatial
statistical method for analysing intersections prone to
injury crashes. Journal of Transportation Research
Board, 2136: 92–100
Global and Local Spatial Autocorrelation of Motorcycle Crashes in Chile
169

Meng, Q., 2016. The spatiotemporal characteristics of
environmental hazards caused by offshore oil and gas
operations in the Gulf of Mexico. Science of the Total
Environment, 565: 663-671.
MT Motores, 2016. Espacial Mercado de motos en Chile.
Diario La Tercera, https://www.pressreader.com/chile/
la-tercera-mt-motores/20160930/281505045711190
(Accessed October 2, 2018)
Pour, A., Moridpour, S., Tay, R., Rajabifard, A., 2018.
Influence of pedestrian age and gender on spatial and
temporal distribution of pedestrian crashes. Traffic
Injury Prevention, 19(1): 81-87.
National Highway Traffic Safety Administratio, NHTSA,
2012. Traffic Safety Facts. https://crashstats.nhtsa.
dot.gov/Api/Public/ViewPublication/812016
(Accessed on November 10, 2018)
Soltani, A., and Askari, S., 2017. Exploring spatial
autocorrelation of traffic crashes based on severity.
Injury, 48(3): 637-647.
World Health Organization, WHO, 2015. Global status
report on road safety. https://www.who.int/
violence_injury_prevention/road_safety_status/2015/
GSRRS2015_Summary_EN_final2.pdf (Accessed
September 30, 2018).
VEHITS 2019 - 5th International Conference on Vehicle Technology and Intelligent Transport Systems
170
