
Indicators for Self-assessment of Human Practices in Homes
Manar Amayri
1
, Helene Haller
2
, Stephane Ploix
3
, Frederic Wurtz
4
and Gilles Debizet
5
1
Grenoble Institute of Technology, G-SCOP, France
2
Pacte, Laboratoire de Sciences Socaies, France
3
Grenoble Institute of Technology, G2ELab, France
Keywords:
Building Performance, Energy, Human Behavior, Indicators.
Abstract:
Usage indicators are proposed in smart buildings in order to analyze occupant behavior towards energy usage.
Indicators are a means of communication to interact with occupants of a living area so they can make informed
decisions regarding their everyday customs and uses. Through them, occupants will be able to compare and
challenge themselves with others or with their past results. Moreover, occupants will be able to understand
the consequences and effects of their energy behavior and learn how to improve it without degrading their
comfort. Heat flow through door/window indicators (heat losses), and dishwasher indicator have been cal-
culated and discussed in an apartment context. There were 70 heterogeneous sensors previously installed to
gather the information needed. These indicators have been evaluated by considering three conditions: mea-
surable/calculable, understandable and comparable/challengeable between different houses or users. Studying
and measuring different indicators give a sort of energy performance of a building, which in turn helps to
improve automated building management tools.
1 INTRODUCTION
The residential sector is playing an essential role in
the context of overall energy consumption. Indeed,
the limit is not certain but the amount of energy us-
age can be minimized up to a certain extent so as to
balance the energy flow. Hence, it can be said that the
energy efficiency is an important challenge in today’s
area of building and automation system, but how one
can minimize the energy consumption and how hu-
man behavior plays a vital role in regards to the en-
ergy consumption of the living area?
Today, there are numerous services and tools
available which provide the exact information about
the amount of energy being used by any particular
appliance or service in a living area. However, the
biggest questions coming out of those statistics is that:
whether one can improve energy efficiency using less
energy for the same service or not. How human be-
havior is playing a vital role considering the main fo-
cus is to reduce the overall energy consumption while
keeping the comfort level.
Energy savings depend on the conscious action of
the inhabitants, which is not likely to be constant over
time. Thus, lots of work have been focused on de-
veloping energy intelligent buildings by integrating
occupant activity and behavior as a key element for
building management systems with which the build-
ings can automatically save energy. For this purpose,
indicators are an important part to help to build bet-
ter automation building management tools but also to
show a visual use of energy performance to the in-
habitants coming from their own daily behavior on
the building. In order to understand the energy Us-
age and act in accordance with that, some indicators
are required, which can estimate the cause and ef-
fect of the particular action in regards to the overall
energy consumption.They aimed at synthesizing sev-
eral data, which occupants would not be able to un-
derstand separately and make it intelligible. Indica-
tors are divided or categorize depending on what they
measure, there are: (1) technical indicator: showing
the performance of the building, (2) usage indicators:
showing the amount of energy used or wasted, which
is directly or indirectly related to occupant’s actions
on a daily basis (cost is also included here). Another
type of indicator is (3) comfort indicators: like ther-
mal or air quality comfort. They show how the ac-
tions of the occupants affect the comfort levels inside
the house or building.
This paper tackles this issue by proposing and an-
alyzing some usage and comfort indicators. Section 2
presents a state of the art about indicators and building
performance. Section 3 deals with energy consump-
tion practices factors. Section 4 proposed different
indicators. Section 5 focuses on data collection and
116
Amayri, M., Haller, H., Ploix, S., Wurtz, F. and Debizet, G.
Indicators for Self-assessment of Human Practices in Homes.
DOI: 10.5220/0007716801160122
In Proceedings of the 8th International Conference on Smart Cities and Green ICT Systems (SMARTGREENS 2019), pages 116-122
ISBN: 978-989-758-373-5
Copyright
c
2019 by SCITEPRESS – Science and Technology Publications, Lda. All rights reserved

apartment case study. Section 6 results of heat flow
and dishwasher indicators.
2 STATE OF THE ART
Following the electricity trends and the design of the
new smart buildings, several solutions were devel-
oped in regards to saving the energy consumption in-
side a building. (Nguyen, 2013a) concluded that
there is a possibility of 58% saving on energy for
lighting and 10-40% for HVAC system. Some other
studies like (Georgievski and Degeler, 2012) which
were conducted in the commercial sector showed an
average economic saving of about 35% by presenting
an approach based on measuring energy consumption
on individual user activity and service.
Some appliances and services are very dynamic
and uncontrollable, (Nguyen, 2013b) illustrates the
different application of information feedback method
in order to save energy consumption in a living
area. He presented the findings of a UK based field
study involving 44 households considering domestic
cooking: he compares the effectiveness of provid-
ing paper-based energy-use/saving information with
electronic feedback of energy-consumption via ECIs
(Energy Consumption Indicators) designed specifi-
cally for this investigation. Twelve Control Group
households were monitored for a period of at least
12 months and it revealed an average daily consump-
tion for electric cooking of 1.30 kWh. Subsequently
across a minimum monitoring period of 2 months, 14
out of 44 households achieved energy savings greater
than 10% and six of these achieved savings of greater
than 20%. The average reduction for households em-
ploying an ECI was 15%, whereas that given an-
tecedent information alone reduced their electricity
consumption, on average, by only 3%. The associ-
ated behavioral changes and the importance of pro-
viding regular feedback during use were identified by
them. The study (ref, 2017) illustrates that build-
ing energy use is mainly influenced by different fac-
tors: climate, building structure, building services and
energy systems, building operation and maintenance,
occupants’ activities and behavior, and indoor envi-
ronmental quality. Among these factors, the last three
ones are human-related factors which can have an in-
fluence as significant as the first three.
In (M. G. Ellis and Gigawatts, 2009) represent
that now most new appliances have designed to uti-
lize up to 40% less electricity which is not quite
enough to insert them into the class of smart appli-
ances. One feature of smart appliances is that they
are designed to be able to measure their own power
consumptions and it uses this data to conserve elec-
tricity and money, in addition being programmable.
However, there are some home automation solutions
available to use wireless technology, as well as ex-
isting wiring’s home to be connected and automated
appliances.
The road toward energy efficiency is reached, in
part, with the implementation of the smart appliances
and smart meters, and the need of indicators become
somewhat very important to collect and give form to
all human behaviors which directly or indirectly affect
the usage of the energy. Indicators play a big role to
reach the European Union target of 2020 (ref, 2018a).
Knowing all the details about the energy consumption
is not always enough, to make sure that the occupant
is going to reduce energy consumption. Therefore, it
is also required to make a link between all the waste
towards the occupant behavior and represent it in such
a way that an occupant can understand it and act in
accordance with. The study of this paperwork to in-
volve the idea of such an indicator and a way how
can a better indicator be designed keeping more prag-
matic towards the occupant approach as a sustainable
solution.
3 ENERGY CONSUMPTION
PRACTICES FACTORS
Human behaviors regarding energy consumption are
complex but it is possible to grasp some factors about
energy consumption behaviors and how to change be-
haviors on a long-term basis. First, people often act
differently as they say they will, but they feel some
discomfort from this situation. It is called “cogni-
tive dissonance” (L, 1957). People also tend to sus-
tain their behavioral changes when they get commit-
ted in public. The induced hypocrisy paradigm (Is-
abella Gaetani, 2010) is based on these observations:
the mechanism aims to artificially recreate a cogni-
tive dissonance situation. Once a person gets com-
mitted, it is important to recall his commitment every
time it is transgressed. The work in (Isabella Gae-
tani, 2010) also underlines the importance of belong-
ing to a group, i.e. a community. Besides, people
are reluctant to change. Imposing a change to peo-
ple is badly abided. To get a change in a behav-
ior, you have to obtain the will of people and make
them feel like nothing is demanded (Isabella Gae-
tani, 2010). In other words, you have to find a way to
involve them in decision making. Moreover, under-
standing the nature of practices is a way to make sure
that the changes will be sustainable. Practices are at
the junctions of three elements: a meaning, a material
Indicators for Self-assessment of Human Practices in Homes
117

dimension and some competences (Shove E., 2012).
Changing a practice should take simultaneously into
account these three elements. Therefore, the creation
of indicators must rely on a meaning shared with the
users, being supported by a device or an application
easily understandable and useable, and they must not
require expertise on energy efficiency because it can’t
be assumed that targeted users of indicators know a lot
about energy. In addition, energy consumption prac-
tices respond to “logic of action”, i.e. all the actions
carried out to achieve an ideal. This ideal is based on
some sociological norms and values. Several logic ac-
tions have been identified to highlight the interactions
between a device (which goal is energy efficiency)
and an user (S, 2015). They can be easily transposed
to the creation of an indicator:
• comfort at home
• seek for fun in the use of technologies
• desire to control the housing and life
• interest for every element related to energy
• economical behavior
• ecological behavior
But energy efficiency is not a goal that only con-
cerns inhabitants. In fact, this problem affects differ-
ent publics: consumers of course, but also citizens,
energy operators, local authorities. These different
publics do not meet the same goals. Indicators must
embrace this complexity to be more accurate. Feed-
back must be taken into account as another dimension
related indicators requirement. Delivering informa-
tion about energy consumption is not enough to lead
to behavior changes. Consumers need accurate infor-
mation to understand how they consume. Two ques-
tions arise from this assessment:
• what should be the temporality covered by feed-
backs?
• what should be the spatiality covered by feed-
backs?
These questions are dealing with the rapidity
and precision for information delivery about energy
consumption to obtain commitment and long-term
changes.
Firstly, indicators should provoke desire to act, by
mobilizing social norms and values that guide the en-
ergy behaviors of users. Secondly, users must have
the capacity to react to the messages delivered by the
indicators. As a consequence, energy efficient appli-
ances linked to sensors and indicators have to be easy
to use. Thirdly, delivered messages by the indicators
have to be understandable by non-expert users.
Regarding the temporality, it depends on the na-
ture of the indicator itself and the glimpse the user
would like to get. It can go from one second to one
year. Regarding the spatiality, it has been underlined
earlier the importance of being part of a group to
achieve a sustainable change. That’s why it is also
recommended to develop meaningful and shareable
indicators. Using comparison can help people to po-
sition themselves and strengthen their commitment.
From the energy point of view, the evolution of smart
grid to the smart meter and smart appliances there are
many ways to measure the consumption of electric-
ity, with the help of these measurements, more new
challenges come into consideration.
4 PROPOSED USAGE
INDICATORS
Improvements in the energy performance of a build-
ing cannot be achieved at the expense of the comfort
of building occupants. Consequently, it is necessary
to measure the comfort levels within the building in
order to ensure that primarily the occupants of a build-
ing are comfortable and also to ensure that all legal
requirements related to comfort are satisfied. Thus,
these indicators are designed to inform both building
managers and building users on the impact of their be-
havior on the performance of the building. Below are
the proposed indicators related to usage.
4.1 Heat-flow Indicator
This indicator is a usage indicator for the energy
loss (turn on the heater/air conditioner, open/close a
door/window). The first step is to link this indicator
with the occupant’s actions in the house. What are
the actions responsible for the loss of heat produced
in the house, and what actions must be taken in order
to avoid it and have a good indicator of reading?
4.1.1 Heat-flow Indicator through the Window
In a room, there are 2 main ways for the heat to be
wasted, through the window or through the door. Be-
fore calculating heat flow indicator through these 2
factors, there are 3 conditions that must be met to be
a waste:
1. heater or air conditioning systems must be on.
2. window must be opened during the calculation
time.
3. CO2 concentration should be below 1000 ppm, as
stated in (ref, 1969) (if the CO2 levels are higher
SMARTGREENS 2019 - 8th International Conference on Smart Cities and Green ICT Systems
118

than the calculation of heat loss is not done that
because opening the window was necessary to
freshen the air quality)
Finally, the indicator is calculated as a difference
in temperature between outdoor and indoor tempera-
ture. (i.e. number of waste degrees) The proposal for-
mula of the algorithm is presented as such equation
1:
Z
pos(T
in
− T
out
)window
position
threshold
(co
2
)dtheater
status
(1)
This formula is for calculation of heat flow during
winter, when there is positive heat flow through the
window to outdoor when it is too cold outdoors. Vice
versa during summer the calculation is done when
there is positive heat flow through the window from
outdoor when it is too hot outdoor, equation 2.
Z
pos(T
in
− T
out
)window
position
threshold(co
2
)dtconditioner
status
(2)
4.1.2 Heat-flow Indicator through the Door
Heat-flow though the door is the same as the one for
the window with the only exceptions being the posi-
tion of the door opening and the heat flows not outside
but on the corridor, equation 3 and equation 4.
Z
pos(T
in
− T
corridor
)door position
threshold(co
2
)dtheater
status
(3)
Z
pos(T
in
− T
corridor
)door position
threshold(co
2
)dconditioner
status
(4)
Thus, this indicator provides data on the differ-
ence in interior and corridor temperatures for time pe-
riods, where the door should be opened.
1. heater must be ON, otherwise, there is no energy
lost from heating.
2. window must be opened during the calculation
time.
4.2 Dishwasher Machine Indicators
Since appliances are responsible for around 20% of
the total energy consumption (ref, 2018b), it makes
sense that the usage of these appliances should be
focused. The first step is to link their consump-
tion with the occupant’s interaction with these appli-
ances. Dishwasher machine data has been investi-
gated, where two indicators have been extracted from
their recorded power consumption:
1. dishwasher machine average consumption during
each cycle.
2. number of cycles (daily, weekly,....).
5 RESULTS
5.1 Apartment Case Study
A residential apartment in Grenoble, France has been
investigated, which is considered as a multi-zone ap-
plication with lots of sensors and different activities.
The setup for the sensor network includes 70 sensors:
• temperature sensor in each room.
• motion sensor in each room.
• windows contact sensor in each room.
• doors contact sensor in each room.
• power consumption sensors in the kitchen (i.e,
dishwasher, clothwasher, ...).
• appliances power consumption sensors in each
room.
• humidity sensor in each room.
• uminosity sensor in each room.
It consists of two bedrooms, a common room, a
kitchen, an office, a separate bathroom, and toilets.
The doors and windows are equipped with contact
sensors providing binary numbers related to the state
of the doors or windows i.e. 1 for open and 0 for
closed. Only the contact sensors give values as binary
state whereas the rest of the sensors measure their re-
spective variables to the extent of the intensity i.e. the
luminosity in the kitchen.
• washing machine average consumption for each
machine cycle (for all users or per user) indicator.
• dishwasher machine average consumption for
each machine cycle (for all users or per user) in-
dicator, where a cycle is a one working phase of
the dishwasher machine.
• a number of cycles indicator (i.e washing ma-
chine, dishwasher machine...).
• heat float(loss of heat) through a door/window in-
dicator.
• CO2 average concentration indicator.
• comfort ICONE indicator.
• fridge usage indicator.
In this paper the discussion is focused on two types of
indicators:
Indicators for Self-assessment of Human Practices in Homes
119
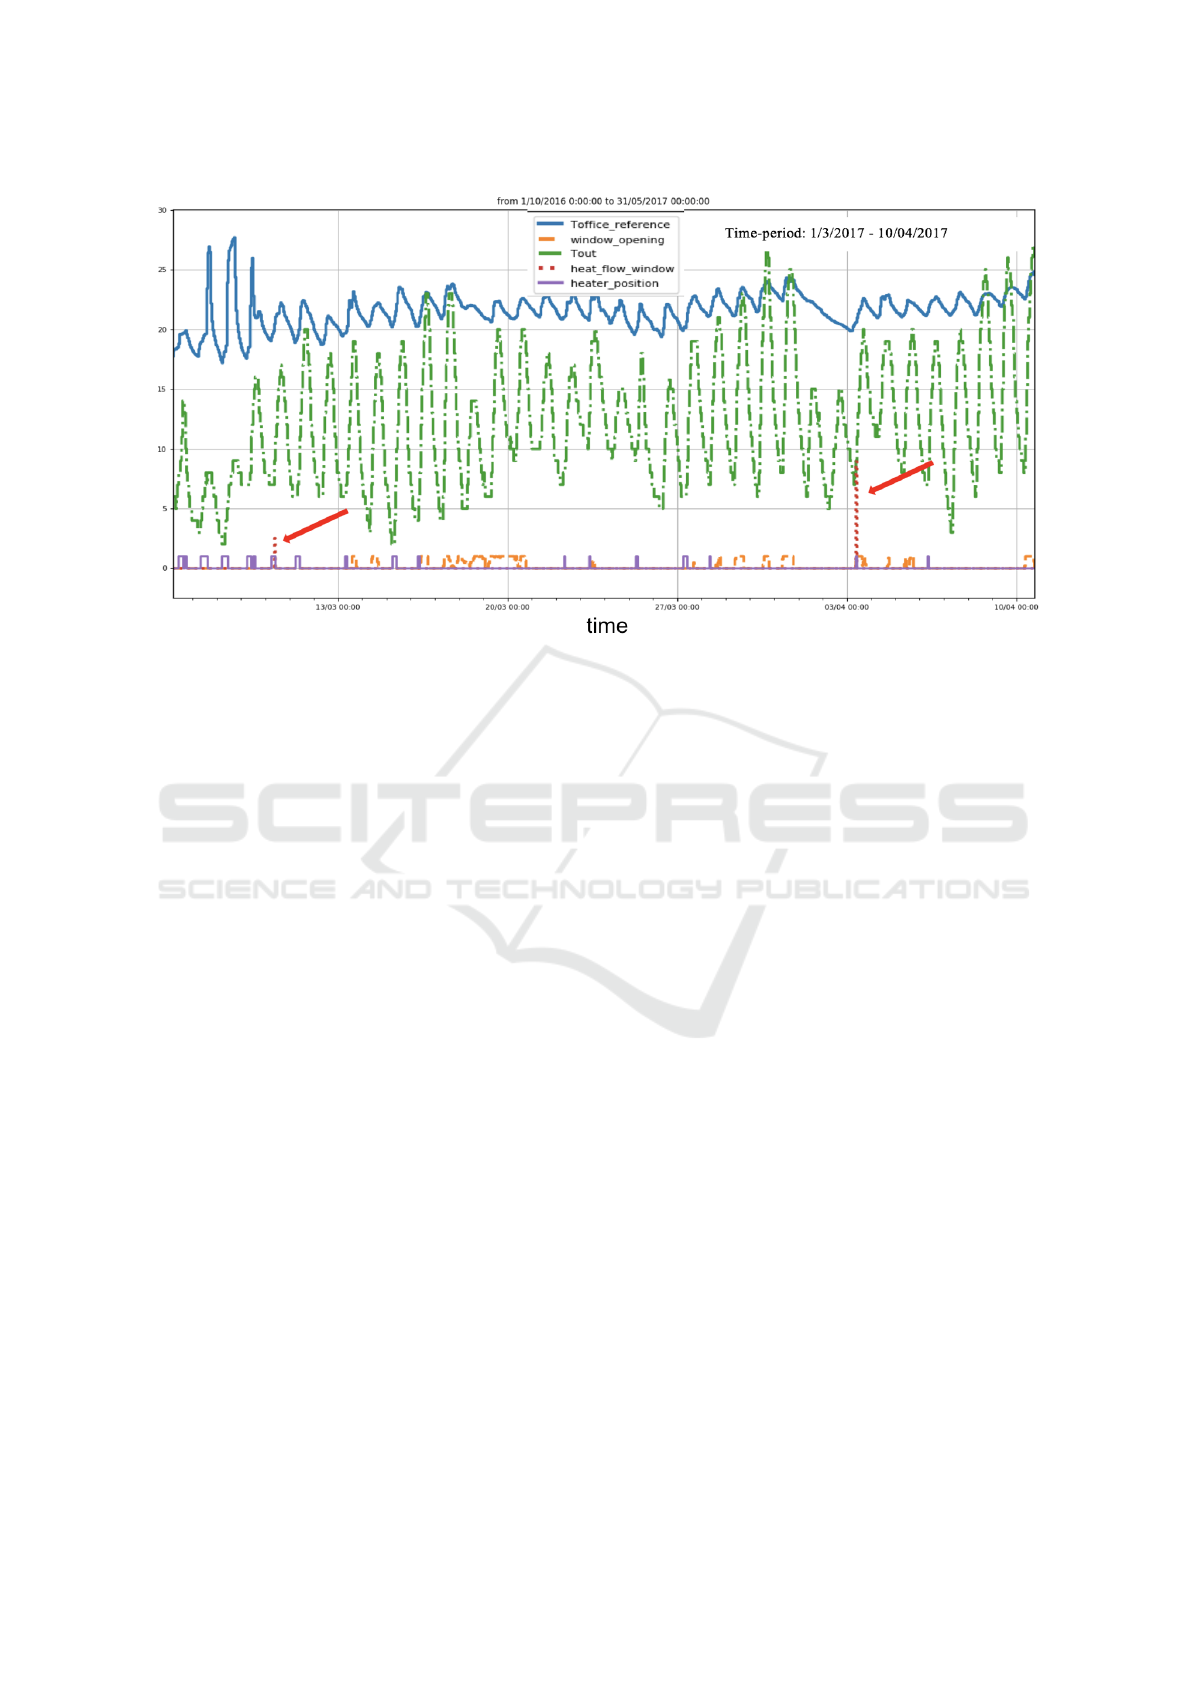
Figure 1: Heat flow through window, overview of temperature differencesy.
1. heat-flow indicator (through door/window).
2. dishwasher indicators.
The data coming from the sensors was recorded and
monitored from December 2015 to August 2017 in
the apartment case study, one room is chosen to do
the experiment of indicator calculation (office room).
Fig. 1 presents the heat flow indicator in one room
through the window. The blue curve is the indoor tem-
perature, the green is the outdoor one, and in red is the
indicator. Only in 2 instances, there has been a heat
loss or a flow of heat from indoor to outdoor for this
case, which show a good behavior of the user. Fig.
2 presents the heat flow through the door, a different
story can be seen. During the whole winter, there is a
lot of heat flow from the room to the corridor (green
curve), where the door openings. In this case, the dif-
ference between room and corridor temperatures are
highly affected by the heat flow.
Following the objective of indicator design, for
heat flow indicators they can be got 2 pluses for 2
criteria, namely understandable and comparable, but
only one plus for the measurable criteria. The reason
for this is because even though it is very easy to Cal-
culate, the information needed (i.e. reading window
and door openings), it’s not common to be installed in
every house or building. But for the other 2 criteria, it
is easily understandable and comparable.
• measurable/ calculable + (1 plus)
• understandable ++ (2 pluses)
• comparable/ challengeable ++ (2 pluses)
Fig. 3 shows the weekly consumption of the dish-
washer machine for 3 different houses, this value will
be more interesting for the end user if it is presented
as average consumption each cycle (see Fig. 4(b)).
In order to compare the usage from different dish-
washer machines, we must link their usage with a
user’s activity, in this case, the number of cycles used
during the week on average. (see Fig. 4(a)) shows
the number of cycles each week for three different
houses A similar conclusion can be done for this in-
dicator, they are easily measurable and calculable, as
well as comparable with different houses. The con-
sumption of the appliances is directly linked with the
number of cycles, which can give the user a simple
and motivated way to be in challenged and to compare
with other users. For example, some challenges can
appear between the greenhouse and the orange one.
Both houses have almost the same number of cycles
(Fig. 4(a)), but the greenhouse has less consumption
compared with the orange one (Fig. 4(a)).
• measurable/ Calculable + (1 plus)
• understandable + + (2 pluses)
• comparable/ Challengeable ++ (2 pluses)
6 CONCLUSION AND FUTURE
WORK
Usage indicators have been discussed in this paper.
Indicators are variables characterized by their values
with a significant representation. Indeed, they aimed
SMARTGREENS 2019 - 8th International Conference on Smart Cities and Green ICT Systems
120
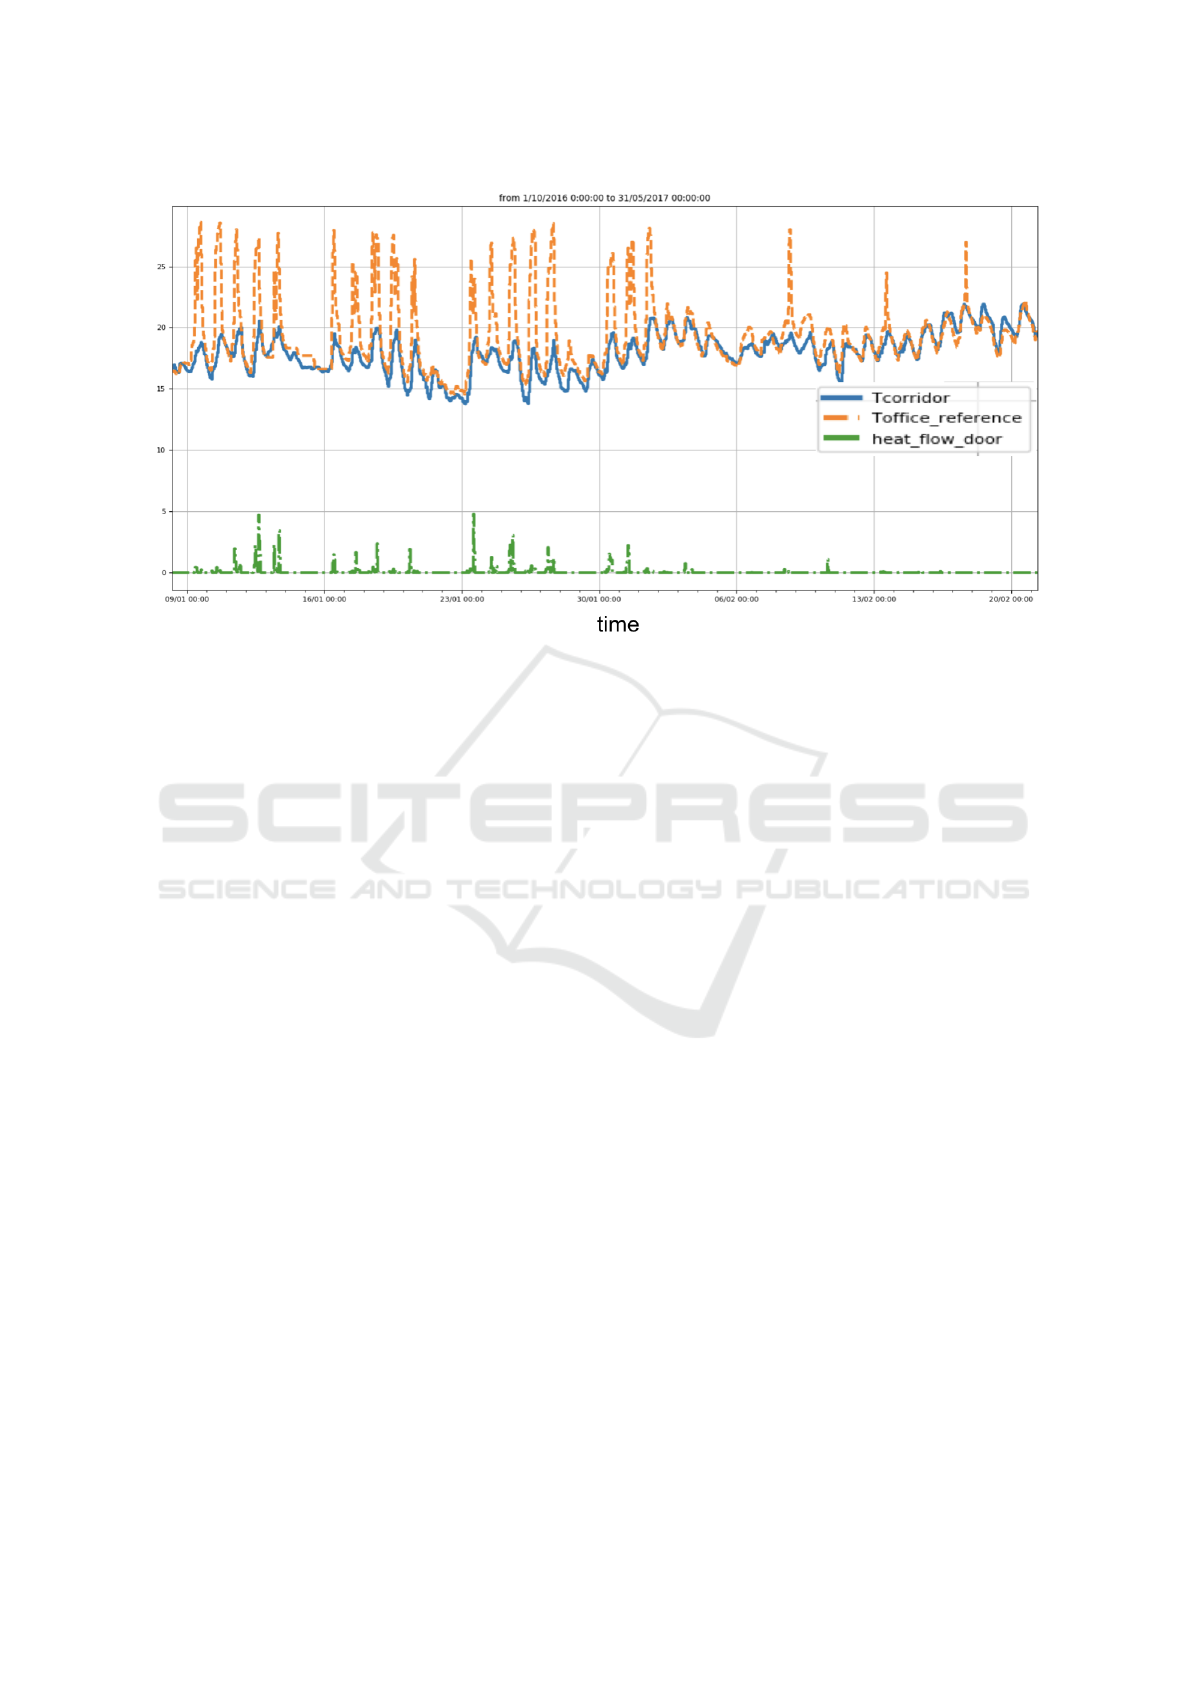
Figure 2: Heat flow through door, an overview of temperature differences.
to synthesize different information which occupants
would not be able to understand separately and make
it intelligible.
Among different proposed usage indicators, two
have been discussed in this paper, heat flow through
door/window, and dishwasher indicator, all showed a
quite good presentation to the end user according to 3
criteria: measurable, understandable and comparable
between different houses or users.
Depending on the responsibility of the occupants
in a house, and regarding the openings and closings of
the window or door, it was easy to measure and link
behavior with the loss of heating as a result. This us-
age indicator (called Heat-flow indicator) shows good
results, it is very understandable and comparable and
can be applied with ease to different house settings.
Continuous work can also be done in identify-
ing and designing new indicators as well. Probably,
identifying new user’s activities or even linking dif-
ferent indicators with each other. More indicators are
however required especially indicators related to the
use of high energy consuming appliances and comfort
levels within a building. These are especially neces-
sary in order to avoid achieving high energy perfor-
mance at the expense of the comfort of building occu-
pants.
In terms of the future scope of this research, it
would be very interesting to make a small-scale exper-
iment with some experimental reference values, just
to know if it can work for the occupants keeping the
level of comfort constant. A survey could also be very
interesting to investigate or judge the user on the basis
of reference values. Further, in order to know the effi-
ciency and feasibility of the proposed indicator a large
scale experimentation could also be done referring to
it as magic to save the energy.
Develop a graphical user interface solution for
better presenting the indicators to the end user. Fi-
nally, an important point should be investigated and
develop the experimental evaluation. There is a lack
of methodological guidance in the information visu-
alization literature on how to do so. The problem is
two-fold: (1) objective measures are not enough to
capture the quality of a decision, given that “finding a
good compromise” is by essence, subjective. Subjec-
tive measures such as self- reported satisfaction are
useful but may be unreliable. (2) there is a lack of
clear references for identifying an appropriate base-
line for comparative assessment.
ACKNOWLEDGMENT
This work is supported by the French National Re-
search Agency in the framework of the ” Investisse-
ments d'avenir” program (ANR-15-IDEX-02)( IN-
VOVED and Eco-SESA, Comepos projects).
REFERENCES
(1969). Arr
ˆ
ete du 22 octobre 1969 relatif
`
a l’aeration des
logements.
Indicators for Self-assessment of Human Practices in Homes
121
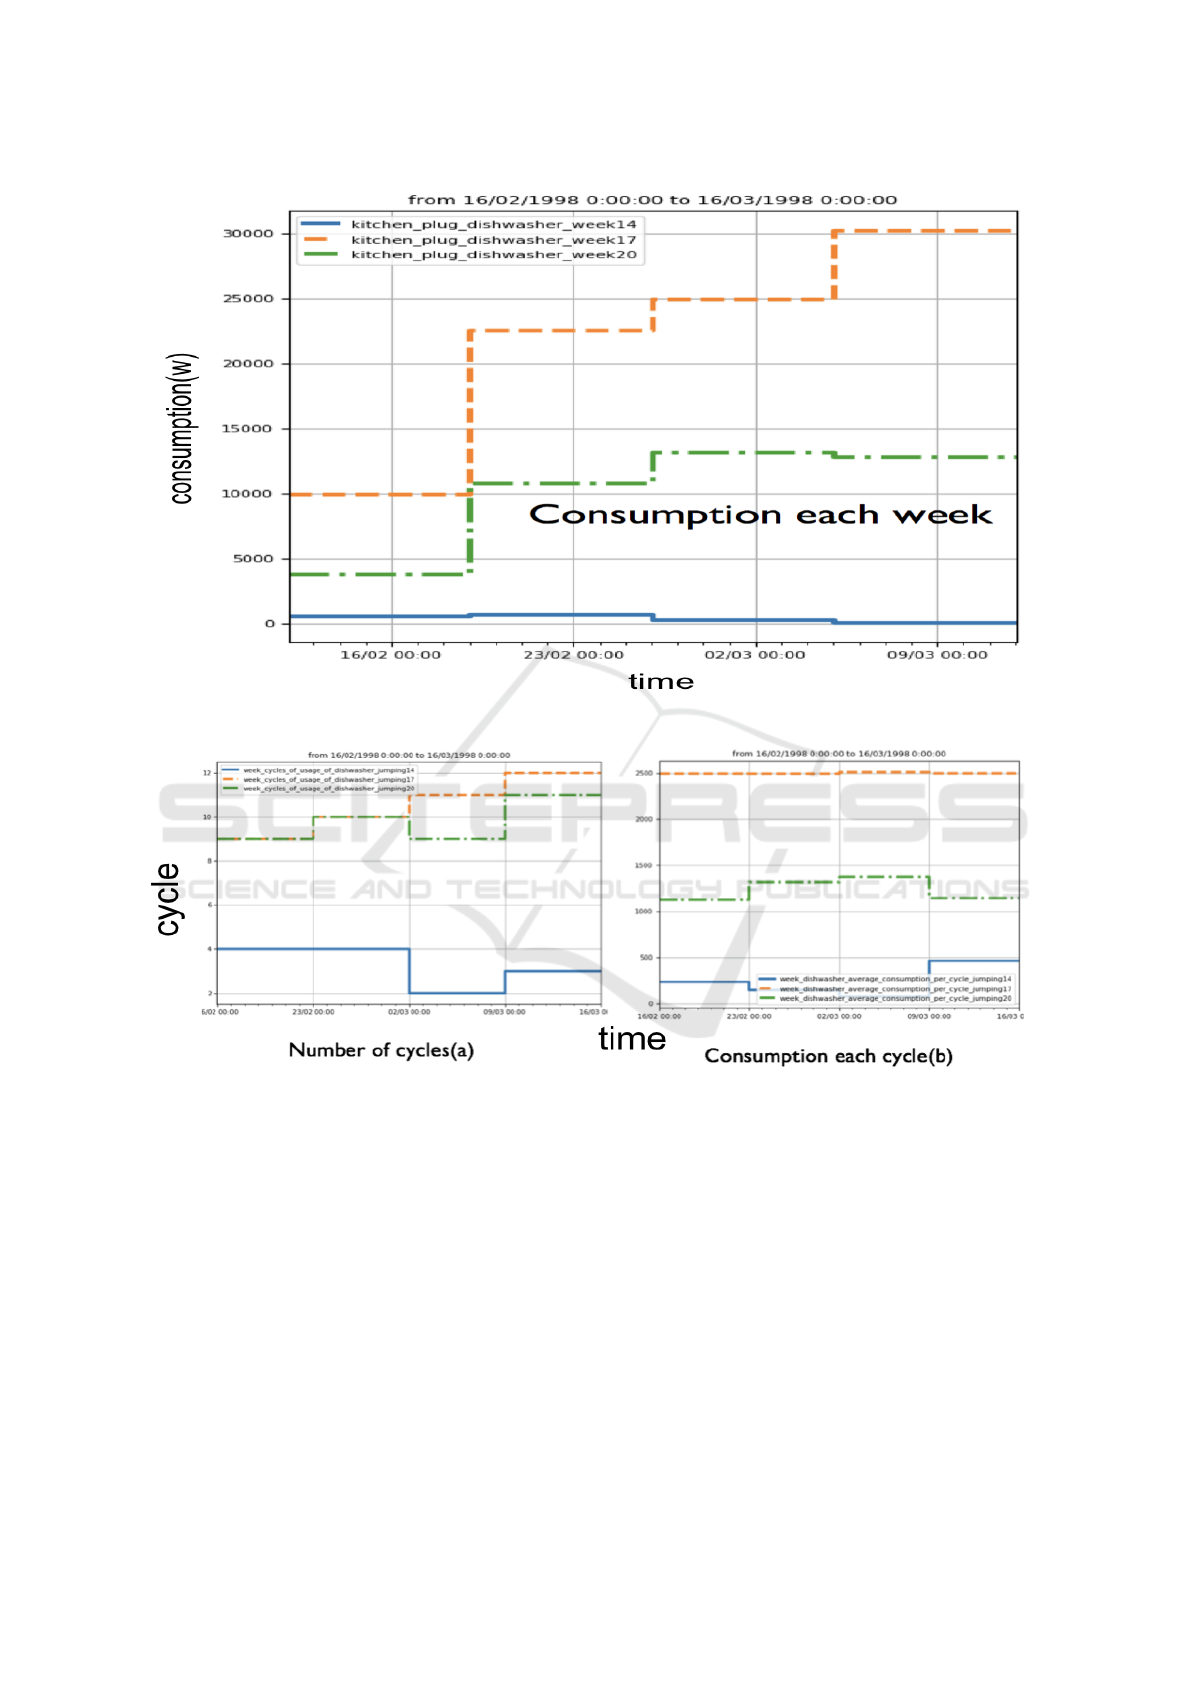
Figure 3: Different dishwasher machine’s consumption.
Figure 4: Number of cycles (a) and Consumption each cycle (b).
(2017). Eco-sesa, univ. grenoble alpes,[online]. available:.
http://www.buildup.eu/en/node/54657.
(2018b). https://deepresource.wordpress.com/2017/10/03/iea-
webinar-energy-efficiency-indicators/. [accessed.
(Accessed 2018a). ”european union:
https://europa.eu/european-union/topics/energy-en.
pages 212–241.
Georgievski, I. and Degeler, V. (2012). Optimizing energy
costs for offices connected to the smart grid. IEEE
Transactions on Smart Grid, vol. 3, no. 4, pp. 2273-
2285,.
Isabella Gaetani, Pieter Jan Hoes, J. L. H. (2010). 6
`
eme,
Paris, Presses Universitaires de France, 224 p.
L, F. (1957). A theory of cognitive dissonance, stanford,
stanford university press.
M. G. Ellis, G. and Gigawatts (2009). Policies for en-
ergy efficient electronics. paris : International Energy
Agency.
Nguyen, T. A. (2013a). Energy intelligent buildings based
on user activity. A survey. Groningen, Neetherland:
Energy and Buildings.
Nguyen, T. A. (2013b). Energy intelligent buildings based
on user activity. Energy and Buildings.
S, L. B. (2015). Reflexions sur l’engagement energe-
tique: vers des profils energetiques?. Les societes con-
temporaines
`
a l’epreuve des transitions energetiques,
p. 320-323.
Shove E., Pantzar M., W. M. (2012). The dynamics of social
practice: Everyday life and how it changes. Londres,
SAGE Publications Ltd, 208 p.
SMARTGREENS 2019 - 8th International Conference on Smart Cities and Green ICT Systems
122
