
An Iterated Local Search Algorithm for Cell Nuclei Detection from Pap
Smear Images
D
´
ebora N. Diniz
1
, Marcone J. F. Souza
1
, Claudia M. Carneiro
2
, Daniela M. Ushizima
3
,
F
´
atima N. S. de Medeiros Sombra
4
, Paulo H. C. Oliveira
1
and Andrea G. C. Bianchi
1
1
Instituto de Ci
ˆ
encias Exatas e Biol
´
ogicas, Programa de P
´
os-graduac¸
˜
ao em Ci
ˆ
encia da Computac¸
˜
ao,
Universidade Federal de Ouro Preto, Ouro Preto, Brazil
2
N
´
ucleo de Pesquisa em Ci
ˆ
encias Biol
´
ogicas, Programa de P
´
os-graduac¸
˜
ao em Biotecnologia,
Universidade Federal de Ouro Preto, Ouro Preto, Brazil
3
Berkeley Institute for Data Science, University of California and Lawrence Berkeley National Laboratory,
Berkeley, California
4
Teleinformatics Engineering Department, Federal University of Cear
´
a, Fortaleza, Brazil
paulocalaes@gmail.com, andrea@ufop.edu.br
Keywords:
Nuclei Segmentation, Cervical Cells, Iterated Local Search, Meta-heuristic, Pap Smear Images Analysis.
Abstract:
In this work, we propose an Iterated Local Search (ILS) approach to detect cervical cell nuclei from digitized
Pap smear slides. The problem consists in finding the best values for the parameters to identify where the cell
nuclei are located in the image. This is an important step in building a computational tool to help pathologists
to identify cell alterations from Pap tests. Our approach is evaluated by using the ISBI Overlapping Cervical
Cytology Image Segmentation Challenge (2014) database, which has 945 synthetic images and their respect-
ive ground truth. The precision achieved by the proposed heuristic approach is among the best ones in the
literature; however, the recall still needs improvement.
1 INTRODUCTION
According to the World Health Organization (WHO),
14.1 million new cases of cancer are diagnosed every
year worldwide. In addition, an estimate is that this
is the cause of 13% of all deaths in the world per
year, which corresponds to 8.2 million people. WHO
also reports that, according to the scientists, a number
of cancer cases increase 70% in the coming decades,
reaching 21.4 million in 2032.
The Pap smear is a screening test performed
to detect alterations in cervix cells. The British
Medical Journal (BMJ) published a study showing
that patients who discovered the disease through the
Pap smear test had a survival rate of 92%, while those
who discovered it through symptoms had a 66% rate.
It happens due to late symptoms when the disease is
already at a more advanced stage. However, the test
allows the lesions to be detected early, even at the
beginning of the disease, which eases treatment.
There are two ways to perform the Pap smear. In
the first one, the cells are initially collected. For this,
an instrument called speculum is introduced into the
vagina. With a wooden spatula, the collector performs
a cervix visual inspection intending to collect its
internal and external surface. The harvested cells are
placed on a slide, called a smear, and are sent for
analysis to laboratories specialized in cytopathology.
The second method is initiated analogously to the
previous one, but before placing the cell samples on
a slide, they are placed in a liquid medium which is
treated to remove other elements, such as mucus and
red blood cells, in order to increase the sensitivity
and specificity of the examination. Although the
liquid medium concentrates the cells in smaller areas,
speeding the manual reading, this method is costly,
which determines its less frequent employment.
A sample collection of the Pap test generates
around 15,000 fields for analysis on a slide. Since this
analysis is performed manually, the volume of data
is extensive. Thus, difficulties such as professionals’
physical and mental fatigue arise. In addition, once
the procedure requires great technical knowledge, the
labor becomes more expensive, reducing the number
of trained people capable to perform it. Thus, we
pursue a way to help these professionals to reduce
Diniz, D., Souza, M., Carneiro, C., Ushizima, D., Sombra, F., Oliveira, P. and Bianchi, A.
An Iterated Local Search Algorithm for Cell Nuclei Detection from Pap Smear Images.
DOI: 10.5220/0007718303190327
In Proceedings of the 21st International Conference on Enterprise Information Systems (ICEIS 2019), pages 319-327
ISBN: 978-989-758-372-8
Copyright
c
2019 by SCITEPRESS – Science and Technology Publications, Lda. All rights reserved
319

the number of false positives (cases in which the
examination detects a false lesion) and false negatives
(cases in which a cell lesion is not detected), once that
this interferes with the physical and/or psychological
health of a patient.
The first step to identify if a cell has malignant
changes is the detection and segmentation of its nuclei
since the morphological and texture characteristics
of the nucleus present significant variations when
they are altered. Cytopathologists identify the
lesion by altering the nucleus / cytoplasm ratio,
accompanied by changes in chromatin distribution,
hyperchromasia, and nuclear membrane shape. On
the other hand, computer scientists hypothesize
that only the identification of nuclear irregularity,
texture difference and hyperchromasia, or irregular
chromatin condensation would be sufficient to
identify a suspected cell. However, many researchers
(Moshavegh et al., 2012; Samsudin et al., 2016)
have been arguing that the detection and segmentation
of their nuclei (Plissiti and Nikou, 2012b; Plissiti
and Nikou, 2012a; Lorenzo-Ginori et al., 2013) is
enough for lesion detection, since the morphological
and texture characteristics of the nucleus present
significant variations when altered. What may
happen, for example, is an increase in the size of
the nucleus, the irregularity of its nucleic acid form,
texture difference, and hyperchromasia, or irregular
chromatin condensation (Plissiti et al., 2011).
Cells and nuclei segmentation is a working
progress enabling different approaches, from
region-based segmentation to Convolutional Neural
Network (CNN) (Song et al., 2014; Lee and Kim,
2016; Tareef et al., 2017; Araujo et al., 2018). One
of those studies use the concept of superpixel (Song
et al., 2014) as a clustering stage to generate the
superpixels that were used to train a CNN. They have
been used to classify what was background in the
image, cytoplasm or nucleus. (Lee and Kim, 2016)
also used superpixel for partitioning and cell-bound
refinement to perform the detection. (Tareef et al.,
2017) proposed a method based on local distinctive
characteristics and guided shape deformation that
are embedded and classified by a Support Vector
Machine (SVM). They have used it to segment the
image into nuclei, cell clusters, and background. In
addition, they use a structure based on the theory
of sparse coding (SC) and guided by representative
characteristics of the form to construct the cytoplasm
of each cell.
Another frequently used technique is the
nucleus-detection one, called Maximally Stable
Extremal Region (MSER) (Lu et al., 2015). (Nosrati
and Hamarneh, 2014) used it combined with Random
Forest (RF) classifier.
This work focuses on cervical cell nuclei
segmentation obtained in Pap smears images. The
objective is to maximize the number of true positive
results found and to minimize the number of
false positive results. In other words, the aim
is to maximize the number of nuclei found and
to minimize the number of nuclei found that do
not exist in the image. In the proposed method,
we used a superpixel clustering algorithm, simple
linear iterative clustering (SLIC) to oversegment
the image, the density-based spatial clustering
of applications with noise (DBSCAN) to cluster
generated superpixels, and an Iterated Local Search
(ILS) heuristic to calibrate the parameters that are
used to identify whether or not a superpixel is a
nucleus.
The remainder of this paper is organized as
follows. Section 2 introduces the database that is
used in tests. Section 3 presents the preprocessing
of database images. Section 4 details a heuristic
approach, based on the Iterated Local Search
metaheuristic, for solving the problem. Then, the
results are discussed in Section 5 and the conclusions
are exposed in Section 6.
2 DATABASE
The database used to implement the methods
was the “Overlapping Cervical Cytology Image
Segmentation Challenge”, proposed during a
challenge at International Symposium on Biomedical
Imaging (ISBI) in 2014. It contains 945 synthetic
images that were generated from real images obtained
from a Pap smears test. All images are 512 × 512,
grayscale, with a different number of cells, ranging
from one to ten, and varying overlapping levels of
cells. These images are divided into two groups: 45
for training and 900 for testing. An example of these
images is shown in Figure 1.
3 IMAGE PREPROCESSING
As shown in Figure 2, image preprocessing consists
of two steps. In the first step, the initial image that
was obtained in the database shown in Section 2 (see
Figure 2(a)) is used as input of the SLIC algorithm
- a segmentation superpixel algorithm proposed by
(Kovesi, 2000), and in the second one, DBSCAN is
used to cluster similar superpixels.
The idea of the SLIC algorithm is to generate
superpixels by clustering pixels based on their color
ICEIS 2019 - 21st International Conference on Enterprise Information Systems
320

Figure 1: Synthetic database image.
similarity and proximity. The algorithm is based on
the k-means clustering approach (MacQueen, 1967;
Duda et al., 2000), and considers a space of five
dimensions [labxy], where l, a and b are CIELAB
space values, and x and y are the coordinates of
the pixels. Moreover, a new distance is used to
considering the size of the superpixels, which will be
explained below.
Consider an image with N pixels and an input
parameter K estimating the desired amount of
superpixels. So, it is known that the size of each
superpixel generated by SLIC has N/K pixels. Besides
that, in order for all superpixels to have approximately
the same size, a center C
k
= [l
k
,a
k
,b
k
,x
k
,y
k
]
T
is
placed at each distance of S =
p
N/K pixels.
Since the spatial extent of any superpixel is
approximately S
2
, it is known that the pixels
associated with the center are within an area 2S × 2S
around it in the xy plane, which is the grouping area.
The distance D
s
can be described according to
Equation (1):
d
lab
=
q
(l
k
− l
i
)
2
− (a
k
− a
i
)
2
− (b
k
− b
i
)
2
d
xy
=
q
(x
k
− x
i
)
2
− (y
k
− y
i
)
2
D
s
= d
lab
+
m
S
d
xy
(1)
where D
s
is the sum of the distance lab and the
normalized distance xy by the interval S. The variable
m is used to control the superpixel compaction.
With the defined distance, it is possible to realize
the generation of the superpixels, as shown in
Algorithm 1. The algorithm response is described in
Figure 2(b).
Once we obtained the superpixels segmented
image, we can move on to the second preprocessing
stage. It consists in grouping similar superpixels.
Algorithm 1: SLIC.
1 Initialize cluster centers C
k
= [l
k
,a
k
,b
k
,x
k
,y
k
]
T
by
sampling pixels at regular grid steps S.
2 Perturb cluster centers in an n × n neighborhood to
the lowest gradient position. repeat
3 for each cluster center C
k
do
4 Assign the best matching pixels from a
neighborhood around the C
k
(Eq. (1)).
5 end
6 Compute new cluster centers and residual
error E
7 until E ≤ threshold;
8 Enforce connectivity
This step is performed by using the DBSCAN
algorithm (Ester et al., 1996), which searches similar
neighbors until a determined distance point is found,
and then groups them according to density. The
process is repeated until all the groups or clusters are
found. That is when preprocessing is accomplished.
The output of the algorithm is shown in
Figure 2(c), where each cluster image is a nucleus
candidate that will be evaluated according to proposal
of (Oliveira et al., 2017). In this proposal
five parameters, called CIA, are used: Circularity
(minimum and maximum), Intensity (minimum) and
Area (minimum and maximum). These parameters
are used to define whether or not a cluster is a nucleus.
Thus, the next step is to find the best combination
of CIA parameters, which implies better database
nucleus detection.
4 HEURISTIC APPROACH
In this Section, the proposed heuristic approach,
based on the Iterated Local Search (Lourenc¸o et al.,
2010) metaheuristic, is described.
This method was chosen in view of its excellent
performance for solving several other combinatorial
problems, such as in (Coelho et al., 2016), (Zhou and
Hao, 2017), and (Song et al., 2018).
4.1 Solution Representation
A solution s of the problem is represented by a
five-position vector, in which each position indicates
each CIA parameter within the range shown in
Table 1.
An example solution is shown in Figure 3. In
this solution, the first parameter, which measures the
minimum circularity, has value 0.50, and the third
parameter, which measures the minimum intensity,
has value 70.
An Iterated Local Search Algorithm for Cell Nuclei Detection from Pap Smear Images
321
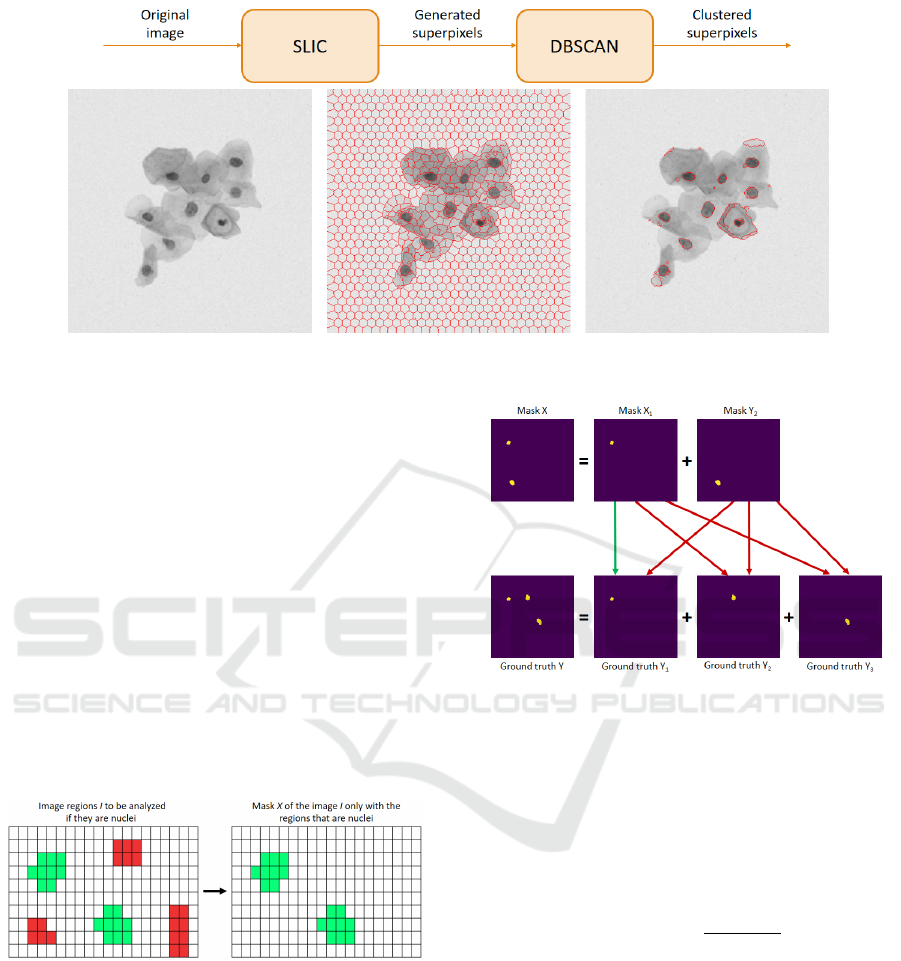
Figure 2: Preprocessing flow chart of images.
s =
0.50, 1.10, 70, 120, 600
Figure 3: Example for a solution s of the problem.
4.2 Solution Evaluation
For each image I, a resulting mask X is generated
containing only the clusters within the intervals
delimited by all the CIA parameters of solution s.
In this way, image I may have fewer nuclei than the
actual ones.
The process of constructing a mask X is shown in
Figure 4. As we can see, in the image I the are five
clusters candidates to nuclei, but only two (in green
color) have been identified as a nucleus. Thus, mask
X generated has only these two clusters.
Figure 4: An example of the construction of a mask X.
If mask X contains more than one nucleus, it is
decomposed into new masks so that each one contains
only one of its nucleus. For example, as shown in
Figure 5, the two-nuclei mask is decomposed into two
new masks X
1
and X
2
, each one containing only one
of its nucleus. The same procedure is carried out for
each template Y in the ground truth image. It is noted
that the template of an image I may contain a different
number of nuclei of the mask of the same image I.
Each mask X
i
relative to a resulting image I is
compared to all ground truth Y
j
of that image under
Figure 5: Comparison of a mask X with a ground truth Y .
evaluation to determine the method’s assertiveness
level.
To that end, the Similarity Coefficient Dice (Dice,
1945), also known as Sørensen-Dice Coefficient, is
used. The coefficient is calculated by Equation (2),
which is a statistical metric used to compare the
similarity between two samples X
i
and Y
j
:
Dice(X
i
,Y
j
) =
2|X
i
∩Y
j
|
|X
i
| + |Y
j
|
. (2)
The coefficient value in Equation (2) gives in a
real interval (0, 1). We consider that a coefficient
greater than 0.6 indicates that the similarity between
them is greater than 60%. Consequently, the analyzed
cluster is considered a nucleus. If there is a ground
truth Y
j
such as Dice(X
i
,Y
j
) ≥ 0.6, then the procedure
informs that it correctly detected that X
i
is a nucleus
(true positive). In different circumstances, it is said
that the algorithm has mistakenly detected that X
i
is a
nucleus, that is, a false positive result is provided.
In Figure 5 we have a mask X with two nuclei
decomposed into two masks X
1
and X
2
, each with
a single nucleus. Also, we have a ground truth Y
ICEIS 2019 - 21st International Conference on Enterprise Information Systems
322

with three nuclei relative to an image I. This ground
truth was decomposed into three other templates - Y
1
,
Y
2
and Y
3
, each with a single nucleus. By applying
the Similarity Coefficient, it is observed that X
1
and
Y
1
were considered equivalent (see the green arrow).
Since the Dice(X
1
,Y
1
) value was greater than 0.6,
we can say that the nucleus in X
1
has been detected
correctly. Also in the same example, since the mask
X
2
was not considered equivalent with no ground truth
Y
j
, with j = 1,2,3 (see red arrows), we can affirm that
the nucleus in X
2
was detected incorrectly.
Thus, in order to evaluate the solution s, we have
maximized the function F
1
(Manning and Sch
¨
utze,
1999), given by Equation (3), which corresponds
to the harmonic mean between precision and recall
metrics:
F
1
(s) = 2 ×
prec(s)× rec(s)
prec(s)+ rec(s)
(3)
where precision and recall of the solution s are
calculated according to Equations (4) and (5),
respectively:
prec(s) =
∑
I∈DataBase
T P(I,s)
∑
I∈DataBase
[T P(I,s) + FP(I,s)]
(4)
rec(s) =
∑
I∈DataBase
T P(I,s)
∑
I∈DataBase
[T P(I,s) + FN(I,s)]
(5)
In these equations, T P(I,s), FP(I,s) and FN(I,s)
represent the number of true positive, false positive
and false negative results in each database image
I detected by applying Equation (2) to all masks
X
i
related to the decomposed image I that were
generated from solution s.
Therefore, we want to maximize both precision
and recall. Consequently, we are looking for
maximizing the number of true positive results (TP)
and minimizing the number of false positive (FP) and
false negative (FN) results.
4.3 Initial Solution and Neighborhood
Structure
A solution to the problem is obtained by randomly
choosing the CIA parameter values, following the
limits defined in Table 1. First, the algorithm
constructs 10 solutions but only the best is chosen as
the initial one.
In order to explore the solution space, we define
a simple neighborhood structure that consists in
increasing or decreasing a chosen position of the
solution according to a step r. For the first two
parameters, the step value is set to r = 0.01 units,
whereas for the last three parameters, the step value
varies by up to r = 5 units. In both, the step value
can be either positive or negative, respecting the limits
established in Table 1. Therefore, a solution s has
NNeigh = 6 × r + 4 neighbor solutions.
Figure 6 shows an example where the fourth
position of the solution s was chosen to be
decremented in 3 units, generating a neighbor s
0
of
the solution s.
s =
0.50, 1.10, 70, 120, 600
s
0
=
0.50, 1.10, 70, 117, 600
Figure 6: A solution s and a neighbor s
0
.
This neighborhood was the only one used because
by applying this move it is possible to explore all the
problem-solution space using local search methods.
4.4 Iterated Local Search
The Iterated Local Search method – ILS (St
¨
utzle,
1998; Lourenc¸o et al., 2010) explores the solution
space through perturbations in local optima. These
perturbations must be strong enough to prevent the
algorithm from being trapped in a local optimum and
thus explore different solutions, but weak enough to
prevent random restarts.
As shown in Algorithm 2, the perturbation
consists in applying p + 1 consecutive moves
according to Section 4.3, where p corresponds to
the perturbation level to be performed. Algorithm 3
Algorithm 2: Perturbation.
Input: s, p
1 s
0
← s
2 nModi f ications ← p + 1
3 cont ← 1
4 while cont ≤ nModi f ications do
5 Apply a random move at solution s
0
6 cont ← cont + 1
7 end
8 return s
0
shows the pseudo-code of the ILS method. It starts
with an initial solution (line 1) and applies a local
search in it (line 2). In order to avoid getting stuck
in this solution (which is possibly a local optimum),
the current solution s is disturbed, generating an
intermediate solution s’ and a new local search is
made (lines 8 and 9, respectively). If the solution
s” resulting from this local search is better than
An Iterated Local Search Algorithm for Cell Nuclei Detection from Pap Smear Images
323
s according to function F
1
, given by Equation (3),
then s” becomes the new current solution and
the perturbation level is restarted (lines 10-13);
otherwise, the perturbation level is incremented (line
15). As previously explained, the perturbation level
represents the intensity of the perturbation that will be
performed. This whole process is repeated until the
maximum number of iterations (ILSMax) is reached
without an improvement in the current solution.
Algorithm 3: Iterated Local Search.
Input: F
1
(.),ILSMax
1 s
0
← Initial Solution
2 s ← LocalSearch(s
0
)
3 iter ← 0
4 bestIter ← iter
5 p ← 1
6 while iter − bestIterr < ILSMax do
7 iter ← iter + 1
8 s
0
← Perturbation(s, p)
9 s
00
← LocalSearch(s
0
)
10 if F
1
(s
00
) > F
1
(s) then
11 s ← s
00
12 bestIter ← iter
13 p ← 1
14 else
15 p ← p + 1
16 end
17 end
18 return s
The local search used in Algorithm 3, lines 2 and
9, is a Random Descent. It works as follows:
Step 1: A random neighbor of the current solution is
generated;
Step 2: If this neighbor is better than the current
solution, then it becomes the new current solution.
If not, this neighbor is discarded and another
random neighbor is generated, returning to Step 1;
Step 3: The process is repeated until a maximum
number of consecutive neighbors without
improvement (RDMax) in the current solution
is reached, where RDMax = pRD × NNeigh,
pRD ∈ (0,1), and NNeigh is the maximum
number of neighbors in the current solution.
5 COMPUTATIONAL
EXPERIMENTS
The proposed preprocessing method (Section 3)
was performed in MATLAB language, whereas the
proposed algorithm (Section 4) was developed in
Python. All experiments were performed on an Intel
Core i7-8700 processor with a 3.20GHz processor,
with 16GB RAM, and running on Windows 10 at
64-bits.
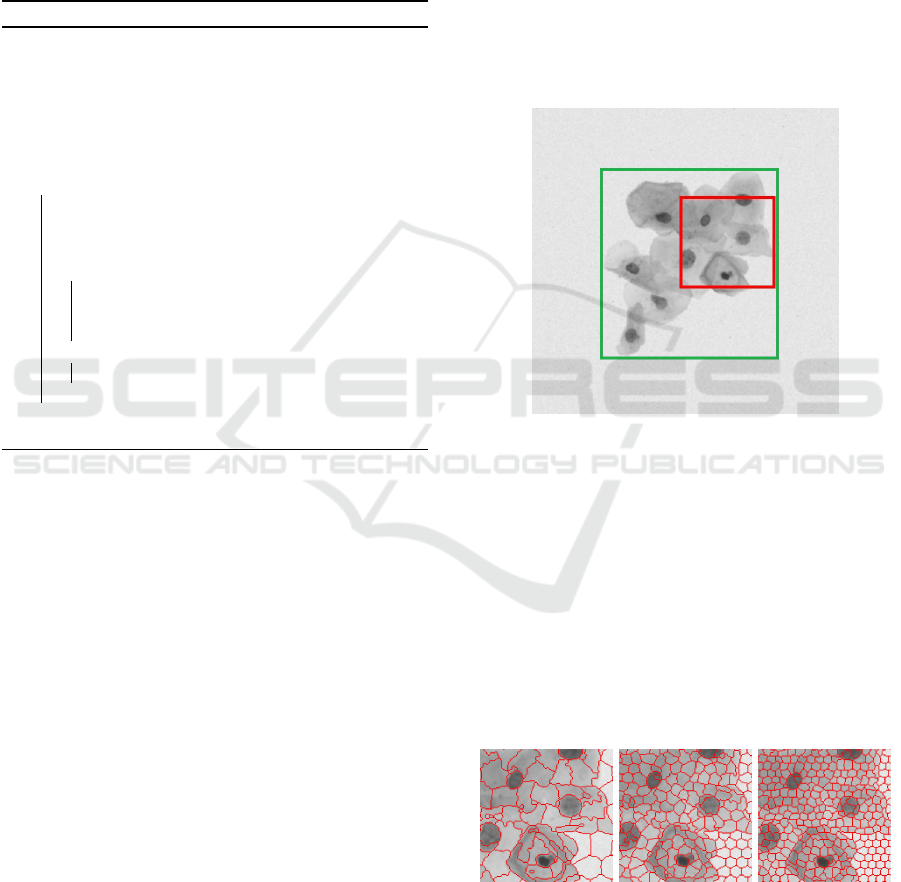
During the preprocessing stage, it was necessary
to define SLIC and DBSCAN parameters. These
values were obtained empirically using the training
database. To explain the parameter calibration that
was made it was necessary to zoom in the image (see
Figure 7) because it has a lot of details to be observed.
In Figure 7, the red square shows the zoomed image
area used to explain SLIC parameters (Figures 8, 9
and 10), whereas the green one shows zoomed image
area for DBSCAN (Figure 11).
Figure 7: Zoomed image areas for description of SLIC (in
red) and DBSCAN (in green) parameters.
The number of desired superpixels was the first
SLIC parameter that has been calibrated. As
shown in Figure 8, the higher parameter value,
the more clusters are generated. According to the
training database, we can note that smaller parameter
values imply bigger clusters, harming the nucleus
detection. However, if we increase too much the SLIC
parameter, it interferes in the clustering of similar
superpixels made by DBSCAN. The best value that
we find for the number of desired superpixels on the
training database was 2000.
(a) 500 (b) 2000 (c) 3500
Figure 8: Number of desired superpixels in SLIC.
The second SLIC parameter calibrated was
the weighting factor between color and spatial
differences. (Kovesi, 2000) suggests values from 5 to
ICEIS 2019 - 21st International Conference on Enterprise Information Systems
324
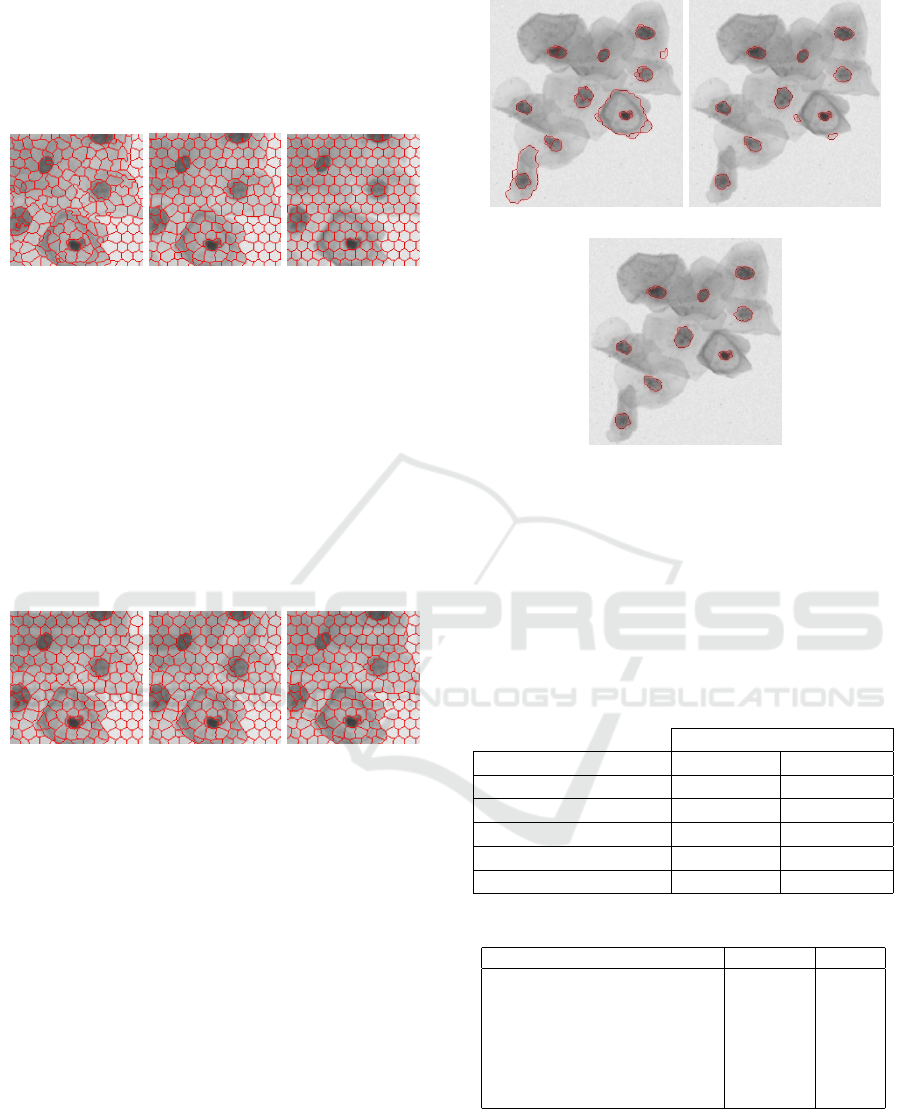
40. As shown in Figure 9, if we increase too much
the parameter it does not bring good results, once
the clusters that have a nucleus part, also have others
noise parts of the image too. So, after some tests, the
best value found for this parameter was 11.
(a) 5 (b) 11 (c) 40
Figure 9: Weighting factor between color and spatial differ-
ences in SLIC.
Finally, the last SLIC parameter calibrated was
the cluster size threshold. In other words, regions
morphologically smaller than the threshold are
merged into an adjacent cluster. (Kovesi, 2000)
suggests a value of 1 or 1.5 and 0 to disabled this
merge. The results of applying this parameter are
shown in Figure 10. As we can see below, the
difference between them is not relevant. But, as a
nucleus can not be so small, we use 1.5 as the cluster
size threshold just to exclude the small ones.
(a) 0 (b) 1 (c) 1.5
Figure 10: Cluster size threshold in SLIC.
Following, the only DBSCAN calibrated
parameter was the threshold that controls which
superpixels should be clustered. (Kovesi, 2000)
suggests values from 5 to 10. As shown in Figure 11,
a bigger threshold returns less clusters, without
decreasing the quality of clusters found. In this way,
a higher threshold can reduce the processing time
of the heuristic approach to analyze the clusters that
are nuclei candidates. So, the value chosen for the
threshold was 10, completing the calibration of the
preprocessing parameters.
As stated in Section 2, the database used provides
45 images for training and 900 for testing. The
training images were used to estimate the intervals
for each of the five parameters described in Table 1
so that the allowed limits correspond to actual values
found in cells.
After executing the proposed algorithm for the
solution s, we used the precision and recall measures,
(a) 5 (b) 8
(c) 10
Figure 11: Threshold that controls which superpixels are
clustered together in DBSCAN.
given by Equations (4) and (5), to determine
the quality of the nuclei detection. Table 2
presents the precision and recall values obtained from
the literature methods and the proposed heuristic
approach.
Table 1: CIA parameters interval values.
Interval
Parameter Minimum Maximum
Minimum Circularity 0.48 0.63
Maximum Circularity 1.08 1.23
Minimum Intensity 57 158
Minimum Area 114 213
Maximum Area 511 611
Table 2: Results for nuclei detection.
Method Precision Recall
(Nosrati and Hamarneh, 2014) 0.903 0.893
(Lu et al., 2015) 0.977 0.883
(Ushizima et al., 2014) 0.959 0.895
(Saha et al., 2016) 0.918 0.915
(Tareef et al., 2017) 0.990 0.940
(Braz and Lotufo, 2017) 0.929 0.917
Our method with ILS 0.985 0.879
As can be seen in Table 2, the proposed algorithm
was able to generate a solution with the second best
measure of precision. However, the recall was lower
than all methods to which it was compared.
An Iterated Local Search Algorithm for Cell Nuclei Detection from Pap Smear Images
325

6 CONCLUSIONS
This paper introduces an ILS-based algorithm to
detect cell nuclei from cervical cell images.
Each image was analyzed with respect to the
values of circularity (minimum and maximum),
intensity (minimum) and area (minimum and
maximum) parameters. The main purpose is to
simulate cytopathologists analysis, since the pap
smear test uses morphological and chromatin
distribution in nucleus to detect anomalies.
The proposed algorithm produced adequate
results, according to the precision standards proposed
in the literature, and when compared to other
algorithms; in fact, the ILS-based algorithm showed
the second best measure of precision. However, its
performance regarding recall was not satisfactory. It
is known that the recall is related to the number of
nuclei that the algorithm failed to find. Therefore, it
is important that the recall of Pap smears tests are
as high as possible since failing to detect a lesion
might influence prognosis. On the other hand, as a
computer cannot diagnose, then the images should be
analyzed later by a pathologist. Thus, the method
is not required to offer perfect precision, that is, all
clusters detected as nuclei are nuclei, indeed.
In this way, the study on the influence of other
parameters and the reasons why these nuclei were not
found are considered future work aiming to improve
the recall while maintaining high precision.
ACKNOWLEDGEMENTS
This study was financed in part by the Coordenac¸
˜
ao
de Aperfeic¸oamento de Pessoal de N
´
ıvel Su-
perior - Brazil (CAPES) - Finance Code 001.
The authors thank CAPES, Fundac¸
˜
ao de Am-
paro
`
a Pesquisa do Estado de Minas Gerais
(FAPEMIG, grants PPM/CEX/FAPEMIG/676-17
and PPSUS-FAPEMIG/APQ-03740-17), Con-
selho Nacional de Desenvolvimento Cient
´
ıfico e
Tecnol
´
ogico (CNPq, grant 307915/2016-6), Uni-
versidade Federal de Ouro Preto (UFOP), the
Moore-Sloan Foundation, and Office of Science,
of the U.S. Department of Energy under Contract
No. DE-AC02-05CH11231 for also supporting this
research. Any opinion, findings, and conclusions or
recommendations expressed in this material are those
of the authors and do not necessarily reflect the views
of the Department of Energy or the University of
California.
REFERENCES
Araujo, Silva, Medeiros, Parkinson, Hexemer, Carneiro,
and Ushizima (2018). Reverse image search for sci-
entific data within and beyond the visible spectrum.
Expert Systems with Applications, 109:35–48.
Braz, E. F. and Lotufo, R. d. A. (2017). Nuclei detec-
tion using deep learning. In Anais do XXXV Simp
´
osio
Brasileiro de Telecomunicac¸
˜
oes e Processamento de
Sinais, pages 1059–1063, S
˜
ao Pedro, Brazil.
Coelho, V., Grasas, A., Ramalhinho, H., Coelho, I., Souza,
M., and Cruz, R. (2016). An ils-based algorithm to
solve a large-scale real heterogeneous fleet vrp with
multi-trips and docking constraints. European Journal
of Operational Research, 250(2):367 – 376.
Dice, L. R. (1945). Measures of the amount of ecologic
association between species. Ecology, 26(3):297–302.
Duda, R. O., Hart, P. E., and Stork, D. G. (2000). Pat-
tern Classification (2Nd Edition). Wiley-Interscience,
New York, NY, USA.
Ester, M., Kriegel, H.-P., Sander, J., Xu, X., et al. (1996).
A density-based algorithm for discovering clusters in
large spatial databases with noise. In Proceedings of
the Second International Conference on Knowledge
Discovery and Data Mining – KDD-96, pages 226–
231, Portland, Oregon. AAAI Press.
Kovesi, P. D. (2000). Matlab and octave functions for
computer vision and image processing. Available at
https://www.peterkovesi.com/matlabfns/. Accessed:
2018-09-20.
Lee, H. and Kim, J. (2016). Segmentation of overlapping
cervical cells in microscopic images with superpixel
partitioning and cell-wise contour refinement. In Pro-
ceedings of the IEEE Conference on Computer Vision
and Pattern Recognition Workshops, pages 63–69, Las
Vegas, NV, USA.
Lorenzo-Ginori, J. V., Curbelo-Jardines, W., L
´
opez-
Cabrera, J. D., and Huergo-Su
´
arez, S. B. (2013).
Cervical cell classification using features related to
morphometry and texture of nuclei. In Proceedings of
the Iberoamerican Congress on Pattern Recognition,
pages 222–229, Berlin, Heidelberg. Springer.
Lourenc¸o, H. R., Martin, O. C., and St
¨
utzle, T. (2010). It-
erated Local Search: Framework and Applications,
volume 146 of International Series in Operations
Research & Management Science, pages 363–397.
Kluwer Academic Publishers, 2nd edition.
Lu, Z., Carneiro, G., and Bradley, A. P. (2015). An
improved joint optimization of multiple level set
functions for the segmentation of overlapping cer-
vical cells. IEEE Transactions on Image Processing,
24(4):1261–1272.
MacQueen, J. (1967). Some methods for classification and
analysis of multivariate observations. In Proceed-
ings of the Fifth Berkeley Symposium on Mathemat-
ical Statistics and Probability, Volume 1: Statistics,
pages 281–297, Berkeley, Calif. University of Cali-
fornia Press.
Manning, C. D. and Sch
¨
utze, H. (1999). Foundations of
statistical natural language processing. MIT press.
ICEIS 2019 - 21st International Conference on Enterprise Information Systems
326

Moshavegh, R., Bejnordi, B. E., Mehnert, A., Sujathan, K.,
Malm, P., and Bengtsson, E. (2012). Automated seg-
mentation of free-lying cell nuclei in pap smears for
malignancy-associated change analysis. In Engineer-
ing in Medicine and Biology Society (EMBC), 2012
Annual International Conference of the IEEE, pages
5372–5375, San Diego, CA, USA. IEEE.
Nosrati, M. S. and Hamarneh, G. (2014). A vari-
ational approach for overlapping cell segmentation.
In Overlapping Cervical Cytology Image Segmenta-
tion Challenge, in conjunction with IEEE 11th Inter-
national Symposium on Biomedical Imaging (IEEE
ISBI), pages 1–2, Beijing, China. IEEE.
Oliveira, P. H. C., Moreira, G., Sabino, D. M. U., Carneiro,
C. M., de Medeiros, F. N. S., de Ara
´
ujo, F. H. D.,
e Silva, R. R. V., and Bianchi, A. G. C. (2017). A
multi-objective approach for calibration and detection
of cervical cells nuclei. 2017 IEEE Congress on Evol-
utionary Computation (CEC), pages 2321–2327.
Plissiti, M. E. and Nikou, C. (2012a). Cervical cell classi-
fication based exclusively on nucleus features. In Pro-
ceedings of the International Conference Image Ana-
lysis and Recognition, pages 483–490, Aveiro, Por-
tugal. Springer.
Plissiti, M. E. and Nikou, C. (2012b). On the im-
portance of nucleus features in the classifica-
tion of cervical cells in pap smear images. In
Proceedings of the International Workshop on
Pattern Recognition for Healthcare Analytics –
IWPRHR 2012, Tsukuba, Japan. Available at ht-
tps://sites.google.com/site/pr4healthanalytics/files/pap
er%208.pdf?attredirects=0&d=1.
Plissiti, M. E., Nikou, C., and Charchanti, A. (2011).
Automated detection of cell nuclei in pap smear im-
ages using morphological reconstruction and cluster-
ing. IEEE Transactions on information technology in
biomedicine, 15(2):233–241.
Saha, R., Bajger, M., and Lee, G. (2016). Spatial shape con-
strained fuzzy c-means (fcm) clustering for nucleus
segmentation in pap smear images. In Proceedings of
the International Conference on Digital Image Com-
puting: Techniques and Applications (DICTA), Gold
Coast, QLD, Australia.
Samsudin, N. A., Mustapha, A., Arbaiy, N., and Hamid, I.
R. A. (2016). Extended local mean-based nonpara-
metric classifier for cervical cancer screening. In Pro-
ceedings of the International Conference on Soft Com-
puting and Data Mining, pages 386–395, Bandung,
Indonesia. Springer.
Song, T., Liu, S., Tang, X., Peng, X., and Chen, M. (2018).
An iterated local search algorithm for the university
course timetabling problem. Applied Soft Computing,
68:597 – 608.
Song, Y., Zhang, L., Chen, S., Ni, D., Li, B., Zhou, Y., Lei,
B., and Wang, T. (2014). A deep learning based frame-
work for accurate segmentation of cervical cytoplasm
and nuclei. In Engineering in Medicine and Biology
Society (EMBC), 2014 36th annual international con-
ference of the IEEE, pages 2903–2906, Chicago, IL,
USA. IEEE.
St
¨
utzle, T. (1998). Local search algorithms for com-
binatorial problems: Analysis, Improvements,
and New Applications. PhD thesis, Darmstadt
University of Technology, Germany. Available at
http://iridia.ulb.ac.be/∼stuetzle/publications/Thesis.T ho-
masStuetzle.pdf.
Tareef, A., Song, Y., Cai, W., Huang, H., Chang, H., Wang,
Y., Fulham, M., Feng, D., and Chen, M. (2017). Auto-
matic segmentation of overlapping cervical smear
cells based on local distinctive features and guided
shape deformation. Neurocomputing, 221:94–107.
Ushizima, D., Bianchi, A., and Carneiro, C. (2014). Seg-
mentation of subcellular compartments combining su-
perpixel representation with voronoi diagrams. In
Proceedings of the International Symposium on Bio-
medical Imaging, Beijing, China.
Zhou, Y. and Hao, J.-K. (2017). An iterated local search al-
gorithm for the minimum differential dispersion prob-
lem. Knowledge-Based Systems, 125:26 – 38.
An Iterated Local Search Algorithm for Cell Nuclei Detection from Pap Smear Images
327
