
Extraction and Multidimensional Analysis of Data from Unstructured
Data Sources: A Case Study
Rui Lima
1
and Estrela Ferreira Cruz
1,2
1
ARC4DigiT - Applied Research Centre for Digital Transformation, Instituto Polit
´
ecnico de Viana do Castelo, Portugal
2
ALGORITMI Research Centre, Escola de Engenharia, Universidade do Minho, Guimar
˜
aes, Portugal
Keywords:
Data Mining, Data Wrangling, Web Scraping, Data Warehouse, Parsing, Business Intelligence.
Abstract:
This paper proposes an approach to detect and extract data from unstructured data source (about the subject
to be studied) available online and spread by several Web pages and aggregate and store the data in a Data
Warehouse properly designed for it. The Data Warehouse repository will serve as basis for the Business
Intelligence and Data Mining analysis. The extracted data may be complemented with information provided
by other sources in order to enrich the information to enhance the analysis and draw new and more interesting
conclusions. The proposed process is then applied to a case study composed by results of athletics events
realized in Portugal in the last 12 years. The files, about competition results, are available online, spread by
the websites of the several athletics associations. Almost all files are published in portable document format
(PDF) and each association provides files with its own different internal format. The case study also proposes
an integrating mechanism between results of athletics events with their geographic location and atmospheric
conditions of the events allowing to assess and analyze how the atmospheric and geographical conditions
interfere in the results achieved by the athletes.
1 INTRODUCTION
Nowadays many associations, companies and institu-
tions disclose information on-line, mostly in unstruc-
tured files such as PDF. Often is the case where inter-
related information is dispersed across multiple web-
sites. When it is necessary to make a study based on
that information, one needs to collect and merge all
the data to be compared and analyzed. For that, it will
be necessary to gather it from the various sources and
possibly to complete this information with informa-
tion made available online regarding the moments of
events. The main aim of this paper is to design a re-
peatable process allowing data detection, extraction,
join and load the information into a Data Warehouse
(DW) for posterior analysis. A process can be defined
as a set of interrelated activities that are carried out by
one organization, or someone, to create a product or
to perform a service (Cruz et al., 2014). Thus, it is
intended to identify a set of activities that must be ex-
ecuted in order to detect and extract information from
several online sites, treat that information and store it
into a DW for posterior analysis.
Usually information is published online in
portable document format (PDF) and each site pro-
vides files with its own different tabular layout de-
signed to be interpreted by humans. Pdf documents
are portable, meaning that, it is a platform indepen-
dent format, and independent from the software appli-
cation that was used for their production (Bienz et al.,
1997). PDF format was thought to store information
to be analyzed and interpreted by humans, it is not
prepared to be handled automatically by software ap-
plications.
Each one of the identified activities will be ex-
ecuted with the help of a tool, most of them pre-
existing tools. So, we make a selection and compari-
son of the tools available that can be used in each one
of process’ steps.
The process is then applied to a case study to ana-
lyze the results of the athletics events realized in Por-
tugal in the last 12 years. The case study will allow
to join all the information about the athletics events
results, spread by several sports association websites,
integrate this information with information about geo-
graphical location where the competitions took place
and with the information about atmospheric condi-
tions on which the competitions were held. This in-
formation is then loaded into a Data Warehouse and
some analysis is made by using Business Intelligence
190
Lima, R. and Cruz, E.
Extraction and Multidimensional Analysis of Data from Unstructured Data Sources: A Case Study.
DOI: 10.5220/0007720301900199
In Proceedings of the 21st International Conference on Enterprise Information Systems (ICEIS 2019), pages 190-199
ISBN: 978-989-758-372-8
Copyright
c
2019 by SCITEPRESS – Science and Technology Publications, Lda. All rights reserved

(BI) and Data Mining (DM) techniques.
This paper reports the final work carried out by
the first author as final work of the master’s degree in
Software Engineering and aims to answer questions
such as: - Is the number of athletes increasing in Por-
tugal? Which gender has the most participation in
sporting events? And which age range do we have the
most participants? How does altitude influence ath-
letes’ results? What is the influence of atmospheric
conditions on the number of participants? What are
the weather conditions that most influence the com-
petitions results? etc.. To the best of our knowledge,
there is no athletics results data warehouse available
for analysis in Portugal.
The remainder of this paper is structured as fol-
lows: In the next section, the designed process is pre-
sented. Section 3 presents related work and tools used
in each one of the identified steps are analysed and
compared. Section 4 presents the application of the
proposed approach to the athletics results as a case
study. The results are presented in section 5. Finally,
section 6 concludes the paper and presents some ideas
for future work.
2 THE PROPOSED PROCESS
In this section we are presenting the proposed pro-
cess, or in other words, we are presenting the collec-
tion of related, structured activities that must be car-
ried out by someone, or by a script, to gather all the
data, important to a cause, in a DW for analysis. The
activities must be executed by a specific order iden-
tified in the process. The proposed process is repre-
sented in Figure 1 and is designed in BPMN (Busi-
ness Process Model and Notation) language because
it is a widespread language and it is easy to under-
stand and usable by people with different roles and
training (Cruz et al., 2019).
Eight main activities were identified, one of which
is optional. The activities are:
• Web Scraping - The first step of the process is to
look for the information, about types of events it is
intending to analyze, and extract it from web sites.
This step is called Web scraping. Web scraping is
used to automatically detect and extract informa-
tion from a website instead of manually copying
it (Vargiu and Urru, 2013). Web scraping a web
page involves downloading the page and extract-
ing the content for later processing.
• Since it will be necessary to maintain the data up-
dated, periodically it is necessary to add new data.
For this, it is necessary to check if the extracted
files have already been treated (see step 2 in Fig-
ure 1). Moreover, it may happen that the same file
becomes available online on different websites. If
that is so, then the files are ignored otherwise the
process continues.
• Conversion to Plain Text - Files extracted from
different sites may have different formats, so it is
necessary to convert the files to one same format
in order to treat the files automatically. The for-
mat chosen should preferably be easy to parse au-
tomatically, like the plain text format (step 3 in the
process represented in Figure 1).
• Table Parsing - In the digital era, most informa-
tion is shared on-line, organized in tables, and
PDF is the most commonly used format for shar-
ing data (Khusro et al., 2015). After table deten-
tion it is necessary to parse the table to detect en-
tities, values and relationships. PDF format has
been thought to store information to be analyzed
and interpreted by humans, thus it is not prepared
to be used by software applications to treat data
automatically. Consequently, table detection and
data extraction from PDF files is not an easy task
but is an increasingly required one. Several au-
thors have already proposed approaches to deal
with this problem, as is the case of (Khusro et al.,
2015),(Oro and Ruffolo, 2009), (Yin et al., 2015)
and many others.
• Data Wrangling The next step in the process is
the Data wrangling. Data wrangling can be de-
fined as a process of examining and transform-
ing data into a usable form (Endel and Piringer,
2015). Data wrangling is the activity of clean-
ing and unifying ”uncooked”, disorganized, con-
fusing and complex data into another format, or-
ganized, easily accessible and analyzable. It in-
volves the normalization of columns, filling in in-
complete data by calculating new values from the
current ones or even defining the data type of each
column. Usually data do not join properly un-
less time is spent formatting and standardizing it
(Kazil and Jarmul, 2016).
• Joining New Data - This step is optional because
in same cases it will not be necessary but, in other
cases, adding information will enable us to reach
new and more valuable conclusions. Since the ob-
jective is to analyze the data, it may sometimes be
necessary to add information regarding the condi-
tions (e.g. geographic, weather etc.) at the time at
which the events occurred. If this is the case, then
it is necessary to add and aggregate this data with
the data extracted previously, to be subsequently
loaded into the database.
Extraction and Multidimensional Analysis of Data from Unstructured Data Sources: A Case Study
191
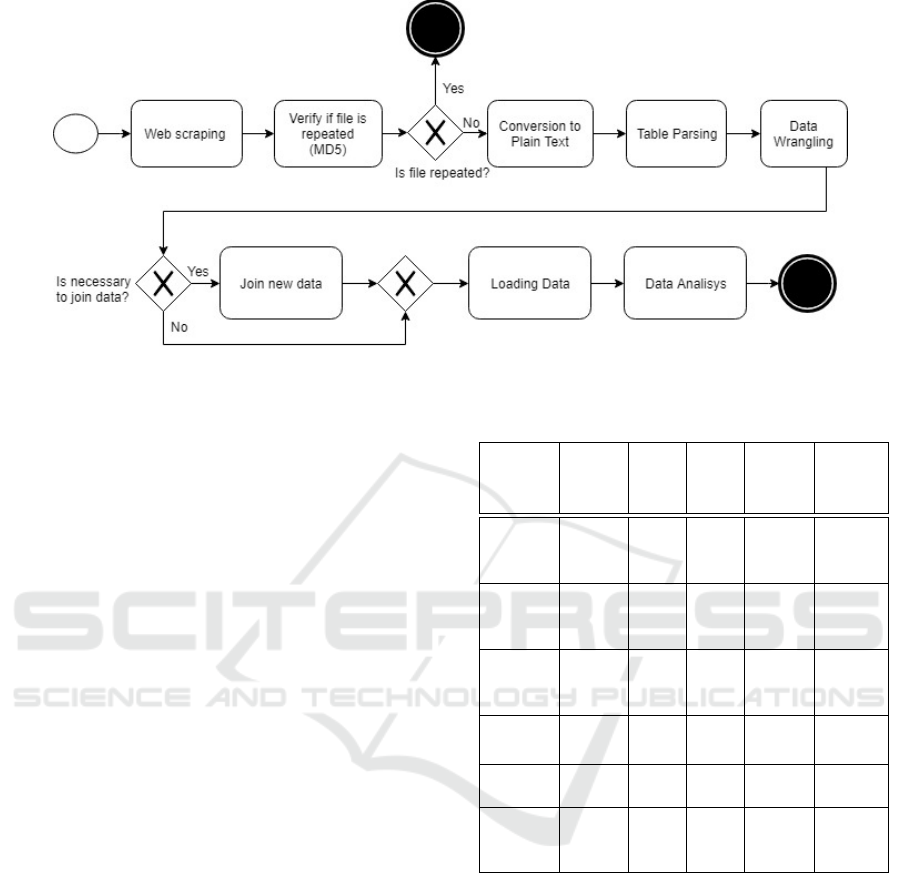
Figure 1: Proposed Process.
• Loading Data - Before loading the data, it is nec-
essary to prepare the environment, or the database
to receive the data. For this it is necessary to
make the design suiting the database and create
the database. As Santos and Costa say Data ware-
houses are central pieces in business intelligence
(Santos and Costa, 2016). Thus, it is suggested to
design a DW based on the metadata derived from
the analyzed tables (table headings). After that,
data may be loaded into the database.
• Data Analysis - Once the data is stored in the
data set, it can be analyzed using existing analyt-
ical algorithms, including the more popular ones
like kNN, AdaBoost, Naive Bayes, etc. (Wu et al.,
2008).
3 RELATED WORK AND TOOLS
For each one of the steps identified in the proposed
process there are several tools that can be used. This
section presents an overview of the tools that can be
used in each one of the stages of the proposed process.
3.1 Web Scraping Tools
Web scraping is a widely used technique to extract
files from web sites, so there are several tools avail-
able in the market that can be used. Consequently, it
is necessary to select the best web scraping tool. In
table 1 we are comparing some web scraping tools in
the following aspects: price, type of license, graphi-
cal user interface (GUI) availability, application pro-
gramming interface (API) availability and recursive
web page searching capabilities (web crawling).
Table 1: Web scraping tool and services comparison.
Tool
Web
crawl-
ing
API
GUI
Price License
Import.io
Yes
Web
API
Yes
169$ to
419$ a
month
Proprie
tary
Selenium
Webdriver
No Yes No Free
Apache
2.0
Dexi.io
Yes
Web
API
Yes
105$ to
699$ a
month
Proprie
tary
Scrapy
Yes Yes No Free
BSD 3.0
Ghost.py
No Yes No Free
MIT
Webhose.io
Yes
Web
API
Yes
Free to
4000$ a
month
Proprie
tary
As we can see in Table 1, the tools Import.io, Web-
hose.io and Dexi.io have a proprietary license and in-
volve a monthly payment. Moreover, these tools have
provided their solution only as a service through a
WEB API. This way, when it would be necessary to
integrate one of these tools in a script, it would be nec-
essary to use the web API and pay a monthly fee for
the requests made. For these reasons, those tools were
not selected to be used in the case study presented
next. On the other hand, Scrapy, Selenium Webdriver
and Ghost.py have less restrictive licenses and their
APIs can be accessed without making web requests.
For the standard web scraper the Scrapy tool was
selected for being considered the most powerful, for
being written in Python, and for owning an extremely
ICEIS 2019 - 21st International Conference on Enterprise Information Systems
192

Table 2: File conversion tool comparison.
Tool
File
types
(input)
File
types
(out-
put)
keep
lay-
out
Price License
Libre
Office
Several
formats
Several
formats
No Free
MPL
2.0
pdftotext
PDF
txt
No Free
GPL
2.0/3.0
PDF
Miner
PDF
txt
No
free
MIT
PDF
to text
(web)
PDF
txt,
doc,
docx
No Free
Proprie
tary
quick asynchronous engine (Kazil and Jarmul, 2016).
This project needs to search multiple web pages from
each web site until it finds the wanted files and, from
the considered tools, Scrapy is the only one to pro-
vide this type of recursive analysis (web crawling)
without presenting monetary costs (Kazil and Jar-
mul, 2016). It is a relatively easy to use, although
it always requires an initial configuration for each
crawler (Mitchell, 2018). There are cases where a
website uses a large quantity of JavaScript to fill a web
page. In those cases a conventional web scraper cant
find the content and is necessary to simulate a web
browser capable of reading the screen and not the web
page. Such is the case of the Selenium Webdriver and
Ghost.py. Between those two Selenium was chosen
because it is more popular and has less dependencies
(Kazil and Jarmul, 2016).
3.2 File Conversion Tools
In Table 2 there is a comparison between different
tools capable of converting files between different
types. Since PDF is the predominant format of the
source files, it will be given more importance to the
tools that work with those types of files. The compar-
ison is made in several aspects such as: The type of
files the tool deals with (type of input files and type
of output files), if the tool keeps the layout, the price
and type of license.
As we can see in Table 2 all compared tools con-
vert files from pdf format to comma-separated value
(CSV) format (txt file extension), all are free of pay-
ment, but none preserves the original layout. The
LibreOffice tool is a set of open source applications
compatible with a large quantity of document types,
including Microsoft Office. Thus, to the case study
presented next, this tool was selected to convert any
file that is not PDF or plain text into PDF.
3.3 Parsing Tools
A PDF file encapsulates (and hide) lots of informa-
tion about the document, including fonts, structure
of the tables, images, etc.. This way, detecting ta-
bles in pdf files and detecting the information stored
in those tables is a complex task, but increasingly
required. Thus, several approaches have been pro-
posed to detect and extract tables available in PDF
files. Yildiz et al. propose the method pdf2table
(Yildiz et al., 2005) and (Oro and Ruffolo, 2009) the
approach PDF-TREX, both capable of automatically
segmenting the content into tables. Pitale and Sharma
refer to iText as a tool capable of manually or auto-
matically recognizing, segmenting and tagging con-
tent into tables (Pitale and Sharma, 011). An algo-
rithm for automatically recognizing tables is proposed
by (Hassan and Baumgartner, 2007). All of these
methods only extract the table itself but not their con-
tents relationships or hierarchy.
There are also several on-line and browser-based
tools that can be used to transform PDF into CSV
files. CSV is a format where each line corresponds
to a record and each record consists of several fields
separated by a comma (McCallum, 2012). CSV files
can easily be used to process data automatically.
Some of the more noteworthy tools are acon-
vert.com
1
, Tabula
2
, PDFTables
3
, but there are oth-
ers. However and although the data remains intact in
the conversion, it is virtually impossible to reliably re-
cover the correspondence between the data values as
well as their meaning (McCallum, 2012).
Another approach considered for this pur-
pose involves using the relatively new unsuper-
vised machine-learning algorithms GloVe (Penning-
ton et al., 2014) or Word2Vec (Mikolov et al., 2013)
for word vectorization, combined with the k-means
algorithm for clustering the resulting data. Glove and
Word2Vec follow the same principle of vectorizing
words according to their context in the line they are
placed (Shi and Liu, 2014). This is done by creating
a co-occurrence matrix between all existing words,
adding a value to the corresponding cell every time
there is an occurrence of two words in the same line
(Pennington et al., 2014). Although an elegant ap-
proach that did not need human supervision, it proved
to be an unreliable tagging method that also did not
deal with field hierarchy or word relations. In the
case study presented in section 4, we developed our
own information extraction module (named as Posi-
tionParser) capable of helping the user to: define the
1
https://www.aconvert.com
2
https://tabula.technology
3
https://pdftables.com
Extraction and Multidimensional Analysis of Data from Unstructured Data Sources: A Case Study
193

Table 3: Data wrangling tools comparison.
Tool
Predic
tion
capabi
lities
Cluste
ring
Data
limit
API
GUI
Fuzzy
Wuzzy
No No
Limited
only to
RAM
Yes No
Open
Refine
No Yes
800
000
entries
No Yes
Trifacta
Wrangler
Yes No
100
MB
No Yes
reading order; tag the data; define field hierarchies
and maintain word relationship.
3.4 Data Wrangling Tools
Data analysis has become more sophisticated through
time. However, little improvement has been made on
the most monotonous part of the data flow, the clean-
ing and standardization of data. This means that, of-
ten, specialists get stuck on the repetitive and time-
consuming work of data wrangling instead of working
on their expertise (Kandel et al., 2011). The same may
happen with less technical users that can be unneces-
sarily blocked on that same type of monotonous work
(Kandel et al., 2011). Usually extracted data presents
reading and consistency problems, particularly if de-
rived from different sources. In these cases, it is very
unlikely to get a correct merging of the data without a
proper formatting and standardization (Kazil and Jar-
mul, 2016). For that purpose, three tools are com-
pared in Table 3 according to the capacity for pre-
dicting new transformations, existence of algorithms
capable of clustering, data limit, existence of pro-
grammable API and GUI.
Fuzzy wuzzy is a module, developed in Python,
capable of comparing strings by their resemblance
or difference (Kazil and Jarmul, 2016). The Tri-
factaWrangler tool is capable of making predictions
based on transformations already made by the user.
However the free version only allows to work with
a maximum of 100 MB of data
4
. OpenRefine is an
open source project initiated in 2009 by the company
Metaweb with the name FreebaseGridworks. In 2010
the company was acquired by Google that changed
the project name to Google Refine. In 2012 Google
abandoned the project’s support giving it the name of
4
Stated on https://www.trifacta.com/start-wrangling/,
accessed in November 5, 2018.
Table 4: BI and DM tools comparison.
Tool
DM BI
Web In-
terface
License
Orange
Canvas
Yes No No
GPL 3.0
Metabase
No Yes Yes
AGPL 3.0
QlikSense
Cloud
No Yes Yes
Proprietary
Apache
Superset
No Yes Yes
APL 2.0
Tableau
Public
Yes Yes Yes
Proprietary
Redash
No Yes Yes
BSD 2.0
OpenRefine, where any person can contribute to its
development (Mitchell, 2018).
To our case study, it was decided that OpenRefine
is the best tool to use because it is capable of clean-
ing data rapidly and easily, even by non-programmers
(Mitchell, 2018). Although it is not capable of mak-
ing predictions, it allows to work with a bigger data
volume than TrifactaWrangler (about 800.000 en-
tries) and it has good algorithms capable of cluster-
ing different strings with the same meaning semi-
automatically.
3.5 Business Intelligence and Data
Mining Tools
Business Intelligence (BI) is a process that allows
making “smart” business decisions based on the anal-
ysis of available data. It combines analytical tools
to provide important information in decision by ex-
ploiting a large amount of data stored in an organi-
zational database (Santos and Ramos, 2006). Data
Mining (DM) is a process that seeks to identify rele-
vant patterns in a given form of representation, such
as decision trees, regression, segmentation, and others
(Santos and Ramos, 2006). Some BI and DM tools
are compared in Table 4 considering their DM and BI
capabilities, existence of web interface and type of li-
cense.
As we can see in Table 4, only Orange Canvas
and Tableau Public have DM capabilities. However
Tableau Public has a proprietary license. On the other
hand, Orange Canvas is the only tool that does not
have BI capabilities neither a Web interface. Anyway,
Orange Canvas is the selected tool for DM because it
is open source and free software with multiple visu-
alization methods.Its GUI holds multiple widgets that
ICEIS 2019 - 21st International Conference on Enterprise Information Systems
194
can be added and linked to one another to create a
data flow smoothing the DM process. Besides, it is
possible to change, directly, the visualization param-
eters of the charts and tables, allowing the data flow
interactive.
For BI analysis, we selected the Metabase tool
mostly because it is open source and it is simple and
easy to use. It works with the main operating systems
and can be used as a server or as a standalone appli-
cation in a laptop. Metabase is easy to use and its
installation is extremely simple, something very un-
common for a BI solution.
4 ATHLETIC EVENTS RESULTS -
CASE STUDY
In this section, the proposed process is used, in a case
study, to join all the information about the athletics
events results, spread by the several sports associa-
tion websites, integrating this information with infor-
mation about geographical location where the com-
petitions took place and with the information about
atmospheric conditions on which the competitions
were held. This information is then loaded into a
Data Warehouse designed for it and analyzed by using
some of the most well-known analysis algorithms.
Portugal has 20 districts: 18 in mainland Portu-
gal, one on the archipelago of Azores and one on the
archipelago of Madeira. Each district may have sev-
eral sporting associations. Each association publishes
online the results of events organized by itself. There
is no standard format for the files (nor for the tables)
published online.
Geographical location is extracted from Google
Maps API
5
. Meteorological data is extracted from
Weather Underground API
6
. Data from these two
APIs is available freely and is well structured and eas-
ily usable. Files in each sports association’s websites
are mostly available in PDF.
The files provided by each association present the
data in a tabular format without any markup lan-
guage to organize the information. The absence of
apparent structure prevents a large-scale processing
for projects that can not afford outsourcing data entry
jobs (Reitz, 2016). To handle this issue, we decided to
create a module (presented in subsection 4.3) to detect
and extract data from PDF files.
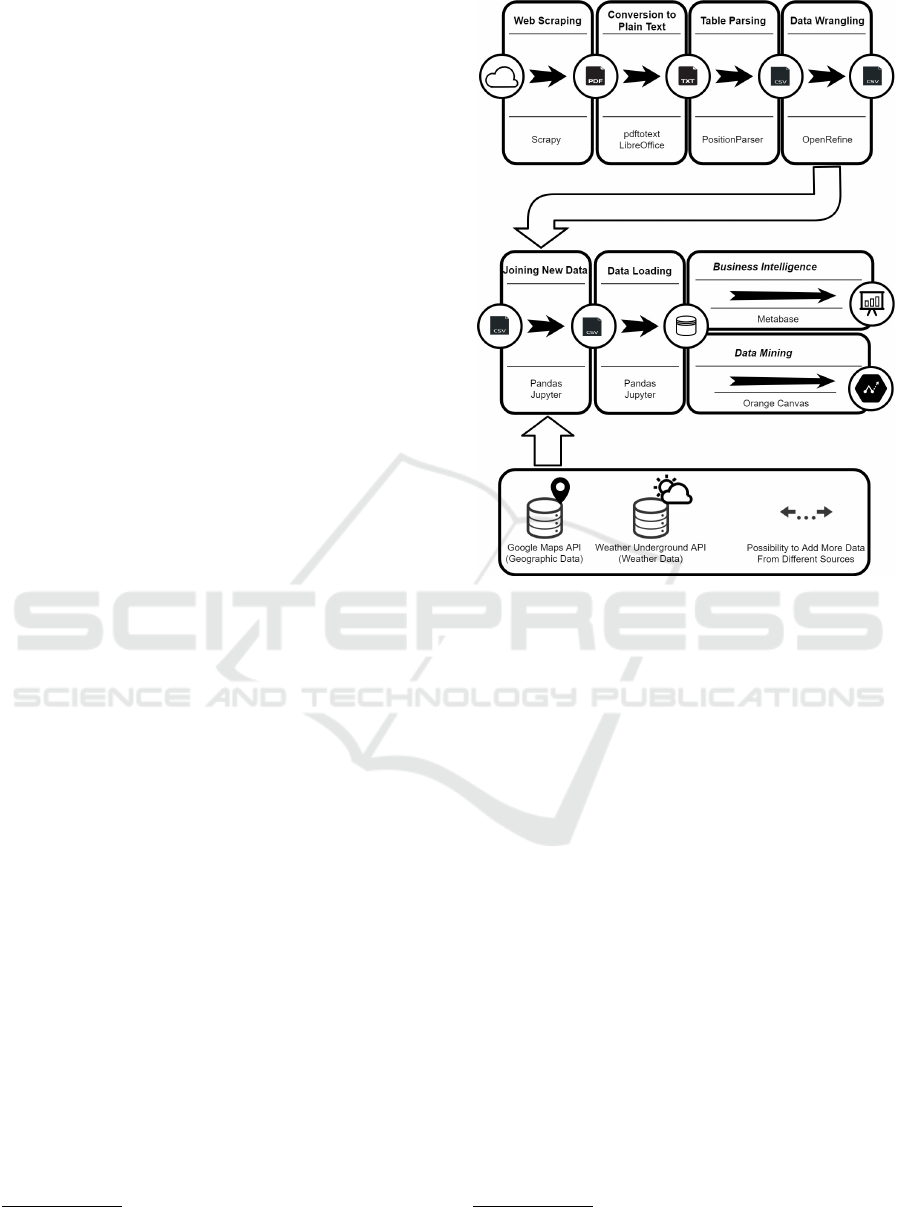
The entire process of data extraction, transforma-
tion and loading is shown in Figure 2, along with the
tools used for each activity of the process.
5
https://cloud.google.com/maps-platform/
6
http://www.wunderground.com/weather/api
Figure 2: Process scheme for athletics results.
4.1 Web Scraping
A web scraper was developed for each district’s ath-
letics association, to find the files links with the athlet-
ics events results, in PDF files, and load them locally.
It was decided to use two tools: Scrapy
7
and Sele-
nium Webdriver
8
. The Scrapy tool is used when the
website does not use JavaScript to load its content. In
other cases Selenium Webdriver is used to simulate a
real web browser.
To check if files are duplicated, or if they have
already been handled previously, MD5 (Message-
Digest algorithm 5) is applied to the contents of each
file. The MD5 message-digest algorithm takes as in-
put a message of arbitrary length and produces as
output a 128-bit “fingerprint” (Deepakumara et al.,
2001). A hash list of files already loaded is retained
to be able to compare with the hash of new files be-
fore the files are processed. Files that are changed,
or updated, are treated the same way as the new ones.
The primary key created in the facts table prevents the
same data from being loaded multiple times (see Fig-
ure 3). When it happens, the values of the record are
updated.
7
https://doc.scrapy.org/
8
https://www.seleniumhq.org/projects/webdriver/
Extraction and Multidimensional Analysis of Data from Unstructured Data Sources: A Case Study
195

4.2 Conversion to Plain Text
The scraped files are converted to the same plain text
format. First all formats (except PDF and plain text)
are automatically converted to PDF format by using
the LibreOffice
9
via command line interface. Then
all PDF files are converted into plain text by using
the pdftotext tool
10
. The pdftotext tool is capable of
converting PDF into plain text files, but this tool has
the advantage of trying to keep the original layout,
which is a mandatory requirement to be parsed by the
PositionParser presented next.
4.3 Table Parsing - The PositionParser
Working with tables stored in pdf files might be noto-
riously difficult (Kazil and Jarmul, 2016), especially
when tables in those files do not have a well-defined
structure. As we saw earlier, there are several tools
capable of extracting textual content from PDF doc-
uments but, in most of the free tools, the result does
not correctly reflect the original structure of the ta-
ble (McCallum, 2012). Additionally, in the athlet-
ics events results case, the tables that needed to be
analyzed, although semantically related, have several
different structures. Considering the lack of solu-
tions found, we decided to create a custom tool. The
tool, is a module developed in Python Language and
we named it as PositionParser. The module gen-
erates a CSV file for each parsed input file. The
PositionParser module allows to: Label information
with their proper attribute name; Visualize labeled
data; Segment the text and define reading order; De-
fine the hierarchy of an attribute; Extract the infor-
mation into machine-readable files, CSV or JSON
(JavaScript Object Notation).
The PositionParser allows enough abstraction
to be applied in slightly different table structures.
The abstraction comes from common characteristics
shared between words, like regular expressions, sim-
ilarity to each other, relative position to each element
and absolute position within the body of the text. With
the help of the PositionParser, a simple algorithm can
be created to extract the information of each set of
files with similar layouts. The tokenization and tag-
ging part of one of those algorithms is shown bellow
as an example:
# tokenization
simple_file = open(input_dir, ’r’)
corpus = simple_file.read()
tokens = tokenize(corpus)
9
https://www.libreoffice.org/
10
http://pdftotext.com/
The result of a tokenized text would be the cor-
pus represented by a list, composed by tokens repre-
sented by tuples, composed with four elements: the
actual word (string), the line position (int), the col-
umn position of the beginning of the word (int) and
label (string).
The regex
11
and absolute position are the word
properties is used to find the initial fields. A combina-
tion of functions are used to expand the field labeling
relative to the already tagged tokens. To segment and
define the reading order the “chop function is used.
4.4 Data Wrangling
To clean, complete and transform the data into a suit-
able format we used the OpenRefine in this case study.
Since the OpenRefine tool does not allow to work
with more than 800.000 lines at a time, the files were
cleaned one sports association at a time.
4.5 Joining New Data
Information about athletics competitions results is in-
tegrated and complemented with geographic informa-
tion, namely the altitude where the competition took
place, and meteorologic data (like temperature, hu-
midity, wind speed/direction, atmospheric pressure,
precipitation and others). The latitude, longitude
and altitude information is obtained from the loca-
tion names (extracted from the PDF files) by using
the Google Maps web API and the meteorologic data
is collected from the previously gathered latitude and
longitude using the Weather Underground web API.
From a technical point of view, the process is
made automatically using the Python module Pan-
das
12
and using the Jupyter application
13
. Pandas is
a software for data manipulation and analysis writ-
ten in Python language. The module Pandas is used
for data manipulation with functions for indexing, ac-
cessing, grouping and joining data with ease (Ken-
neth Reitz, 2016), allowing to append new data from
external APIs to an existing data frame. Jupyter is a
web application that interactively shows and executes
python code, helping programmers to write code ca-
pable of interacting with the final user (Kenneth Reitz,
2016).
11
Regular expression (Regex) is a sequence of characters
that define a search pattern.
12
https://pandas.pydata.org/
13
http://jupyter.org/
ICEIS 2019 - 21st International Conference on Enterprise Information Systems
196
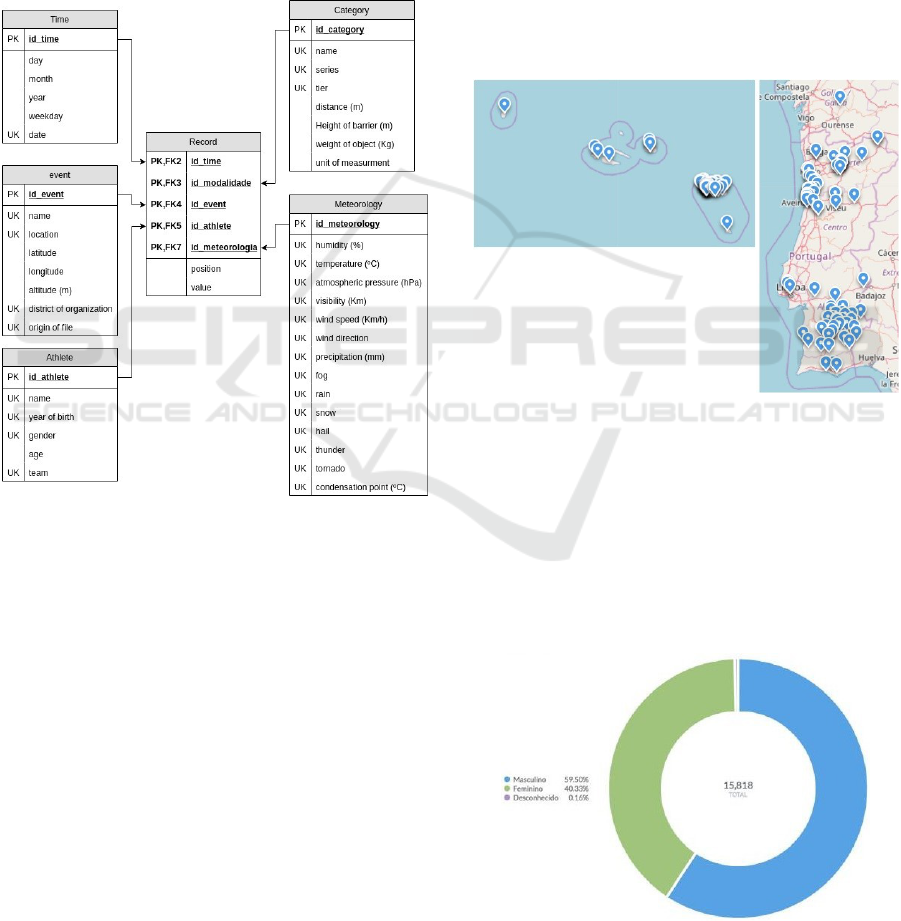
4.6 Loading Data
A DW has been properly designed to receive data
from athletics results. The central fact table is com-
posed by the athletes scores (position and value), sur-
rounded by five dimension-tables, namely: events
(name, location, latitude, longitude, altitude, etc.),
meteorology (temperature, humidity, precipitation,
etc.), category (name, distance, etc.), athlete (name,
gender, age, etc.), and time dimension. The data
warehouse scheme is shown in Figure 3.
Figure 3: DW design model - Star Schema.
For the time dimension the day is the unity with
the lowest level of granularity.
4.7 Data Analysis
The data analysis is done with the Metabase desktop
application for Business Intelligence and with the Or-
ange Canvas software for Data Mining.
Metabase is an open source and easy to use tool
for analytics and BI. This tool makes possible to an-
alyze information in several aspects. In the case of
this project, three main areas are analyzed, the demo-
graphics of athletes (gender and age group), environ-
mental factors (location and altitude) and the athletic
performance of an athlete through time.
Orange is an open source data mining desktop ap-
plication that can also be used as a Python library.
Some data mining algorithms are compared to see
which one is the most reliable at making javelin throw
predictions based on the already obtained data and
which features are the most relevant at making those
predictions.
5 CASE STUDY RESULTS
In this section some of the analysis results are pre-
sented. An indirect BI approach is initially made with
an exploratory analysis of the data, followed by a di-
rect approach where some DM algorithms are tested
for the javelin throw activity in particular. The best
features and DM models are then identified.
Figure 4: Athletic Events Registered by the Project.
A total of 168974 entries have been completely
analyzed (Table Parsing, Data Wrangling and Join-
ing Data). A total of 166277 entries are loaded into
the DW. The files refer to years from 2005 to 2017.
In Figure 4 it is possible to see all the geographical
points where athletics events took place. The regis-
tered events took place all over Portugal, including in
most of the Azores islands.
Figure 5: Athletes by gender.
Extraction and Multidimensional Analysis of Data from Unstructured Data Sources: A Case Study
197
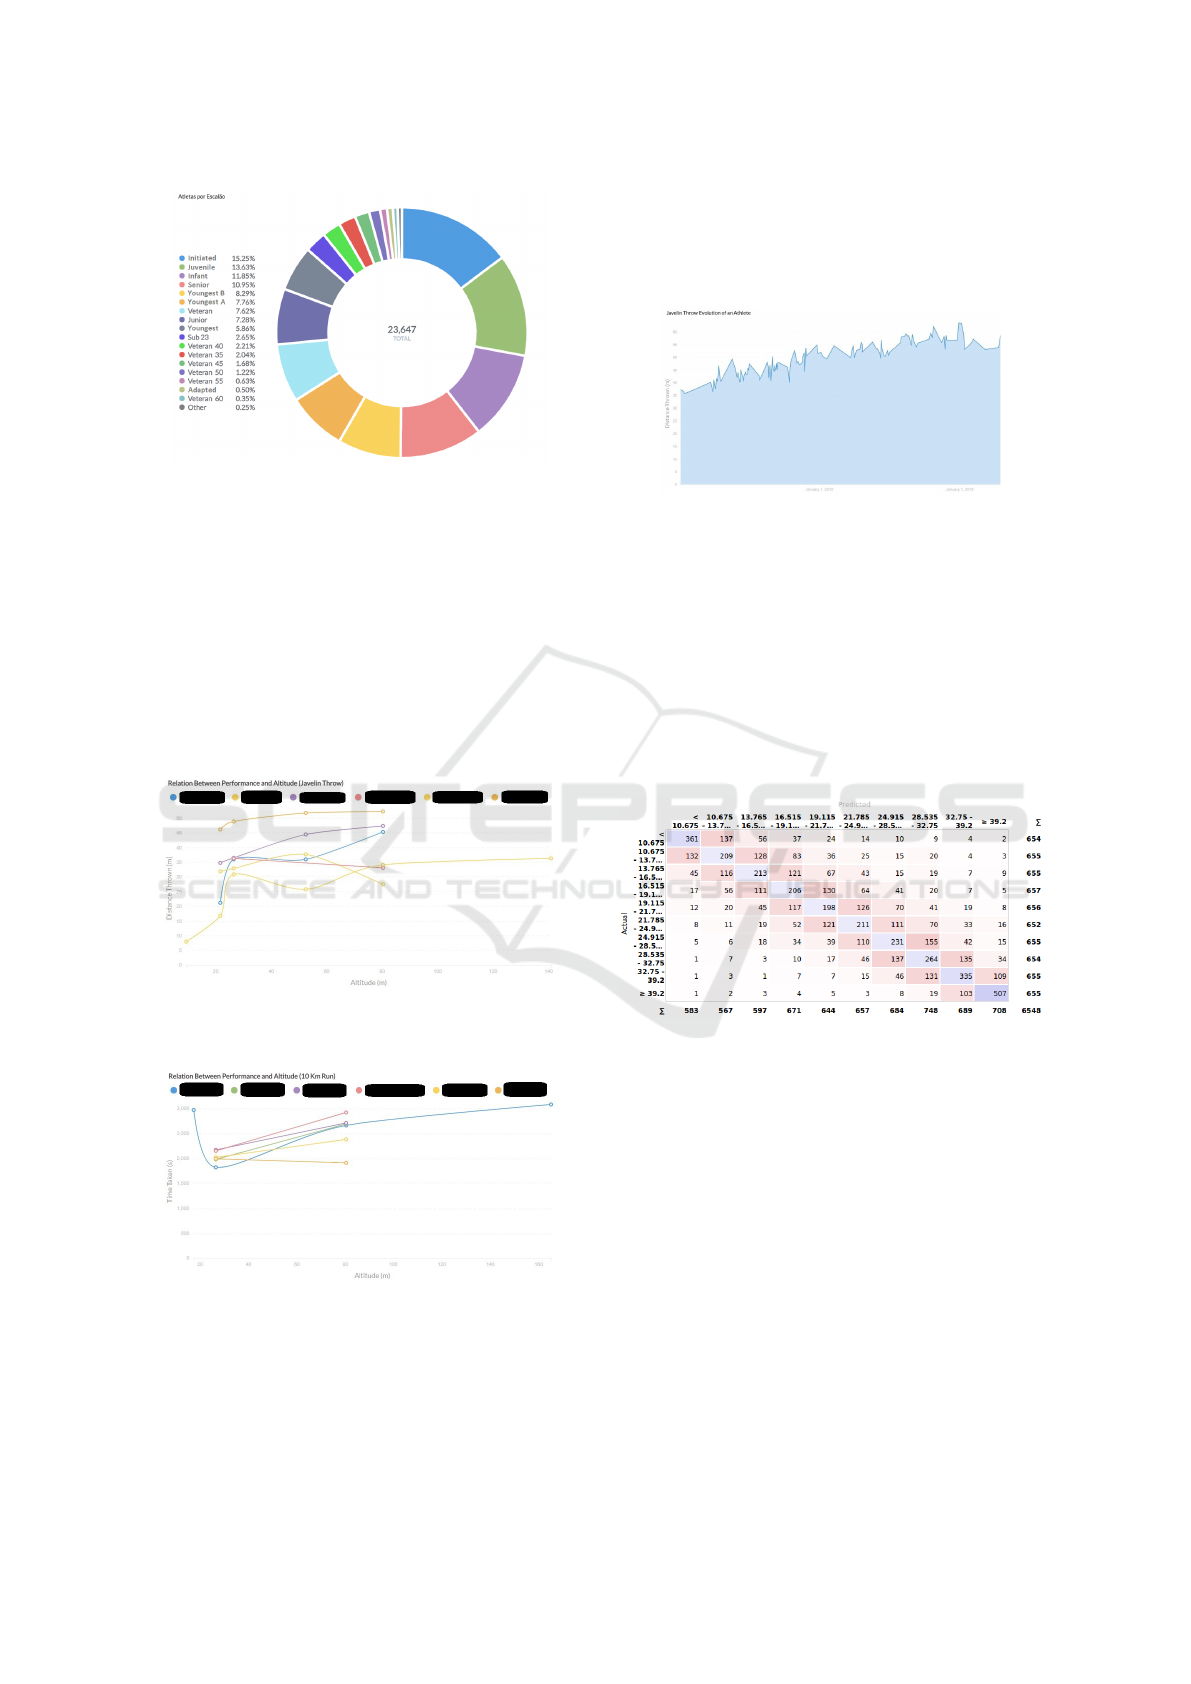
Figure 6: Athletes by age groups.
From the extracted data roughly 60% of the ath-
letes are male and 40% female ((see Figure 5) and
the most common age groups are initiated, juvenile,
infant and senior, with slightly over 50% combined
(seen in Figure 6).
The acquired data is used to analyze the effects of
exterior factors on the performance of 6 undisclosed
athletes: the effects of altitude on the javelin throw (as
seen in Figure 7) and the 10 Km run. The names of
the athletes where omitted for privacy.
Figure 7: Relation Between Performance and Altitude
(Javelin Throw).
Figure 8: Relation Between Performance and Altitude
(10Km Run).
The charts, represented in Figure 7 and in Figure
8, show that the altitude increase has a negative im-
pact in the 10 Km run and a positive one in the javelin
throw, for the study athletes.
The data can also be used to perform BI analysis,
like for example, to follow a single athlete progress
throughout the years along with the location of the
events he/she participate (see Figure 9).
Figure 9: Javelin throw evolution of a particular athlete.
We used eight of the most influential data mining
algorithms and tested them, including the algorithms
Random Forest, kNN, AdaBoost, Naive Bayes, Neu-
ral Network, Logistic Regression, Stochastic Gradient
Descent (SGD) and Support Vector Machine (SVM)
(Wu et al., 2008). Features can also be analyzed to
find which ones are the most reliable. The Neural
Network model shows to be more reliable at making
predictions for this specific case. The truth table of
the Neural Network test can be seen in Figure 10.
Figure 10: Truth Table of the Neural Network Algorithm.
The Neural Network and Logistic Regression
models are the best at predicting the javelin throw ac-
tivity. The features that best help at making predic-
tions are: The athlete; If there was hail that day; The
weight of the javelin; The athletes gender; The ath-
letes team.
The most reliable environment features found are:
If there was hail that day; The athletic event; The ath-
letic events place; The altitude; If there was a thun-
derstorm that day.
6 CONCLUSIONS
In this paper we present a process that allows to de-
tect, extract and treat the information spread over sev-
ICEIS 2019 - 21st International Conference on Enterprise Information Systems
198

eral Web pages and load it into a DW allowing the
analysis of data by different perspectives.
The proposed process was successfully applied to
the case study on the athletics events results. This
case study made available a DW with data about re-
sults of athletic events realized in Portugal in the last
12 years. The results are integrated with data about
the geographic location and atmospheric conditions
in which the competitions took place.
Based on the BI analysis of the information stored
in the DW some conclusions have already been drawn
but further conclusions may be drawn. The process
is being used successfully. The information was up-
loaded into the DW the first time and has been up-
dated a few times. The process is prepared to run
cyclically, detect new files, handle and load the new
data by updating the data in the DW. Additionally, the
process is prepared to be used in other contexts, nev-
ertheless the PositionParser module will need to be
adapted to deal with new type of metadata. The pro-
posed process can be applied in other projects like the
analysis of curriculum information, students grads,
annual reports or scientific articles, etc..
In the future, the data warehouse will continue to
be updated with new files with new competitions re-
sults. The PositionParser module, created to recog-
nize and extract tables from PDF files, may be im-
proved by creating a proper graphical user interface.
REFERENCES
Bienz, T., Cohn, R., and Meehan, J. R. (1997). Portable
document format reference manual. Adobe Systems
Incorporated.
Cruz, E. F., Machado, R. J., and Santos, M. Y. (2014).
Derivation of data-driven software models from busi-
ness process representations. In 9th International
Conference on the Quality of Information and Com-
munications Technology (QUATIC2014), pages 276–
281. IEEE Compute Society.
Cruz, E. F., Machado, R. J., and Santos, M. Y. (2019). On
the rim between business processes and software sys-
tems. In da Cruz, A. M. R. and Cruz, E. F., editors,
New Perspectives on Information Systems Modeling
and Design, pages 170–196. IGI Global.
Deepakumara, J., Heys, H. M., and Venkatesan, R.
(2001). Fpga implementation of md5 hash algo-
rithm. In Canadian Conference on Electrical and
Computer Engineering 2001. Conference Proceedings
(Cat. No.01TH8555), volume 2, pages 919–924 vol.2.
Endel, F. and Piringer, H. (2015). Data wrangling: Mak-
ing data useful again. In International Federation of
Automatic Control Hosting by Elsevier Ltd.
Hassan, T. and Baumgartner, R. (2007). Table recognition
and understanding from pdf files. In Ninth Interna-
tional Conference on Document Analysis and Recog-
nition (ICDAR 2007), volume 2, pages 1143–1147.
Kandel, S., Paepcke, A., Hellerstein, J., and Heer, J.
(2011). Wrangler: Interactive visual specification of
data transformation scripts. In Proceedings of the
SIGCHI Conference on Human Factors in Computing
Systems, CHI ’11, pages 3363–3372, New York, NY,
USA. ACM.
Kazil, J. and Jarmul, K. (2016). Data Wrangling with
Python: Tips and Tools to Make Your Life Easier.
O’Reilly Media, Inc.
Kenneth Reitz, T. S. (2016). The Hitchhiker’s Guide to
Python: Best Practices for Development. O’Reilly
Media, Inc.
Khusro, S., Latif, A., and Ullah, I. (2015). On methods and
tools of table detection, extraction and annotation in
pdf documents. J. Inf. Sci., 41(1):41–57.
McCallum, Q. E. (2012). Bad Data Handbook. O’Reilly
Media, Inc.
Mikolov, T., Chen, K., Corrado, G., and Dean, J. (2013).
Efficient estimation of word representations in vector
space. CoRR, abs/1301.3781.
Mitchell, R. (2018). Web Scraping with Python: Collecting
More Data from the Modern Web. O’Reilly Media,
Inc.
Oro, E. and Ruffolo, M. (2009). Pdf-trex: An approach for
recognizing and extracting tables from pdf documents.
In 2009 10th International Conference on Document
Analysis and Recognition, pages 906–910.
Pennington, J., Socher, R., and Manning., C. (2014). Glove:
Global vectors for word representation. In Proceed-
ings of the 2014 conference on empirical methods in
natural language processing (EMNLP).
Pitale, S. and Sharma, T. (011). Information extraction tools
for portable document format.
Santos, M. Y. and Costa, C. (2016). Data warehousing in big
data: From multidimensional to tabular data models.
In Proceedings of the Ninth International C* Confer-
ence on Computer Science & Software Engineering,
C3S2E ’16, pages 51–60, New York, NY, USA. ACM.
Santos, M. Y. and Ramos, I. (2006). Business Intelligence:
Tecnologias da informao na gesto de conhecimento.,
volume 1. FCA-Editora de Informtica, Lda.
Shi, T. and Liu, Z. (2014). Linking glove with word2vec.
CoRR, abs/1411.5595.
Vargiu, E. and Urru, M. (2013). Exploiting web scraping in
a collaborative filteringbased approach to web adver-
tising. Artificial Intelligence Research.
Wu, X., Kumar, V., Quinlan, J. R., Ghosh, J., Yang, Q., Mo-
toda, H., McLachlan, G. J., Ng, A., Liu, B., Yu, P. S.,
Zhou, Z.-H., Steinbach, M., Hand, D. J., and Stein-
berg, D. (2008). Top 10 algorithms in data mining.
Knowledge and Information Systems, 14(1):1–37.
Yildiz, B., Kaiser, K., and Miksch, S. (2005). pdf2table: A
method to extract table information from pdf files. In
IICAI.
Yin, S., Li, X., Gao, H., and Kaynak, O. (2015). Data-
based techniques focused on modern industry: an
overview. Industrial Electronics, IEEE Transactions
on, 62(1):657–667.
Extraction and Multidimensional Analysis of Data from Unstructured Data Sources: A Case Study
199
