
A Smart Product Co-design and Monitoring Framework Via
Gamification and Complex Event Processing
Spyros Loizou
1
, Amal Elgammal
2
, Indika Kumara
3
, Panayiotis Christodoulou
1
,
Mike P. Papazoglou
3
and Andreas S. Andreou
1
1
Department of Computer Engineering and Informatics, Cyprus University of Technology, Limassol, Cyprus
2
Department of Computers & Information, Cairo University, Egypt
3
Department of Economics and Management, Tilburg University, The Netherlands
panayiotis.christodoulou@edu.cut.ac.cy, mikep@uvt.nl
Keywords: Product-service Systems, Smart Product, Customization, Product-oriented Configuration Language, PoCL,
Gamification, PSS Monitoring, Complex Event Processing.
Abstract: In the traditional software development cycle, requirements gathering is considered the most critical phase.
Getting the requirements right early has become a dogma in software engineering because the correction of
erroneous or incomplete requirements in later software development phases becomes overly expensive. For
product-service systems (PSS), this dogma and standard requirements engineering (RE) approaches are not
appropriate because classical RE is considered concluded once a product service is delivered. This paper
proposes a novel framework that enables the customer and the product engineer to co-design smart products
by integrating three novel and advanced technologies to support: view-based modelling, visualization and
monitoring, i.e., Product-Oriented Configuration Language (PoCL), gamification and Complex Event
Processing (CEP), respectively. These create a “digital-twin” model of the connected ‘smart’ factory of the
future. The framework is formally founded on the novel concept of manufacturing blueprints, which are
formalized knowledge-intensive structures that provide the basis for actionable PSS and production
“intelligence” and a move toward more fact-based manufacturing decisions. Implementation and validation
of the proposed framework through real-life case studies are ongoing to validate the applicability, utility and
efficacy of the proposed solutions.
1 INTRODUCTION
Industry 4.0 is progressively transitioning
conventional factories to smart components and smart
machines to enable an ecosystem of connected digital
factories. A key enabler of Industry 4.0 is the “digital-
twin” model of the connected ‘smart’ factory of the
future, where computer-driven systems create a
virtual copy of the physical world and help make
decentralized decisions with much higher degree of
accuracy (Grieves, 2014).
The digital-twin approach enables manufacturers
to overlay the virtual, digital product on top of any
physical product at any stage of production on the
factory floor, and analyze its behavior so that product
designers and engineers can make informed choices
about materials and processes using visualization
tools, e.g., 3D CAD/CAM tools, during the design
stages of a digital product and immediately see the
impact on a physical version of the product. The
ability to combine the digital-twin approach with
support for smart products, improved processes and
empowerment of human operators is the key to
unlocking the real underlying value of Industry 4.0.
A few recent studies (Sierla et al., 2018; Schluse
et al., 2018; Lu and Xu, 2018; Ameri and Sabbagh,
2016; Nee et al., 2012; Berg and Vance, 2017) have
applied the digital-twin approach and visualization
tools to support product design, production process
monitoring and control, and product services, such as
maintenance. However, these studies still suffer from
severe drawbacks. First, they do not provide an
integrated and comprehensive digital-twin approach
to support the complete smart product lifecycle from
the stages of requirements elicitation, product design,
customization, and production monitoring. Second,
they lack the integration of product, service and
production-related knowledge with advanced
visualization support. Finally, these approaches lack
intuitive user-friendly interfaces that expedite a
Loizou, S., Elgammal, A., Kumara, I., Christodoulou, P., Papazoglou, M. and Andreou, A.
A Smart Product Co-design and Monitoring Framework Via Gamification and Complex Event Processing.
DOI: 10.5220/0007720902370244
In Proceedings of the 21st International Conference on Enterprise Information Systems (ICEIS 2019), pages 237-244
ISBN: 978-989-758-372-8
Copyright
c
2019 by SCITEPRESS – Science and Technology Publications, Lda. All rights reserved
237

particular activity (e.g., product customization), and
do not use emergent advanced techniques such as
gamification for improving the user engagement in
different activity.
To address the aforementioned limitations in the
existing works, the research presented in this paper
realizes the digital-twin approach to support the key
phases in the lifecycle of a smart PSS (product-
service system). In our earlier work (Papazoglou and
Elgammal, 2018), we have introduced the PSS
lifecycle. It provides a closed monitoring feedback
loop that enables continuous product and service
improvements based on the novel concept of
manufacturing blueprints, which formally captures
product-service and production-related knowledge
(Papazoglou and Elgammal, 2017; Papazoglou and
Elgammal, 2015). Blueprints integrate dispersed
manufacturing data from diverse sources and
locations, which includes and combines business
transactional data and manufacturing operational data
to gain full visibility and control, and provides the
basis for production actionable “intelligence”.
The proposed framework considers smart product
ideation and customization, as well as monitoring of its
actual production. The framework consists of an
integrated product designer component and a
monitoring Dashboard, which enables the customer, in
collaboration with the product designer/engineer, to
co-design customized PSS via a unique gamification
experience. The user-friendly 3D product designer
component offers a fancy gaming experience during
the product design and customization process. To
enable on demand PSS customization and a customer-
centric approach, the PSS lifecycle supports
complementary stakeholders’ perspectives by making
use of a novel Product-oriented Configuration
Language (PoCL) (Elgammal et al., 2017). Utilizing
PoCL in conjunction with gamification, customers, in
collaboration with product designers, can specify the
desired product and service characteristics. The
monitoring Dashboard displays the products,
machines, sensors and other artefacts in a dedicated
interactive interface, and is able to provide a 3D
representation of the graphical objects. The Dashboard
also serves as a mediator between the shift in-charge or
control room manager / operator, who supervises and
monitors the manufacturing process, and the factory-
floor environment. The monitoring framework utilizes
CEP technology (Etzion and Niblett, 2010), which is
event-based processing that combines data from
multiple sources, to infer events or patterns that suggest
more complicated circumstances. Implementation and
validation of the proposed framework through a real-
world case study (taken from the H2020 ICP4Life EU
Project) is performed to validate the applicability,
usability and efficacy of the proposed solutions.
The remainder of the paper is structured as
follows: Section 2 discusses related efforts in the
areas of digital-twin and visualization approaches for
production co-design and production process
monitoring. Section 3 presents the proposed PSS co-
design framework via PoCL, gamification and CEP.
This is followed by presenting the current implement-
tation efforts in Section 4 Finally, Section 5 concludes
the paper and highlights future work directions.
2 RELATED WORK
We consider related studies from the two key research
issues in this paper, that is, digital-twin, and
visualization platforms for product co-design and
shop floor monitoring.
2.1 Digital-Twin
Tao et al. (2018) proposed a framework that utilizes
the raw data from the physical product and its digital-
twin to support product design, production, and
services, such as maintenance. Sierla et al. presented
the concept of digital-twin centric control, where the
digital twin derived from a product model creates
assembly plans, and orchestrates the resources in a
production cell. Schluse et al. (2018) introduced the
concept of experimentable digital-twins, which are
model-based simulations of digital-twins. The studies
in (Lu and Xu, 2018; Ameri and Sabbagh, 2016) use
ontologies to represent the resources in a factory-floor
to create their digital-twins.
As opposed to these works that mostly consider
only limited aspects of the Product Lifecycle Manage-
ment (PLM), the approach presented in this paper is
built on top of the manufacturing blueprints approach
(Papazoglou and Elgammal, 2017; Papazoglou and
Elgammal, 2015) that enables an integrated and
comprehensive digital-twin approach to support the
complete smart product lifecycle from the stages of
requirements elicitation by means of the Product-
oriented Configuration Language (PoCL), to product
design, customization, and production planning.
2.2 Visualization Platforms for Product
Co-Design
According to the recent reviews of the related
literature (Nee et al., 2012; Berg and Vance, 2017),
the advanced visualization technologies, such as
ICEIS 2019 - 21st International Conference on Enterprise Information Systems
238

virtual/augmented reality and 3D CAD/CAM, have
been used in collaborative manufacturing
environments to support such activities as product
inception, co-design, production planning, and
maintenance. However, overall, they have several key
limitations. First, they lack the integration of
product-service and production-related knowledge
with their visual supports. Such knowledge can
enable consistency checking of visual models, and
support informed decision making during a particular
user activity (e.g., product design and customization)
(Rocca, 2012; Chandrasegaran et al., 2013). Second,
these approaches lack intuitive user-friendly
interfaces that expedite a particular activity (e.g., a
user interface tailored to product customization).
They also do not apply the techniques for improving
the user engagement in the activity, such as
gamification. Several recent works have concluded
that gamification in manufacturing environments can
improve the quality of the work and the performance
of the users/workers (Korn and Schmidt, 2015).
To overcome the above key limitations in the
current literature, the visualization platform presented
in this paper utilizes the blueprinting approach that
readily supports production-related activities ranging
from the conception and configuration of a
customized product all the way to planning and
digital production, by gathering, storing and
processing “smart actionable data” from every point
of the product lifecycle. Moreover, the user-friendly
PoCL helps customers to collaboratively and visually
create, validate and optimize manufacturing design
plans with product designers/engineers, augmented
by gamified 3D CAD/CAM interactive capabilities.
2.3 Visualization Platforms for Shop
Floor Monitoring
A few studies have used complex event processing
(CEP) for monitoring and control of production
processes in the factory-floor (Grauer et al., 2011;
Babiceanu and Seker, 2016; Estruch and Heredia,
2012; Izaguirre, Lobov and Lastra, 2011). Grauer et
al. (2011) used CEP to perform real-time monitoring
and control of processes in manufacturing enterprises.
The data is collected from different automation
systems in real-time. The CEP engine detects
complex events (e.g. alarms) from this raw data, and
the dedicated tools visualize the detected complex
events. Estruch and Álvaro proposed a generic
architecture for event-driven manufacturing process
management (EDMPM). It consists of three main
layers: connectivity layer (to enable communication
with existing information systems in the enterprise),
process execution layer (to enact event-driven
manufacturing processes) and a user interface layer
(to support customizable KPIs visualization and
analysis). Izaguirre et al. used CEP to support the
interoperability of the events generated using two
different standards for device communication
protocols by the devices at the factory-floor.
In comparison with the above works, this paper
proposes a platform that applies CEP to derive the
meaningful production process events (e.g., anomaly-
detected event) from the raw sensor data at the
factory-floor, and visualize such events in an
interactive Dashboard. Moreover, we use the
integrated and formalized knowledge (i.e.,
manufacturing blueprints) related to product-service,
and production to drive the production monitoring.
3 SMART PRODUCT CO-DESIGN
AND MONITORING
FRAMEWORK
The proposed framework is shown schematically in
Figure 1. It is firstly concerned with smart product
ideation and customization (upper left hand-side of
figure). This is achieved through the integration of a
set of interplaying advanced technologies including
the novel PoCL that we have previously introduced in
our previous work (reference omitted for blind
review) and gamification. The framework also
supports monitoring of actual requested customized
product production based on CEP and provides an
interactive graphical Dashboard (lower part of Figure
1). More specifically, a user-friendly graphical
gamification tool, which is based on PoCL, is
proposed that allows a user to define in collaboration
with the product designer customized smart product
requirements. In the next sub-sections, the smart
product ideation and customization based on PoCL
and gamification is first discussed, followed by its
integrated monitoring approach.
3.1 Smart Product Ideation and
Customization
PoCL is a model-based user-friendly Domain-
Specific Language (DSL) that helps customers to
collaboratively create, validate and optimize
manufacturing design plans concurrently with
product/service designers during the stages of the
requirement elicitation process. PoCL is a view-based
modelling language that supports different
stakeholders by tailor-made interfaces at varying
A Smart Product Co-design and Monitoring Framework Via Gamification and Complex Event Processing
239

Figure 1: Proposed Smart product co-design and monitoring framework.
levels of abstraction that support the associated user
profile. In essence, PoCL allows customers to
imagine and gradually create a virtual product,
amplifying their ideas and clearing the way to better
design and innovation.
PoCL supports the following: (i) Digital product
features framing, which focuses on collation of
product ideas that can inspire new and innovative
products by supporting unique extensions and
adaptations of base products to create customizable
ones; (ii) Progressive product configuration sketching
and framing, which defines the requirements of the
products, produces prototypes by managing product
parameters and evaluates the cost implications of
potential design improvements.
PoCL and its gaming counterparts are formally
founded on the novel concept of the widely tested and
validated manufacturing blueprints (blueprints for
short, which we have previously introduced in
(references omitted for blind review). Manufacturing
blueprints semantically capture product-service and
production-related knowledge. Manufacturing
blueprints rely on model-based design techniques to
manage and inter-link product data and information
(both its content and context), product portfolios and
product families, manufacturing assets (personnel,
plant machinery and facilities, production line
equipment), and, in general, help meet the
requirements (functional, performance, quality, cost,
time, etc.) of an entire manufacturing network. This
information can be collated and put within a broader
operational context, providing the basis for
manufacturing actionable “intelligence” and a move
toward more fact-based decisions.
The information in the Blueprints describes,
through ontological forms, the setting of the
machinery at the factory-floor, machines’
capabilities, their sensors and actuators. Blueprints
also offer a way to define certain properties for a
customized product. The latter is used to query and
match the description of the desired product with
existing Blueprints in the repository so as to retrieve
Blueprint product instances stored that are very close
to, or relevant with the desired customization
(represented by the input arrow named “Retrieve all
knowledge for products” in Figure 1). This could
include, for example, components and their
composition, relationships between components,
materials, services (including sensors and their
relationships), etc.
The outcome of the “Customization via
gamification” component is a new “Customer Smart
Product Request” in the format of the adopted
gamification technology/engine. The smart product
request is then transformed into Blueprints
representation (an OWL representation; details are
found in (references omitted for blind review) using a
“transformation engine”, which is eventually stored
in the Blueprints Repository.
The integration of the Manufacturing Blueprint
Data Model with PoCL embodies production-domain
knowledge along with the rules of what type of
knowledge must be recorded about each
manufacturing element, how these elements can be
ICEIS 2019 - 21st International Conference on Enterprise Information Systems
240

connected and how this knowledge can be
aggregated, conserved and reused.
3.2 Smart Product Monitoring
The proposed Dashboard serves as a mediator between
the shift in-charge or control room manager/operator,
who supervises and monitors the whole manufacturing
process, and the factory-floor environment. In this
context, this person is able to define for each machine,
and each sensor installed in a machine, the type of
values it collects, their timing (frequency) and, most
importantly, some monitoring rules and actions based
on threshold values (minimum, or maximum, or both),
which are set to denote ranges of normal operation. The
sensors continuously gather information (e.g.
temperature, pressure, humidity etc.) which is then
compared in real-time against the normal operation
thresholds. In case a deviation is observed from
‘normality’, an alerting process is initially triggered
which produces certain types of alerts to notify the
person in charge that one or more anomalies are
detected at the factory-floor.
This monitoring process, as shown right bottom
hand-side of Figure 1, is enabled by utilizing and
integrating CEP technology. Thus, this process takes
advantage of CEP’s event processing capabilities to
combine data from multiple sources and infer events
or patterns that suggest more complicated
circumstances. The detection of a violation of any of
the defined monitoring rules (and/or thresholds), that
are stored and maintained in the Blueprints repository
may trigger an alerting process, as well as the (semi)
automatic execution of appropriate response action(s)
defined for the same type of violation.
This could be in the simplest case confined to sending
an alarm signal to the operator (displayed on the
Dashboard), and in a more automated/sophisticated
manner, extended to sending signals/actions/controls
to the factory-floor that drive the actuators on the
machines. For example, a possible action as a response
to the detection of a rise in temperature for a welding
machine (as compared to the defined threshold), is to
send a signal to the actuators at the factory-floor to
turn-on specific ventilation or air-conditioning
machinery to cool the place and lower the temperature.
This work currently implements the definition of
the threshold values and the actions to be taken when
emergency cases arise, and assumes that the
execution of these actions is handled by another
(existing) module, the latter being the subject of
another research work by the authors.
4 IMPLEMENTATION
This section presents a demonstration example where
the framework/approach described in section 3 is
applied on a real-world use case. The customization-
gamification process is developed in the Unreal
Engine environment (https://www.unrealengine.
com) Realizing PoCL with gamification offers a
fancy gaming experience during the product
customization process, which significantly improves
the quality of experience of the involved
stakeholders. The graphical Dashboard (as shown in
Figure 2: Dashboard functionality allowing gamified customization in Unreal Engine.
A Smart Product Co-design and Monitoring Framework Via Gamification and Complex Event Processing
241

Figure 3: Customer’s Dashboard for sensor and connection to the machine.
figure 2) displays the products, machines, sensors and
other artefacts in a dedicated interactive interface, and
it is able to provide a 3D representation of the
graphical objects.
The Dashboard offers a set of simple and
ergonomic graphical actions with which a potential
customer finalizes the details of customization when
ordering a new product.
Firstly, as presented in Figure 2, in order to add a
new machine in the system (the product to be ordered
and developed in this case is a machine) a user
(customer) must first select the “Machines” from the
list of the main categories (left sub-figure) and then
define its type (right sub-figure). For the purposes of
our demonstration we have set-up three types of
machines, a CO2 Laser, a Laser Cutter and a Drilling
Machine. Once a machine is added into the system the
user is able to view it in 3D, set its properties, rotate
it, change its skeleton, change its colour etc.
In the next step shown in figure 3, a user wishes
to add certain sensors on a specific machine. In order
to do so (s)he must first select the operation “Sensors”
from a list of main functional categories (left sub-
figure) and then specify the type of sensor, its
thresholds and the machine the specific sensor
operates on (right sub-figure). In our example four
types of sensors with certain properties were defined:
a “Temperature” sensor, with a minimum value of
30°C and a maximum value of 100°C, a “Humidity”
sensor with minimum value of 40%RH and a
maximum value of 80%RH, a “Motion” sensor with
minimum distance of 1m and maximum distance of
15m (denoting the range of distance covered to detect
motions) and a “Light” sensor with start-time set to
21:00pm and end-time to 07:00am (this is the time
frame for the light sensor to perform its action: when
the Motion sensor detects a movement and the time
recorded is within the range of the Light sensor then
a light goes-on; as long as no movement is detected,
the light sensor remains inactive).
Figure 4: An example in xml of the product request
generated by the Unreal Engine.
Figure 4 outlines the data extracted from the
Unreal Engine according to the demonstration
example. First, the data is translated into an OWL
representation and then using PoCL it is converted
into Blueprints. As mentioned in the Methodology
section, users have the ability to process the sensor
Figure 5: Creating an execution plan by using a query.
ICEIS 2019 - 21st International Conference on Enterprise Information Systems
242
fields defined in the previous steps and create
execution plans based either on certain queries, as
presented in figure 5, or by creating their own
scenario without having to write a query, as shown in
figure 6.
Figure 6: Alterative way for creating a scenario.
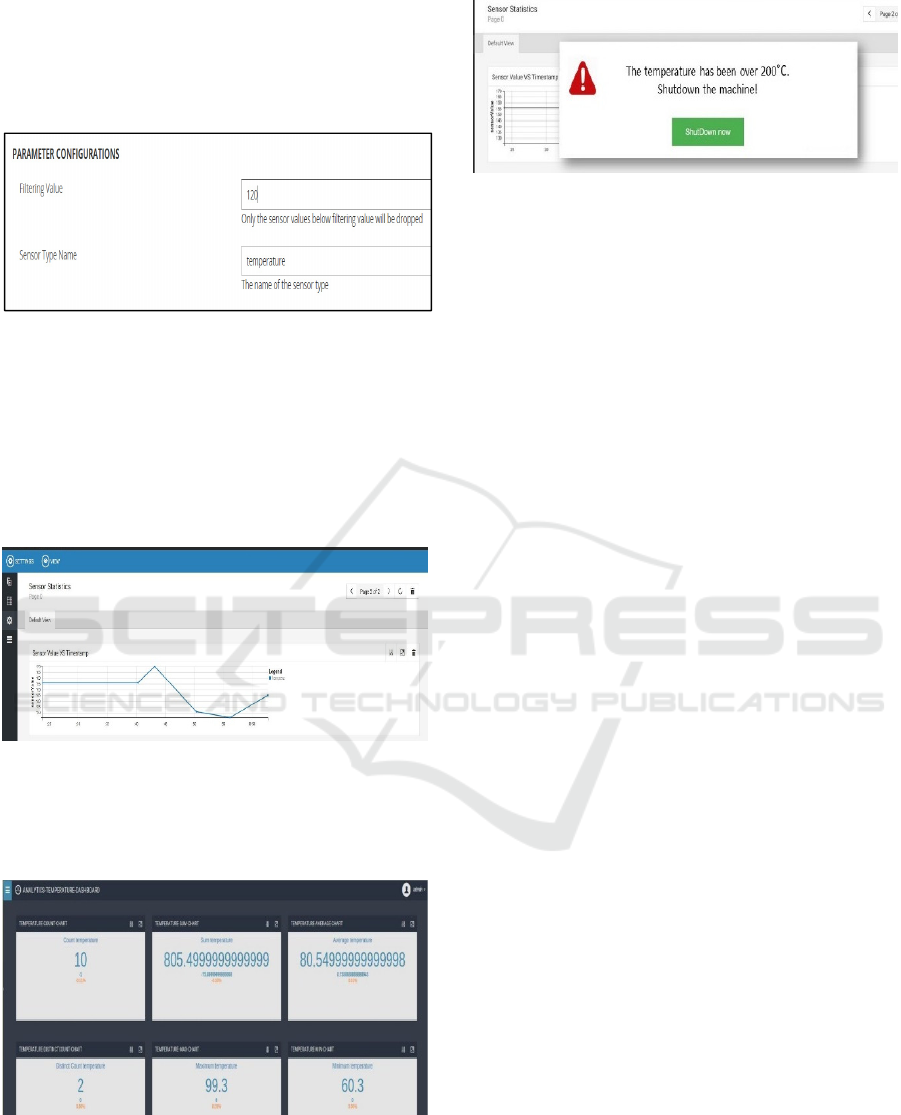
Figure 6 presents the alterative, easier way for
creating a scenario in which the user defines sensors
and threshold values through dedicated GUI forms.
Once the scenario is created, the associated graph
appears as a result of that scenario, as shown in figure
7; the graph displays temperature sensor values above
100°C.
Figure 7: A scenario which displays all temperature sensor
values that are greater than 100°C.
Statistical information is also displayed on the
Dashboard screen as depicted in figure 8.
Figure 8: Statistics Dashboard about real-time values from
temperature sensor.
Figure 9: Notification alert for temperature value greater
than 200°C and action confirmation.
Finally, the case of a notification alert popping-up
on the Dashboard screen and requiring the shift
manager to confirm the action related to this alert is
presented in figure 9.
5 CONCLUSIONS AND FUTURE
WORK
The present paper introduced a new framework that
facilitates smart product ideation and customization,
and provides the means for monitoring the production
process. The framework offers the ability to a
customer to co-design customized PSS via a unique
gamification experience and also integrates with a
Product-oriented Configuration Language to specify
product and service characteristics. A dedicated
interactive monitoring Dashboard displays products,
machines, sensors and other artefacts using a 3D
graphical representation. The Dashboard essentially
connects the control room manager/operator with the
factory-floor environment and assists in the
supervision and control of the manufacturing process
utilizing CEP technology. The latter supports event-
based processing by combining data from the various
sources at the factory-floor. The proposed framework
is being demonstrated and validated using a real-
world case study in terms of applicability, usability
and efficiency.
Future work will concentrate on: (i) (semi-)
automating recovery actions by seeding self-
adaptiveness and self-healing capabilities into the
monitoring component of the framework, moving
towards the vision of self-autonomous smart factory,
and (iii) augmenting the Dashboards with
sophisticated visualization features by supporting
augmented and virtual reality, and (iii) designing and
developing advanced querying and
recommendations/matching capabilities, which will
assist the re-usability of previous customization
efforts during the smart product ideation phase.
A Smart Product Co-design and Monitoring Framework Via Gamification and Complex Event Processing
243

ACKNOWLEDGEMENTS
This paper is part of the outcomes of the Twinning
project Dossier-Cloud. This project has received
funding from the European Union’s Horizon 2020
research and innovation programme under grant
agreement No 692251.
REFERENCES
Grieves, M. (2014). "Digital twin:
Manufacturingexcellence through virtual factory
replication (While paper)," University of Michigan
Sierla, S., Kyrki, V., Aarnio, P., and Vyatkin, V. (2018)
"Automatic assembly planning based on digital product
descriptions," Computers in Industry, vol. 97, pp. 34-
46.
Schluse, M., Priggemeyer, M., Atorf, L., and Rossmann, J.
(2018). "Experimentable Digital
Twins—Streamlining Simulation-Based
Systems Engineering for Industry 4.0," IEEE
Transactions on Industrial Informatics, vol. 14, no. 4,
pp. 1722-1731.
Lu, Y. and Xu, X. (2018). "Resource virtualization: A core
technology for developing cyber-physical production
systems," Journal of Manufacturing Systems, vol. 47,
pp. 128-140.
Ameri, F. and Sabbagh, R. (2016). "Digital Factories for
Capability Modeling and Visualization," in Advances in
Production Management Systems. Initiatives for a
Sustainable World, Cham, pp. 69-78: Springer
International Publishing.
Nee, A. Y. C., Ong, S. K., Chryssolouris, G. and Mourtzis,
D. (2012). "Augmented reality applications in design
and manufacturing," CIRP Annals, vol. 61, no. 2, pp.
657-679.
Berg, L. P., and Vance, J. M. (2017). "Industry use of
virtual reality in product design and manufacturing: a
survey," Virtual Reality, vol. 21, no. 1, pp. 1-17.
Papazoglou, M. P., Elgammal, A., & Krämer, B. J. (2018).
Collaborative on-demand Product-Service Systems
customization lifecycle. CIRP Journal of
Manufacturing Science and Technology.
Papazoglou, M., & Elgammal, A. (2017). The
Manufacturing Blueprint Environment: Bringing
Intelligence into Manufacturing. Paper presented at the
IEEE International Conference on Engineering,
Technology and Innovation (ICE), Portugal.
Papazoglou, M., Heuvel, W. J. V. D., & Mascolo, J. (2015).
Reference Architecture and Knowledge-based
Structures for Smart Manufacturing Networks. IEEE
Software, PP(99), 1-1.
Elgammal, A., Papazoglou, M., Krämer, B., &
Constantinescu, C. (2017). Design for Customization:
A New Paradigm for Product-Service System
Development. Paper presented at the The 9th CIRP
IPSS Conference: Circular Perspectives on
Product/Service-Systems, Denmark.
Etzion, O., and Niblett, P. (2010). Event Processing in
Action. Manning Publications Co., p. 325.
Tao, F., Cheng, J., Qi, Q., Zhang, M., Zhang, H., and Sui,
F. (2018). "Digital twin-driven product design,
manufacturing and service with big data," The
International Journal of Advanced Manufacturing
Technology, vol. 94, no. 9, pp. 3563-3576.
Rocca, G. L. (2012). "Knowledge based engineering:
Between AI and CAD. Review of a language based
technology to support engineering design," Advanced
Engineering Informatics, vol. 26, no. 2, pp. 159-179.
Chandrasegaran, S. K., et al. (2013). "The evolution,
challenges, and future of knowledge representation in
product design systems,"
Computer-Aided Design, vol.
45, no. 2, pp. 204-228.
Korn, O., and Schmidt, A. (2015). "Gamification of
Business Processes: Re-designing Work in Production
and Service Industry," Procedia Manufacturing, vol. 3,
pp. 3424-3431.
Shi, V. G., Baldwin, J., Ridgway, K., and Scott, R.
"Gamification for servitization a conceptual paper,"
FRAMEWORKS AND ANALYSIS, p. 114.
Grauer, M., Karadgi, S., Metz, D., and Schäfer, W. (2011).
"Online Monitoring and Control of Enterprise
Processes in Manufacturing Based on an Event-Driven
Architecture," in Business Process Management
Workshops, Berlin, Heidelberg, pp. 671-682.
Babiceanu, R. F., and Seker, R. (2016) "Big Data and
virtualization for manufacturing cyber-physical
systems: A survey of the current status and future
outlook," Computers in Industry, vol. 81, pp. 128-137.
Estruch A., and Heredia Álvaro, J. A. (2012). "Event-
Driven Manufacturing Process Management
Approach," in Business Process Management, Berlin,
Heidelberg, pp. 120-133..
Izaguirre, M. J. G., Lobov, A., and Lastra, J. L. M. (2011)
"OPC-UA and DPWS interoperability for factory floor
monitoring using complex event processing," in 2011
9th IEEE International Conference on Industrial
Informatics, pp. 205-211.
ICEIS 2019 - 21st International Conference on Enterprise Information Systems
244
