
Energy Modelling in Rural Areas with Spatial and Temporal Data in
Germany and Czech Republic
Jane Wuth, Javier Valdes, Luis Ramirez Camargo and Wolfgang Dorner
Institute for Applied Informatics, Technology Campus Freyung, Technische Hochschule Deggendorf,
Grafenauer Straße 22, 94078 Freyung, Germany
Keywords: Geographical Information Systems, Spatiotemporal Data, Renewable Energies, Energy Transition and
Electric Vehicles.
Abstract: One of the major challenges for the energy transition is to reconcile variable renewable energy production
with stochastically changing energy demand including the pursued changes in e.g. transport like electro
mobility. This requires smart systems that should be designed to minimize balancing and transmission costs.
The design and modelling of such systems requires high resolution energy generation and demand data, which
usually either do not exist or is not available. Methodologies to address this lack of data populate scientific
literature but its replicability is limited by an inadequate level of detail in the description of the methodologies
and to a larger extent by the absence or low quality of basic data. This manuscript summarizes several years
of research in energy modelling using Geographical Information Systems as well as spatial and temporal data
of the rural areas in Bavaria (Germany) and the Czech Republic. Data requirements for energy demand and
energy supply including different types of users and technologies are addressed. Irreconcilable data gaps are
presented, examples to fill data gaps as well as recommendations for future necessary developments are
provided.
1 INTRODUCTION
When analysing energy demand and supply in large
areas, especially the exact localization is of major
importance. This is especially true when considering
renewable energies. They are less predictable in their
production outputs than fossils and thus may induce
great instability for the grid. (see, e.g., Passey et al.,
2011). Furthermore, user related changes, the
promotion of electro mobility, the increased use of
electricity as primary source of energy and migration
from the land induce an increased electric energy need
for a shrinking number of citizens when considering
rural regions (Valdes et al., 2019). The question raised
for every community and regional government facing
depopulation issues is therefore, how to tackle these
rising issues by simultaneously minimizing costs of
investments. The more detailed one could assess the
current demand and supply capabilities, the current
load of the electric grid as well as surrounding factors,
the better forecasts and alternative scenarios for a cost
efficient and sustainable development can be
implemented. The results of such models are
indispensable for regional planners, utilities and policy
makers in order to plan future energy supply in a cost
efficient and consumer friendly way.
High spatial resolution data of grid loads and
capacity measures as well as electric energy
consumption by different sectors are important factors
to be considered. Current trends need to be evaluated
by estimating its future impacts. One such major trend
of today, is the introduction of electro mobility which
is pursued by almost every country, and as a
consequence uncoordinated charging events of electric
vehicles might have negative impacts on the resilience
and economics of an electrical system (Mu et al.,
2014). Uncontrolled charging load of electric vehicles
can generate, among others, voltage drops that degrade
the power quality of electricity distribution systems
(Foley et al., 2013). Therefore, the placement, sizing
and supply of infrastructures such as electric vehicles
charging stations needs to be carefully assessed.
Throughout the past years, research questions
related to above mentioned topics were addressed
manifold and in an incremental way in international
scientific literature relying on geographical
information systems as well as spatiotemporal data and
modelling (Pagany et al., 2018; Ramirez Camargo and
220
Wuth, J., Valdes, J., Camargo, L. and Dorner, W.
Energy Modelling in Rural Areas with Spatial and Temporal Data in Germany and Czech Republic.
DOI: 10.5220/0007721002200227
In Proceedings of the 5th International Conference on Geographical Information Systems Theory, Applications and Management (GISTAM 2019), pages 220-227
ISBN: 978-989-758-371-1
Copyright
c
2019 by SCITEPRESS – Science and Technology Publications, Lda. All rights reserved

Stoeglehner, 2018). The main obstacle remaining, is
the acquisition of complete and high quality spatial and
statistical data, especially when modelling energy
infrastructures and related topics in rural regions. This
study summarizes several years of working in
geospatial energy system modelling. More precisely,
this review will include conducted energy use plans
and climate protection plans using a spatially explicit
approach in Bavaria (Germany) and the involvement in
ongoing projects analysing the developments of the
energy system in the cross-border region between
Germany (Bavaria) and Czech Republic.
The rest of this article is structured as follows:
Section 2 presents the type of research questions that
can be addressed. Section 3 describes the challenges of
spatial explicit energy modelling in the cross-border
region of Bavaria and Czech Republic and section 4
explains particular workarounds and the consequences
of deriving electricity demand and supply data from
other secondary sources. Finally, conclusions are
presented in the last chapter.
2 ELECTRIC SYSTEM AND
VEHICLE CHARGING INFRA-
STRUCTURE MODELLING
The UN Environment Assembly promotes global
standards for the use of renewable energies and the
increase in energy efficient usage. Moreover, at the
lower administrative levels, the transition to renewable
energy generation and to sustainable electric
transportation have become a priority (Cajot et al.,
2017). To develop and propose new models, policies
or energy saving measures, first of all the current state
of the art in energy usage and production needs to be
observed on a larger, detailed scale. For that, research
questions according to current data availability
standards are of major importance.
Urbanization, increased automation of production
processes and electrification of the energy matrix does
not only lead to higher energy requirements but
additionally puts pressure on the electric grid. This is
further intensified with an increasing share of
distributed renewable electricity generation.
Demographic changes and rural depopulation
decreases energy consumption in rural areas and lead
to sub-utilization of existing energy distribution
infrastructures. Moreover, technologies are advancing
in their energy efficiency and smart housing devices
help to eliminate unwanted energy consumption. This
simultaneous, interdependent and fast but partially
contrary development has to be analysed and studied
exhaustively because the decisions taken to maintain a
fully functioning energy infrastructure, will persist for
several decades.
Contemporary computational capacities and
models offer unprecedented capabilities to examine
future decision options about complex systems under a
wide range of assumptions. Current important research
topics include the integration of high shares of
renewable energy generation technologies, which
range from well-established ones, such as
photovoltaics and wind power, to technologies that
should solve the dispatch limitations, such as power to
gas and renewable fuels. Furthermore, decisions must
be taken about the mix of technologies to be adopted,
storage and backup systems as well as the integration
of new technologies that improve energy efficiency,
such as heat pumps. Technologies that are significant
hopes in the reduction of CO2 emissions of society like
electric vehicles and carbon storages, are further topics
that require thorough research and decision making.
Most of these technologies, as well as their impact on
the electric grid at the DSO and TSO levels, require not
only model approaches that can deal with future
uncertainties that grow with time (DeCarolis et al.,
2017) but also high quality data that provide a solid
basis. Otherwise, results and conclusions derived will
be misleading.
Especially in the present discussion of expanding
electro mobility, it is of high importance to know
where exactly energy is produced and consumed. It is
often mentioned that the stability and capacity of the
electric grid in its current state would not suffice for
larger penetration rates. Considering the suggestion for
better, more detailed data, would help in identifying
grid gaps. The identification of these gaps can provide
opportunities for electric vehicle charging stations to
stabilize the grid, similar to already existing models
like the “Building-to-Vehicle” approach
(Genikomsakis et al., 2016). Moreover, one of the most
interesting questions for a researcher in the area of
electro mobility is: what the role of the availability of
charging stations on the transition to an e-mobility
concept would be.
Modelling the electricity grid presents a huge
challenge for any researcher working in the area of
electro mobility and electricity system planning in
general. The main challenge is associated with the level
of resolution needed. In the case of future electric
vehicle charging processes, particularly with regards to
higher distance ranges of the vehicles, customers will
want to be able to charge their cars faster. Hereby fast
charging or hyper charging stations are needed.
E-mobility planning needs to forecast the future
scenarios with high degrees of electric vehicles
Energy Modelling in Rural Areas with Spatial and Temporal Data in Germany and Czech Republic
221

penetration rates. Thus the demand may require to
increase the grid supply capacity to several times ≥ 150
kW at central intersection points. Building numerous
charging points with capacities of 50 kW or higher on
main traffic arteries may have a huge impact on the
distribution and even the transmission grids (Nationale
Plattform Elektromobilität, 2015).
It is apparent that many topics concerning
electricity and infrastructure planning are of
importance not only to private companies but to
governments and the general public. A thorough
knowledge of the topic is therefore indispensable to
make valuable decisions for future electricity and
mobility reasons. For this, high quality, spatially and
temporally resolved data is necessary. Such data
however is either non-existent, or very expensive and
not affordable to research institutions, which leads to
establishing second best results with workarounds.
3 WHAT IS MISSING AND AN
IDEAL DATA WORLD
Every energy system modeller faces a double trade-off
when designing an energy model. They have to
consider both, the level of detail, as well as the scope
of the model. Due to the absence of data, a higher
number of hypotheses and generalizations are in place
most of the times and huge deviations from reality may
exist. Concerning the electric system the availability
and reliability of data deteriorates with decreasing level
of spatial and administrative aggregation. For instance,
at the national level in Germany it is possible to obtain
hourly data of electricity generation from fossil and
renewable sources as well as demand data (see, e.g.,
Fraunhofer, 2019). The same applies to the electricity
transmission system. Spatial and attribute data of the
high and highest voltage electricity grids as well as the
location and characteristics of the main fossil based
energy power plants are easily available. In the
German case, a list of all electricity generation
installations larger than 10 MW including location and
basic attribute data is provided by the State Grid
Agency (Deutsche Bundesnetzagentur, 2018).
However, at the state level there is no public data
available beyond yearly accumulated electricity
generation and demand of different economic sectors.
At the district and municipality level, this kind of data
is only available on request by local distribution system
operators (DSOs). Going further to a neighbourhood or
building level, such data might be available only if
some sort of specific data gathering project has been
conducted on-site. While data of renewable energy
generation installations covered by the renewable
energy law was systematized and made available to the
public until 2014, there is no reliable source about
these installations (when these are smaller than 10
MW) since then (Deutsche Gesellschaft für
Sonnenenergie e.V. (DGS), 2016) and even less is
known about shares and periods of self-consumption
of the electricity generated by these installations when
they are part of buildings. Similarly, data of the
medium and especially low voltage grids are rare
goods that are difficult to acquire even on request.
Ideally, electricity demand and generation data in a
high temporal resolution would be available at the
building level, while occupancy characteristics and
economic use of each building are also known. This
would include single family houses to industrial
production buildings in all federal states of a country.
The current data availability status is not only very far
away from this ideal, but the ideal itself would race
irresolvable data privacy and security issues.
Therefore, a compromise to keep private data safe is
necessary, when gathering data in high spatial and
temporal resolution. Specialized scientific literature on
data processing already offers attempts to develop
methodologies of data aggregation that gathers the
most valuable information for energy modellers by
simultaneously avoiding privacy issues. However,
even in the best of these cases very strong assumptions
have to be made. For instance, the best guess about the
electricity consumption profiles of industries in Europe
can only be made by comparing them to data from the
US (Voulis et al., 2018).
For Bavaria and the Czech Republic, key energy
demand figures divided by type of economic use and
generator are publicly available only at the state level
(NUTS 1). Moreover, temporally disaggregated data
about electricity consumption and generation is only
available at country level (NUTS 0) by Eurostat.
Additionally, in the Czech Republic, at least
standard load profiles of demand for different types of
users are provided for NUTS 1. The Czech Energy
Regulation Office (ERU) provides information about
the location of every energy plant of the country,
including for example photovoltaic panels installed by
private households. The data includes the owner and
installed capacity by type of primary energy but it does
not include any information about its use and in some
cases the street or cadastre reference is missing or
incomplete. As of December 2018 around a third of a
total of 1,746 generation installations selected in the
south-east of Czech Republic did not contain specific
information on its location or it was too vague to obtain
specific coordinates; the same problem appears in
Bavaria.
GISTAM 2019 - 5th International Conference on Geographical Information Systems Theory, Applications and Management
222

Accessibility to geodata of the existing power grid
in Germany is heterogeneous and depends on the
region and voltage level. To produce realistic input
data for simulation studies, necessary data is not
publicly available or cannot be obtained with
reasonable effort in the context of scientific analyses.
For example, the datasets provided by the Bundesamt
für Kartographie und Geodäsie(AdV, 2019), provides
the spatial situation of overhead power lines but they
cannot be differentiated into voltage levels.
Furthermore, the lower and medium voltage levels are
missing completely.
Considering electro mobility planning, geo-
referenced data that would indicate where car drivers
stop mostly, occupancy rates of municipal parking
areas and frequency rates of streets that are not
typically large commuter routes are also missing. One
ideal data option is a widespread data pool that
indicates where people stop, for how long they stop and
how frequented those locations are but if such datasets
exist, it is mostly individually formatted and thus not
applicable for larger research areas.
Another data issue is the large difference in the
existence of information between urban and rural
regions (Pagany et al., 2018). The less frequented an
area is, the lower is the anticipated need for collecting
it. Utmost of rural regions are characterized by
countryside, national parks and rather small towns and
cities. This type of geographic regions is well at the end
of the “data food chain”. Not a lot of people live there
and the need for transportation system- and energy grid
system developments is lower compared to urban
regions
Besides these local factors, the ability of the grid is
important for this topic as well as roads and locations
that raise a refuelling demand. In Germany, data on
roads and its infrastructure is collected by the federal
offices. This data nevertheless is very expensive,
which is why many researchers replace it with
OpenStreetMap road data. All other datasets required
are not available in an openly collected way.
Combining this information with a comprehensive
dataset of grid capacities and occupancies, would
indicate the best places for recharging batteries without
inhibiting customers in their daily routines.
For many workarounds, Volunteered Geographic
Information (VGI) provides researchers with
alternative data sources. In view of OpenStreetMap
(OSM) data, some characteristics are apparent, that any
researcher would consider as ideal: it is free,
actualized constantly, detailed, rich and it is classified.
Nevertheless, OSM data belongs to the group of VGI
and thus contains common problems like its
incompleteness, the reduction to geographic
information only, and the absence of quality controls
and therefore infrequent wrong information (e.g.
outdated, closed sites). In an ideal world, the data
provided by OSM would contain even more
information than the geographic localization and rough
classification.
Newly, OSM also tries to cover grid related
information for energy modellers in the transmission
and distribution sectors. OSM data with the tag
“power” has been collected since the beginning of
2007 and includes not only high voltage transmission
lines but also information on medium voltage
transmission lines, transformers and other
infrastructure. New projects are exploring the
possibility to generate accurate distribution network
data based on this initiative (for an overview see e.g.,
https://wiki.openmod-initiative.org;Rivera et al.,
2017). OSM data thus provides a base of information
that is not available in this form anywhere else.
4 WORKAROUNDS AND THE
INEVITABLE
When considering such questions as addressed in
chapter 2, many of the required data sets are either too
expensive or just not existent in a format as needed.
The high accuracy and level of detail that is necessary
is difficult to access. Inevitable is that most of the data
is in hands of administrative complex institutions or
private sector organisations, that invest money to
gather data, which leads to the need of selling it at a
certain price, in many cases not affordable to research
institutions. Moreover, in the worst cases, data are in
private hands so that there is no way to access it or data
is not being gathered at all due to above mentioned
reasons.
4.1 Electricity Demand and Supply
Modelling
For municipalities in Germany, methodologies to
determine energy generation and demand in a spatially
explicit way using GIS related to the topics named in
section 2 can be found e.g. in (Bayerisches
Staatsministerium für Umwelt und Gesundheit et al.,
2011). Additionally, a review of methodologies for the
determination of spatiotemporal data for Germany and
Austria can be found in (Ramirez Camargo and
Stoeglehner, 2018). In the case of Bavaria and the
Czech Republic there are, however, thousands of
municipalities. The required computational and
monetary resources to model electricity demand and
Energy Modelling in Rural Areas with Spatial and Temporal Data in Germany and Czech Republic
223

generation in the level of detail applied to
municipalities would be immense. For instance, typical
data used to locate demand in space and to calculate
spatially potentials of renewable energy sources at the
municipal scale are data of individual buildings in a 3D
vector format with level of detail 1 (LOD1) or 2
(LOD2) from the Bavarian survey Agency (Bayerische
Vermessungsverwaltung). These data exist in Bavaria
but it is available only under request and monetary
charge per object. The cost for all existent (several
million) objects is prohibitive. The alternative that is
free of charge (for educational institutions conducting
research projects), are 2D vector data without attributes
apart from the location and the address. In Czech
Republic, the geodata infrastructure is expected to be
modernized until 2020 and 3D vector data of buildings
should then be available for the whole country
(Janečka and Souček, 2017). For the moment, 2D data
with multiple attributes is available to the public trough
e.g. the INSPIRE program. In order to enrich these 2D
Building datasets with attributes, such as size, use and
number of households (in the case of residential
buildings), further data, like high resolution digital
surface models (usually also not free of charge), land
use data and high spatial resolution population data
might be used. However, new issues emerge due to the
format, the spatial resolution and the creation and
reference dates of the data sets. Taking this and the
known limitations about the availability of time series
of electricity demand (section 3) into account, the best
spatial resolution that could be pursued for the
generation of spatiotemporal datasets of electricity
demand in Bavaria are municipalities and in the Czech
Republic federal states.
In order to produce data sets displaying the
electricity demand for each municipality as specific
and near to reality as possible, workarounds were
established. In Bavaria, due to a study on the share of
renewable energies in place (Energie-Atlas Bayern
,2018), the consumption of electricity per municipality
was calculated using the electric energy demand of
manufacturing industries on district level, dividing it
by the number of people working in those industries on
the same level and then multiplying it with the number
of inhabitants per municipality, working in the selected
field. Additionally, the same was done with households
and population sizes as well as employed people in
other industries as the above. This calculation does not
include electric energy needed by transportation
systems.
While current demands of electricity are relatively
easy to derive with calculations as the above
mentioned, they are also only approximations how
reality might seem, commuters are for example left
aside. Forecasting the development of electricity
demand however is even more difficult. Several
aspects need to be taken into account, like future
technological advancements, new ways of living
(smart homes, heat through electricity, electro
mobility, etc.) as well as demographic changes or rural
depopulation and urbanization.
To develop a calculation for the future demands of
electricity per municipality, the current electricity
demand was distributed into the three sectors industry,
agriculture and households. From there, LUISA data is
used to match the current numbers with future
estimations of land use and demographic
developments. The LUISA Territorial Platform
supplies data for the future estimation of land use and
further indicators per km2, provided by the European
Council (Barbosa et al., 2015). By combining the
current electricity demands per municipality,
differentiated into the three different sectors with the
percent changes of rising or shrinking numbers of
selected Land Use and demographic data, future
electricity demands per municipality can be estimated.
By introducing further factors, like technological
trends, electro mobility or policy recommendations’
induced developments, the estimations can be adapted.
In the case of existing renewable energy
installations, apart from the data that has not been
gathered at all (mainly installations smaller than
10MW since 2015), the major issue is the estimation of
the output in a high temporal resolution. Usually, for
municipalities, data from several installations can be
generalized to all installations in the study area.
Alternatively, data from a close weather station
together with physical models of PV and wind turbines
are used to estimate the output of installed capacities.
In order to develop such an estimation for Bavaria and
the Czech Republic without having to deal with
incomplete data sets from hundreds of sources, we opt
to use high resolution reanalysis data. The COSMO-
REA6 regional reanalysis (Hans-Ertel-Zentrum für
Wetterforschung, 2018) offer, among many others, the
U and V components of wind speed at different
altitudes, downward diffuse and direct shortwave
radiation flux at surface as well as temperature data for
the period 1995-2015 in hourly temporal resolution
and 6 km x 6 km spatial resolution. These are not only
complete data sets (full spatial coverage and time series
without missing values) but they also have been
validated and are in many cases more accurate than
satellite imagery derived data (Ramirez Camargo et al.,
2018). These data together with the models of PV and
wind power serve to estimate the output of existing
installations. However, it is impossible to correct cases
in which the location or size of the installations are not
GISTAM 2019 - 5th International Conference on Geographical Information Systems Theory, Applications and Management
224
available at all. To provide an accurate estimation of
the output when the installations are integrated in
buildings and the self-consumption rates are unknown
would be further points to improve.
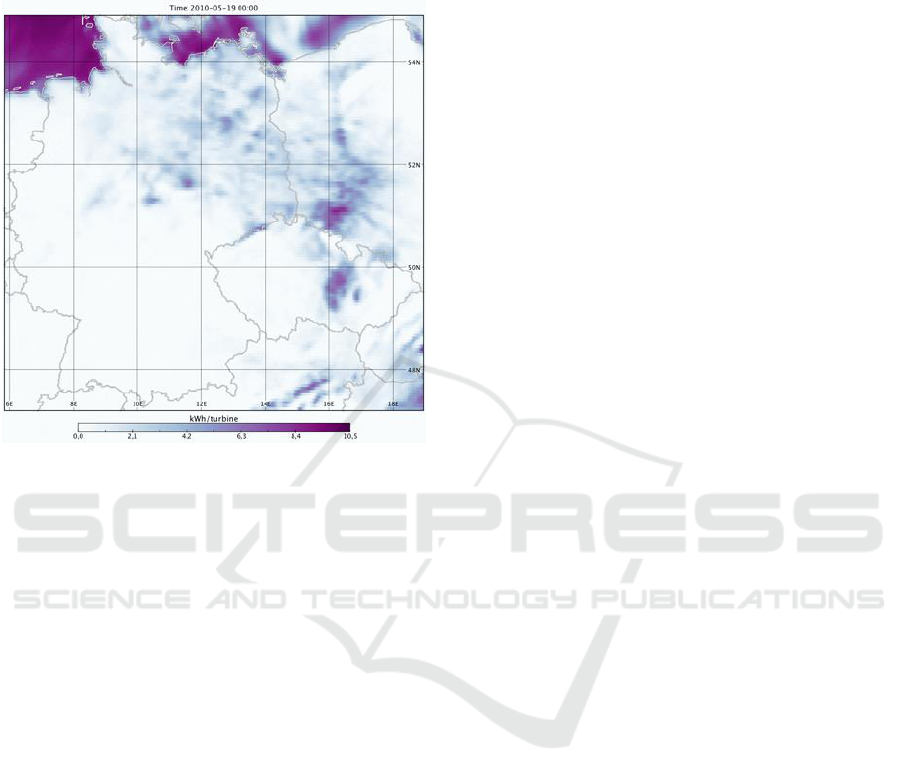
Figure 1: Example of one-time step (2010-05-19 at 00:00)
wind power generation of a small wind turbine with 10.5
kW calculated using COSMO-REA6 reanalysis data for
Germany and the Czech Republic [kWh].
In order to produce data sets of spatiotemporal
potentials of renewable energy generation, a similar
approach to the case of existing installations can be
followed. COSMO-REA6 data can be used to easily
generate long and high resolution time series of
potential electricity generation for entire countries as
presented in Figure 1. Therefore, the only requirement
to create spatiotemporal datasets of potentials, is the
identification of areas fulfilling suitability criteria for
the deployment of certain technologies (e.g. small,
medium and large wind turbines or free standing PV).
These areas are defined using 2D building data, road
and river data from OSM, official and free data of
Nature 2000 areas, as well as water bodies and forest
data from official sources and free data of land use.
Apart from incomplete or inaccurate data, errors that
are difficult to find and correct in this case are related
to the reference date of the spatial data and changes that
might have occurred until the day of calculation of the
potential. For instance, buildings that do no longer
exist may increase the supposed suitable areas or new
buildings or infrastructure may transform suitable
areas in now unsuitable ones.
4.2 Electro Mobility Charging Station
Placement
Most research studies that focus on the modelling of
charging infrastructure propose charging station
locations dependent on different factors but all in
urban, very densely populated areas. The methods with
a greater resolution or accuracy are based on the
collection of GPS data, as e.g. (Dong et al., 2014). Such
methods imply the collection of data in a long time
span and for different driver profiles, which requires a
large quantity of resources the larger the area observed
and the lower the density of traffic.
In order to make assumptions about user behaviour
and charging events, Triebke et al., (2016) collected a
large dataset. More than 15.000 charging events were
accumulated and analysed in both rural and urban
areas. In urban areas, charging behaviour is rather
predictable and assessable, however in rural areas not.
The occupancy rates are very low and random
compared to urban areas. As highlighted before, in
Bavaria and Czech Republic, there are hundreds of
municipalities and the resources to model Electric
Vehicle Charging infrastructures based on GPS data
would have to be immense. With the purpose to
provide these municipalities with a tool to design and
develop new transport infrastructures Zink et al.,
(2017) and Valdes et al., (2019) established a model to
define demand for electro mobility charging stations
by help of designating a certain demand for energy to
each Point of Interest in the project area based on OSM
data. The project area is the border region between
Bavaria and Czech Republic, which is a very rural
region including a large national park. The presented
workaround is based on Zink et al.,(2017), and
extended by energy generation measures.
The charging demand calculation is based on a
spatial statistical methodology considering demo-
graphic parameters, the distance of charging stations to
chosen Points of Interest (POI’s) (extracted from
OSM) and time spent at the POI’s according to
different age groups.
In order to include OSM data in the model, it has
to be first validated. Based on Valdes et al., (2019), the
data is first “pre-validated”, to concentrate on the
relevant data sets and then processed in order to
identify the relevant POIs. The validation process is
customized to the South Bohemian and Bavarian
regions as well as the model design defined in Zink et
al., (2017). By processing data in the in Valdes et al.,
(2019) presented way, the electric vehicle charging
model is filled with improved data, which allows to
reduce a bias associated to particularities of OSM data.
Energy Modelling in Rural Areas with Spatial and Temporal Data in Germany and Czech Republic
225

The demand model furthermore contains the
average time use per day, dwelling time at one POI, the
penetration rate of electric vehicles and selected POI’s.
It allows to allocate an electricity demand to each POI
and aggregate it at the municipal level (see figure 2).
The models input data partly consist of national
surveys without geographical differentiation which
may be a potential source for biases as long as
behaviour in rural and urban areas is significantly
different, for example due to the availability and
distance to amenities. Moreover, there is no common
method of data collection and the classification of
activities and time resolution is not the same in the
German and Czech surveys.
The walking distance determines the optimal
charging station placement within a region with high
energy demand by minimizing the average distance to
the surrounding POIs.
Figure 2: Example of Electric Vehicle Charging Demand
and Walking Distances from POIs in Freyung, Germany.
The available electricity generation sites in the
project region are estimated in their average energy
supply capabilities is assessed and geographically
localized using the methodology and data described in
the section above. The geographical range to supply a
charging station directly with the sites provided energy
is enclosed. After both sides, the energy supply and -
demand, are calculated and geographically displayed,
areas with high demand and possible renewable energy
supply indicate the best spots for charging stations.
With this model, possible charging station
locations are not only bound to Points of Interest but
also existing and potential generation sites that provide
the charging stations with enough endogenous
renewable energy to relax a possibly congested grid,
not only in urban but also rural areas.
5 CONCLUSIONS
The more detailed and correct data is provided,
independent of its content, the better and precise
models can be used to estimate certain phenomena.
Here, the focus was put on electricity contexts
considering demand and supply potentials as well as
electro mobility charging station placements. The
future is known to be unsure, however for that, models
are developed to establish a better forecast and to help
policy makers and regional developers explore
possibilities and make plans in order to supply the
society with the right choices and capabilities. In order
for these models to be as precise and near to reality as
possible, the availability of detailed and geographically
precise data is of major importance.
It is therefore recommendable to make use of the
possibility to produce open source software and data
sets. This would support every researcher to gain
knowledge and help others to make the right choices
on energy related topics.
The presented workarounds may help to assume
future electricity demands and supply as well as electro
mobility charging station capabilities, and the placing
of such. It nevertheless stays to be a (valid)
workaround. With the above explained need for data to
achieve an ideal data world, one would be able to more
precisely model and calculate all of the above
mentioned topics and provide better data, results and
policy recommendations to interested parties.
ACKNOWLEDGEMENTS
The presented study results were conducted within the
framework of the projects “CrossEnergy: energy
infrastructure – future perspectives for a region in
change” (EU project number: 036) and “e-Road Písek-
Deggendorf” (EU Project number: 93), funded by the
European Regional Development Fund and in the
frame of the INTERREG V programme between the
Federal State of Bavaria (Germany) and the Czech
Republic.
REFERENCES
AdV, 2019. Digital Terrain Models [WWW Document].
URL http://www.adv-
online.de/Products/Geotopography/Digital-Terrain-
Models/ (accessed 1.2.19).
Barbosa, A., Jacobs-Crisioni, C., Batista e Silva, F., Perpiña,
C., Lavalle, C., Baranzelli, C., Arevalo Torres, juan,
European Commission, Joint Research Centre, Institute
GISTAM 2019 - 5th International Conference on Geographical Information Systems Theory, Applications and Management
226

for Environment and Sustainability, 2015. The reference
scenario in the LUISA platform: updated configuration
2014. Publications Office, Luxembourg.
Bayerisches Staatsministerium für Umwelt und Gesundheit,
Bayerisches Staatsministerium für Wirtschaft,
Infrastruktur, Verkehr und Technologie, Oberste
Baubehörde im Bayerischen Staatsministerium des
Innern, 2011. Leitfaden Energienutzungsplan. URL
http://www.stmi.bayern.de/imperia/md/content/stmi/bau
en/rechtundtechnikundbauplanung/_staedtebau/veroeffe
ntlichungen/oeko/leitfaden_enp.pdf (accessed 4.18.12).
Cajot, S., Peter, M., Bahu, J.-M., Guignet, F., Koch, A.,
Maréchal, F., 2017. Obstacles in energy planning at the
urban scale. Sustain. Cities Soc. 30, 223–236.
https://doi.org/10.1016/j.scs.2017.02.003
DeCarolis, J., Daly, H., Dodds, P., Keppo, I., Li, F.,
McDowall, W., Pye, S., Strachan, N., Trutnevyte, E.,
Usher, W., Winning, M., Yeh, S., Zeyringer, M., 2017.
Formalizing best practice for energy system optimization
modelling. Appl. Energy 194, 184–198.
https://doi.org/10.1016/j.apenergy.2017.03.001
Deutsche Bundesnetzagentur, 2018. Kraftwerksliste - Stand
19.11.2018 URL
https://www.bundesnetzagentur.de/DE/Sachgebiete/Ele
ktrizitaetundGas/Unternehmen_Institutionen/Versorgun
gssicherheit/Erzeugungskapazitaeten/Kraftwerksliste/kr
aftwerksliste-node.html (accessed 1.2.19).
Deutsche Gesellschaft für Sonnenenergie e.V. (DGS), 2016.
EnergyMap - Bundesrepublik Deutschland. URL
http://www.energymap.info/energieregionen/DE/105.ht
ml (accessed 1.2.19).
Dong, J., Liu, C., Lin, Z., 2014. Charging infrastructure
planning for promoting battery electric vehicles: An
activity-based approach using multiday travel data.
Transp. Res. Part C Emerg. Technol. 38, 44–55.
https://doi.org/10.1016/j.trc.2013.11.001
EAFO, 2018. Home | EAFO. URL https://www.eafo.eu/
(accessed 1.2.19).
Energie-Atlas Bayern – Mischpult „Energiemix Bayern vor
Ort“, Informationen zu den Rahmendaten:
Stromverbrauch, 2018. 4.
Foley, A., Tyther, B., Calnan, P., Ó Gallachóir, B., 2013.
Impacts of Electric Vehicle charging under electricity
market operations. Appl. Energy, Sustainable
Development of Energy, Water and Environment
Systems 101, 93–102.
https://doi.org/10.1016/j.apenergy.2012.06.052
Fraunhofer, 2019. Energy Charts. URL https://www.energy-
charts.de/ (accessed 1.2.19).
Garcia-Valle, R., Lopes, J.A.P., 2012. Electric Vehicle
Integration into Modern Power Networks. Springer
Science & Business Media.
Genikomsakis, K.N., Bocquier, B., Lopez, S., Ioakimidis,
C.S., 2016. Utilizing plug-in electric vehicles for peak
shaving and valley filling in non-residential buildings
with solar photovoltaic systems, in: 2016 5th
International Conference on Smart Cities and Green ICT
Systems (SMARTGREENS). Presented at the 2016 5th
International Conference on Smart Cities and Green ICT
Systems (SMARTGREENS), pp. 1–10.
Hans-Ertel-Zentrum für Wetterforschung, 2018. COSMO
Regional Reanalysis - COSMO-REA6 URL
http://reanalysis.meteo.uni-bonn.de/?COSMO-REA6
(accessed 1.24.18).
Janečka, K., Souček, P., 2017. A Country Profile of the
Czech Republic Based on an LADM for the
Development of a 3D Cadastre. ISPRS Int. J. Geo-Inf. 6,
143. https://doi.org/10.3390/ijgi6050143
Mu, Y., Wu, J., Jenkins, N., Jia, H., Wang, C., 2014. A
Spatial–Temporal model for grid impact analysis of plug-
in electric vehicles. Appl. Energy 114, 456–465.
https://doi.org/10.1016/j.apenergy.2013.10.006
Nationale Plattform Elektromobilität, 2015. Charging
Infrastructure for Electric Vehicles in Germany:
Working Group 3 – Charging Infrastructure and Power
Grid Integration.
Pagany, R., Ramirez Camargo, L., Dorner, W., 2018. A
review of spatial localization methodologies for the
electric vehicle charging infrastructure. Int. J. Sustain.
Transp. 1–17.
https://doi.org/10.1080/15568318.2018.1481243
Passey, R., Spooner, T., MacGill, I., Watt, M., & Syngellakis,
K. (2011). The potential impacts of grid-connected
distributed generation and how to address them: A
review of technical and non-technical factors. Energy
Policy, 39(10), 6280–6290.
http://dx.doi.org/10.1016/j.enpol.2011.07.027
Ramirez Camargo, L., Gruber, K., Nitsch, F., 2018.
Assessing variables of regional reanalysis data sets
relevant for modelling small-scale renewable energy
systems. Renew. Energy.
https://doi.org/10.1016/j.renene.2018.09.015
Ramirez Camargo, L., Stoeglehner, G., 2018. Spatiotemporal
modelling for integrated spatial and energy planning.
Energy Sustain. Soc. 8. https://doi.org/10.1186/s13705-
018-0174-z
Rivera, J., Leimhofer, J., Jacobsen, H.-A., 2017.
OpenGridMap: towards automatic power grid simulation
model generation from crowdsourced data. Comput. Sci.
- Res. Dev. 32, 13–23. https://doi.org/10.1007/s00450-
016-0317-4
Triebke, H., Göhler, G., Wagner, D.S., 2016. Data analysis
of PEV charging events in rural and business
environments – a load behaviour comparison - 20.
Valdes, J., Wuth, J., Zink, R., Schröck, S., Schmidbauer, M.,
2019. Extracting relevant Points of Interest from Open
Street Map to support E-Mobility Infrastructure Models.
Bavar. J. Appl. Sci. 4.
Voulis, N., Warnier, M., Brazier, F.M.T., 2018.
Understanding spatio-temporal electricity demand at
different urban scales: A data-driven approach. Appl.
Energy 230, 1157–1171.
https://doi.org/10.1016/j.apenergy.2018.08.121
Zink, R., Pagany, R., Marquardt, A., 2017. OSM-basierte
Standortmodellierung von Ladesäulen für
Elektromobilität am Beispiel des Bayerischen Waldes,
in: Tagungsband Der FOSSGISS 2017:
Anwenderkonferenz Für Freie Und Open Source
Software Für Geoinformationssysteme (Universität Pas-
sau; 22.-25.03.2017). FOSSGISS e.V. (Ed.), pp. 59–64.
Energy Modelling in Rural Areas with Spatial and Temporal Data in Germany and Czech Republic
227
