
Critical Analysis of Urban Vegetation Mapping by Satellite
Multispectral and Airborne Hyperspectral Imagery
Sébastien Gadal
1
, Walid Ouerghemmi
1
, Romain Barlatier
1
and Gintautas Mozgeris
2
1
Aix-Marseille Univ, CNRS, ESPACE UMR 7300, Univ. Nice Sophia Antipolis, Avignon Univ,
13545 Aix-en-Provence, France
2
Aleksandras Stulginskis University, LT-53361, Akademija, Kaunas r., Lithuania
Keywords: Multi-temporal, Satellite Imagery, Airborne Hyperspectral Imagery, Vegetation Species, NDVI.
Abstract: The monitoring and management of urban vegetation is an important issue nowadays due to the multiple
benefits of vegetation for people well-being and for maintaining the balance of ecosystem. In that context, the
following study explore to what extent remote sensing imagery could be used to detect and to characterize
urban vegetation. Two types of imagery were tested which are low-resolution satellite (i.e. Sentinel 2 and
Landsat 8 OLI) and high resolution airborne (i.e. Rikola hyperspectral sensor), the study assessed the
detectability of vegetation species over Kaunas city (Lithuania) for different seasonal acquisitions. Satellite
imagery showed accurate detection of 3 coarse classes of vegetation with overall accuracies (O.A.) superior
to 90%, and airborne hyperspectral imagery showed decent detection of 13 fine classes of vegetation with
O.A. of up to 73%.
1 INTRODUCTION
Urban vegetation mapping using remote sensing
imagery is an emerging branch, indeed, the interest of
studying, mapping, and managing green spaces is of
capital importance for several actors including
agronomists, urban architects, and environmental
scientists. The availability of satellites imagery
including Sentinel and Landsat programs permits
several possibilities in terms of green areas detection,
including temporal monitoring, extraction of specific
species depending on the season of acquisition, and
extraction of useful green areas maps for urban
architects and cities actors. Nevertheless, due to the
limited spatial and spectral resolutions of these data,
recognition of trees species will be not feasible.
The recognition if tree species is a complex
procedure, which requires high spectral and spatial
resolution imagery. Indeed, 1) if pixels size are not
small enough, misclassifications could occur due to
mixed-pixels phenomenon and 2) intra-class and
inter-class spectral variabilities of vegetation species
could affect badly the classification performance (i.e.
appearance of salt and pepper effect within classes).
In this context, several studies have explored
vegetation species mapping, and the obtained
performance is mixed. In (Brabant et al., 2018), 19
vegetation species were mapped using 4m and 8m
airborne hyperspectral imagery (i.e. up to 192 bands).
The authors showed that a band reduction using
Minimum Noise Fraction (MNF) (Green et al, 1988),
or using a number of uncorrelated spectral indices
permits an increase in term of identification accuracy
(i.e. best Overall accuracy (O.A.) equal to 55%). In
(Ouerghemmi et al., 2018a), 8 vegetation species
were mapped using airborne hyperspectral data (i.e.
up to 64 bands at 0.5m). The authors compared a
distance based and a machine learning classifier using
fixed training samples number, best results were
obtained with machine learning classifier with MNF
transform, with best O.A. equal to 46%. In (Mozgeris
et al., 2018), the authors used an objects-based
method for 6 trees species identification over 0.5m
hyperspectral and 0.2m color infrared images.
Several classifiers were trained using the segmented
objects, best accuracies were obtained using
hyperspectral images and Multilayer Perceptron with
O.A. of 62%. Several studies claimed superiority of
objet-based approach over pixel-based approach for
vegetation species identification (e.g. Kamal and
Phinn, 2011; Ballanti et al., 2016). Nevertheless, such
approaches are more time consuming and final result
Gadal, S., Ouerghemmi, W., Barlatier, R. and Mozgeris, G.
Critical Analysis of Urban Vegetation Mapping by Satellite Multispectral and Airborne Hyperspectral Imagery.
DOI: 10.5220/0007721400970104
In Proceedings of the 5th International Conference on Geographical Information Systems Theory, Applications and Management (GISTAM 2019), pages 97-104
ISBN: 978-989-758-371-1
Copyright
c
2019 by SCITEPRESS – Science and Technology Publications, Lda. All rights reserved
97
will depends on the accuracy of the used
segmentation methods.
In this study, a critical analysis on the use of
different types of remote sensing imagery to identify
vegetation species was carried. The goal was to first
define the classes of interest in accordance to the
image spatial resolution, and then to evaluate the
accuracy performance for each type of imagery and
for different seasonal acquisition when available.
2 MATERIALS AND METHOD
2.1 Data and Study Zone
For this study, 4 satellite images of different dates
were used; a Landsat 8 OLI image (i.e. summer: 15-
08-2015), and 4 Sentinel 2A images acquired at
different seasons (i.e. respectively spring: 12-05-
2017, summer: 28-08-2016, autumn: 17-10-2016 and
winter: 25-01-2017) were used. Landsat 8 image was
pan-sharpened to 15m with 9 bands in VIS-NIR-
SWIR domain, Sentinel-2A images were pan-
sharpened at 10m with 13 bands in VIS-NIR-SWIR
domain, pan-sharpening step was carried using
nearest-neighbour (NN) interpolation method. For
Sentinel-2A, the acquisition of four seasonal mono-
annual images was not possible due to cloud
presence, images of 2016 and 2017 were used instead.
In parallel, two summer images from airborne
hyperspectral imaging system Rikola were used, with
respectively 16 bands and 64 bands in VIS-NIR
domain at 0.7m and 0.5m of spatial resolution (i.e.
acquired respectively at July 2015 and September
2016).
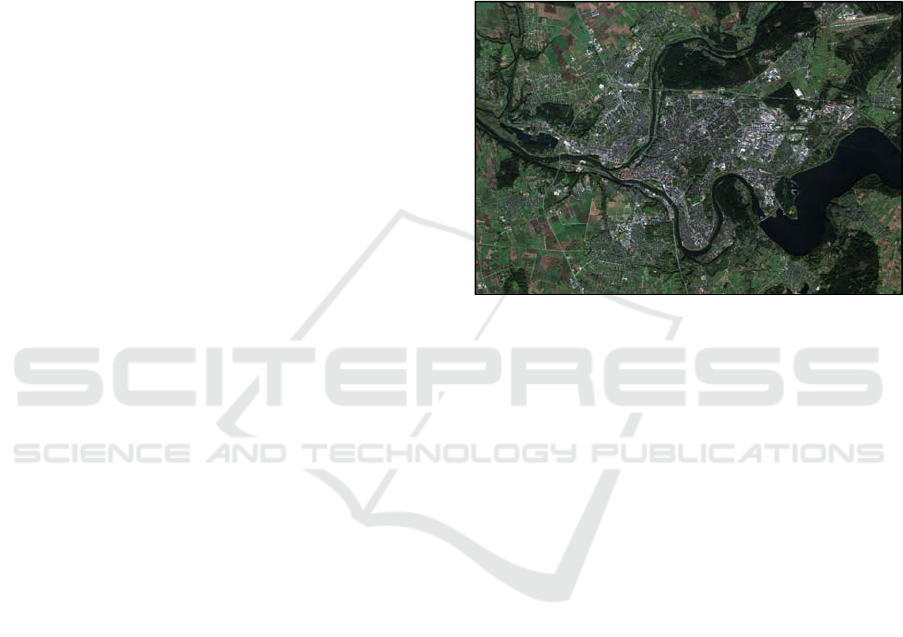
The study zone concerns Kaunas city (Lithuania)
(Figure 1) which is characterized by an important
green areas inside and around the city consisting in a
heterogeneous scheme combining public parks,
individual gardens, urban forests, and free green
spaces. With such an important green area, the use of
aerial and satellite imagery could facilitate the
management and monitoring of these areas.
Ground truth validation and training points were
extracted from a tree inventory over Kaunas
(Straigytė and Vaidelys, 2012), and from google
street images. Indeed, the inventory was first released
in 2012, and slightly updated since, thereby, some
trees were missing or badly georeferenced when
comparing to our test images, 2012 inventory and
dated google street images were used in conjunction
to produce accurate ground truth samples that will be
used for classification training and for results
validation. Ground truth points were then, manually
converted to each dataset resolution, in order to fulfill
the fineness of identification scale of each dataset.
Coarser images will require less effort in ground truth
point’s definition. The gap between the inventory
data acquisition and images acquisition, will not
affect too much the ground truth accuracy since few
changes were made to the existing trees. Furthermore,
an additional verification was carried using other
available datasets (i.e. Google Street pictures, ground
pictures, and field verification).
Figure 1: True colour composition of the study zone,
Kaunas city (Lithuania), Sentinel 2A (October 2016).
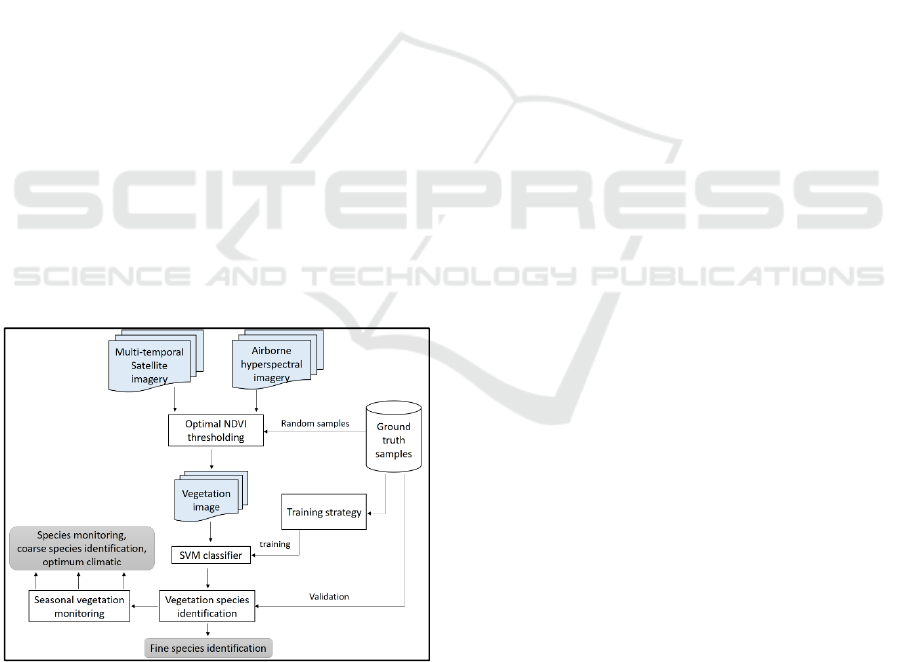
2.2 Method
The proposed method is composed of three main
steps which are 1) optimal Normalized Difference
Vegetation Index (NDVI) thresholding calculated
over reflectance images, 2) vegetation species
mapping using Support Vector Machine (SVM)
classifier (Vapnik, 1995), and 3) seasonal vegetation
monitoring (Figure 2).
NDVI Nir
_
I
R
Red/Nir_I
R
Red
(1)
First, the images were pre-processed if necessary,
satellite imagery were pan-sharpened to the highest
spatial resolution, no atmospheric correction was
needed since the available images were already
corrected. Airborne imagery doesn’t requires pan-
sharpening since all bands were acquired at the same
resolution, they were nevertheless converted to
reflectance using MODTRAN radiative transfer
model (Matthew et al., 2000). First step of the method
aims at defining an optimal threshold of NDVI for
vegetation pixels extraction, for that purpose, a
precise study of NDVI useful bands (i.e. red and
infrared) was carried for all the available datasets.
The goal was to test NDVI index behaviour over
vegetated pixels, for this purpose, ten pixels were
randomly chosen from a collection of ground truth
GISTAM 2019 - 5th International Conference on Geographical Information Systems Theory, Applications and Management
98
vegetation pixels, the bands corresponding to
minimum and maximum peaks in red and infrared
intervals were extracted for each pixel, optimal NDVI
bands will corresponds to the most recurrent bands
from the 10 test samples. Sometimes, more than one
combination of optimal NDVI bands are revealed, the
determined combination or set of combinations are
then used to calculate a threshold of NDVI, best
threshold will correspond to the narrower one.
Second step concerns vegetation species
identification at different scales depending on the
input datasets. From satellite imagery, coarse
identification of 3 vegetation classes was carried, and
from airborne hyperspectral imagery, finer
identification of 13 vegetation species was carried.
For each dataset, SVM classifier was trained using
two strategies; 1) fixed and limited amount of training
samples (i.e. 100 samples from ground truth data, per
class), 2) variable amount of training samples (i.e.
50% of ground truth data, per class). The vegetation
mapping was validated using the whole ground truth
data available.
Last step concerns seasonal vegetation
monitoring, using times series imagery. Four
Sentinel-2A were used to extract a climatic optimum
for vegetation extraction, and to monitor vegetation
behaviour along different seasons, the results were
compared to a Landsat 8 OLI at coarser resolution for
summer season. Second aspect of this part concerns
the feasibility assessment of specific vegetation
species identification following specific seasonal
acquisitions.
Figure 2: Vegetation species mapping by multi-temporal
satellite imagery and airborne hyperspectral imagery
(Method).
3 RESULTS
3.1 NDVI Thresholding
For Landsat 8 OLI, bands 4 and 5 (i.e. respectively at
654nm and 864nm) have been revealed for all tested
pixels as optimal NDVI bands, once the NDVI bands
revealed, an NDVI mask of [0.08-max] was
determined for the OLI 8 summer image (e.g. Ganie
and Nusrath, 2016).
For Sentinel 2A, band 4 (i.e. at 665nm) was
revealed as red optimal band for all tested pixels, and
three bands were revealed as potentially optimal
infrared bands which are band 7, band 8 and band 8A
(i.e. respectively 783nm, 842nm and 865nm). For the
spring image, the combination of bands 4 and 8
seemed to be the most adequate with an NDVI mask
of [0.46-max]. For the summer image any of the used
bands combination resulted in the same NDVI
thresholding with a mask of [0.46-max]. For the
autumn image, the combination of bands 4 and 8
seemed to be the most adequate with an NDVI mask
of [0.46-max], the chosen mask almost fulfil the
recommendation of Sentinel Hub platform for green
vegetation extraction (i.e. from 0.4 to max-value, e.g.
Gao, 1996; Piragnolo, 2018). Finally, for the winter
image, previous mask was not enough efficient for
vegetation detection (e.g. Sicre et al., 2016), the
combination of bands 4 and 8 seemed to be the most
adequate with an NDVI mask of [0.2-max], this latter
mask was a good compromise for winter season and
permit an accurate extraction of coniferous trees.
Concerning hyperspectral images of 16 bands, the
study revealed more combination of NDVI bands for
the 10 test pixels, the best combination concerned
bands 7 and 13 (i.e. respectively at 653nm and
803nm) with an NDVI mask of [0.7-max]. The 64
bands image was more stable in terms of NDVI bands
selection, indeed, any of the used bands combination
resulted in the same NDVI thresholding with a mask
of [0.55-max]. This last result could be explained by
the increasing of bands number that compensate the
spectral variability of the test pixels. The chosen
vegetation thresholds for hyperspectral images are
slightly different from conventional thresholds of [0.4
– max] and [0.5 – max], which are commonly used
for green vegetation extraction (e.g. Ouerghemmi et
al., 2018a; Piragnolo, 2018), nevertheless, we have
checked their accuracy in preventing non-vegetation
pixels inclusion after NDVI masking.
Critical Analysis of Urban Vegetation Mapping by Satellite Multispectral and Airborne Hyperspectral Imagery
99
3.2 Vegetation Species Discrimination
by Satellite Imagery
In the following study, several satellite images
acquired at different seasonal intervals were used for
vegetation species discrimination over Kaunas city.
The idea was to evaluate the identification accuracy
of three main group of vegetation species that are
deciduous trees, coniferous trees and grass areas. The
classes of interest were defined in accordance to the
available spatial resolution offered by Sentinel-2A
and Landsat 8 OLI that range from 10m to 15m in
pan-sharpened mode. Given these resolution it was
not reasonable to consider identifying trees individual
species, nevertheless such resolution could be a
useful tool for large-scale species identification.
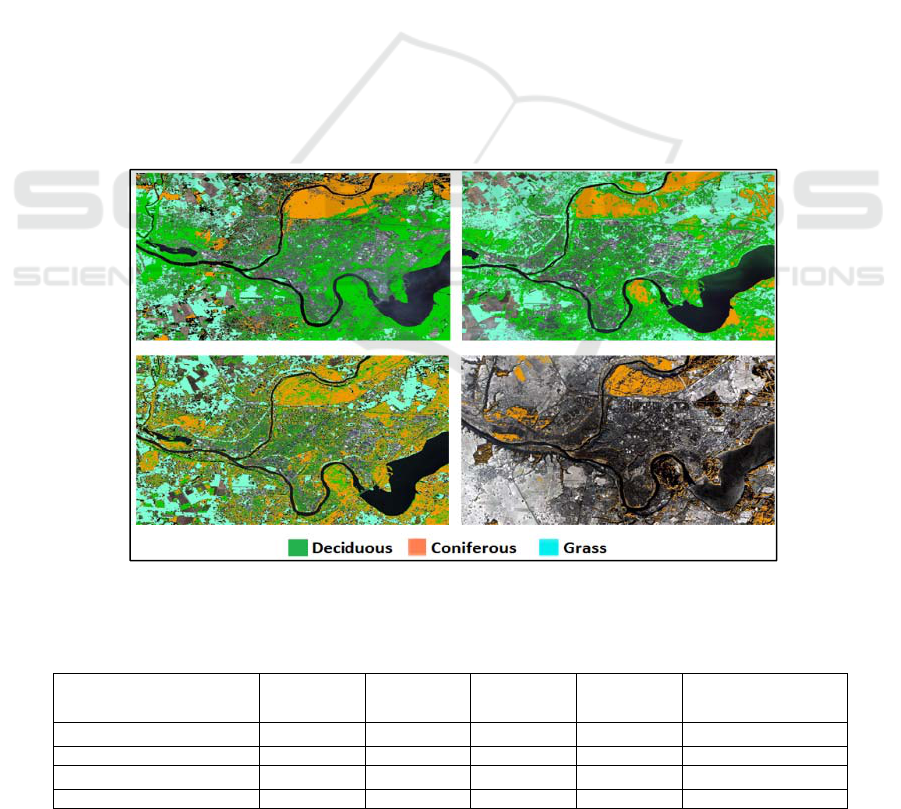
For Sentinel-2A, the identification concerned four
acquisition dates corresponding to four different
seasons. The best accuracies were obtained for spring
and summer seasons (Figure 3.a-b), with O.A.
superior to 90%, and individual accuracies superior to
66% (Table 1). Spring season seems to be slightly
accurate than summer one in terms of statistical
accuracy, and could be considered therefore as
optimum season for vegetation extraction; deciduous
trees and grass accuracies were higher in spring
season, while coniferous trees accuracy increased in
summer season. Grass accuracy decreased in summer
season due to its sensibility to drought conditions.
For the autumn season (Figure 3.c), the identification
accuracy of coniferous trees and grass was not much
affected, the identification accuracy of deciduous
trees was nevertheless decreased to 66% (Table 1)
due to an important decrease in chlorophyll
concentration. O.A. decreased also slightly under
90%. Winter image gives best identification accuracy
of coniferous trees, while no detection of deciduous
nor grass was possible, due to snow coverage and
leaves loss (Figure 3.d). When comparing Landsat 8
OLI result with Sentinel-2A result of summer
acquisition; O.A. are comparable with values superior
than 95% (Table 1), nevertheless, Sentinel-2A
showed to be more efficient in individual classes’
identification thanks to more efficient spatial
resolution and spectral resolution. Landsat 8 OLI
showed an important decrease of deciduous trees
accuracy compared to Sentinel-2A due to its coarser
resolution, coniferous trees accuracy slightly
decreased, and grass was over-classified
.
Figure 3: Vegetation species mapping by Sentinel-2A images of a) spring (12-05-2017), b) summer (28-08-2016), c) autumn
(17-10-2016), and winter (25-01-2017) at 10m resolution.
Table 1: Vegetation species identification accuracy by satellite imagery.
Vegetation species
S2A
Spring
S2A
Summer
S2A
Autumn
S2A
Winter
Landsat 8 OLI
Summer
Deciduous trees (%) 100 98.3 66.4 0 69.4
Coniferous trees (%) 96.6 99.3 97.5 100 98.4
Grass (%) 94.7 90.5 94.7 0 100
O.A. (%)/Kappa 98.0/0.97 97.5/0.96 89.1/0.80 96.3/0.00 96.3/0.84
(c) (d)
(a) (b)
GISTAM 2019 - 5th International Conference on Geographical Information Systems Theory, Applications and Management
100
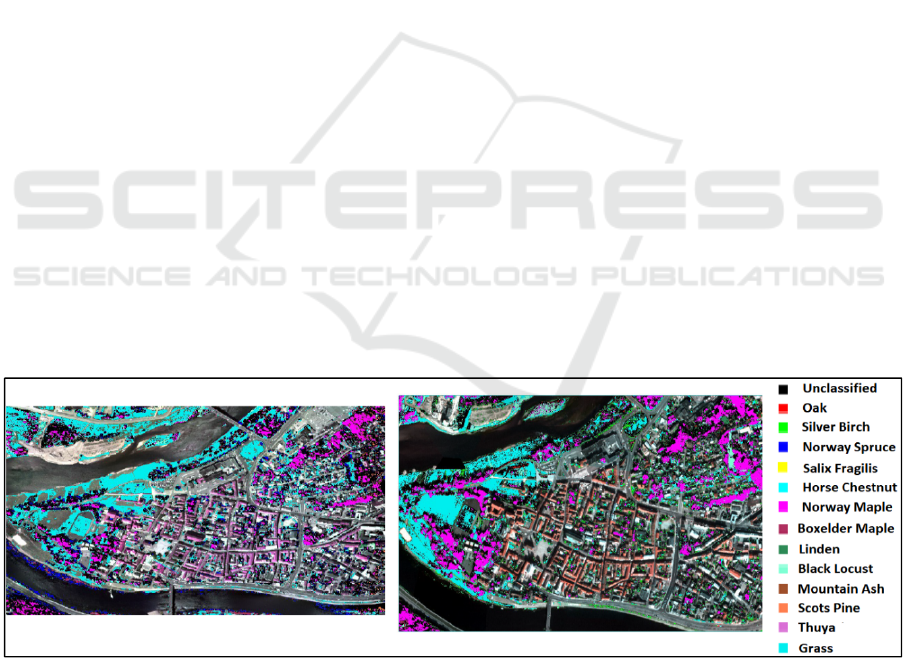
3.3 Individual Vegetation Species
Discrimination by Airborne
Hyperspectral Imagery
In the previous study, three vegetation classes were
identified using satellite images at 10m and 15m of
spatial resolution, given such resolution, it was not
possible to identify vegetation individual trees
species. In the following study, two images acquired
using hyperspectral camera Rikola were used, with
respectively 0.7m and 0.5m of spatial resolution, and
a number of bands equal to 16 and 64 bands. Airborne
hyperspectral imagery offers technically more
efficient images than satellite imagery in terms of
both spectral and spatial resolution, in the other hands
such solution is less cost effective but still relatively
more profitable than other airborne acquisition
solutions (Mozgeris et al., 2018).
Two training strategies were used to train the
SVM classifier; 1) using 100 fixed spectral samples
from the available samples, and 2) using 50% of the
available total samples per class. First strategy would
be useful in case of limited availability of training
samples, second strategy will ensure better classes
modeling (Zhang and Xie, 2013, Fassnacht et al.,
2014). The comparison include a 16 and 64 bands
images with respectively 0.7m and 0.5m of spatial
resolution, first part of results concerned
identification of 13 vegetation species including
deciduous trees, coniferous trees and a grass variety
(Figure 4.a-b), second part include coarser
classification of the vegetation species into 3 classes.
The identification accuracy showed an important
dispersion per species, some species are well
identified, some other are less accurately identified or
not identified at all (Table 2, 1
st
part). The first
training strategy seems less efficient in terms of
classification accuracy, with O.A. less than 30%, the
second training strategy showed much better
identification performance with O.A. of up to 73%
and an increase of accuracy performance of up to
59%. Second strategy permits the identification of
certain species that were not detected by first training
strategy, in the other hand, some previously detected
species were not detected using second training
strategy; when increasing the training samples, some
outliers could be added and then cause this behavior.
The second part of this study consists in
identifying 3 coarser classes which are deciduous
trees, coniferous trees and grass (Table 2, 2
nd
part).
For the first training strategy, the identification
accuracy slightly increased compared to individual
species identification, nevertheless, the overall
performance still poor (i.e. barely superior to 30% at
best). The second strategy gives on the other hand,
more accurate identification accuracy (i.e. slightly
inferior to 80% at best), when comparing to satellite
imagery case, the identification accuracy is less
efficient, with a percentage of decrease that vary from
32% to 23% approximatively. The decrease could be
explained by the fact that the grouping of classes was
carried using individual species maps, and the
validation was carried using a grouping of ground
truth pixels of individual species. Knowing that some
individual species were not detected using
hyperspectral imagery (Table 2, 1
st
part), the global
accuracy after grouping classes was therefore
affected by the undetected fine species.
Figure 4: Vegetation species mapping by airborne hyperspectral images of a) 16 bands at 0.7m resolution (08-2015) and b)
64 bands at 0.5m resolution (09-2016).
(a) (b)
Critical Analysis of Urban Vegetation Mapping by Satellite Multispectral and Airborne Hyperspectral Imagery
101

Table 2: Vegetation species identification accuracy by airborne hyperspectral imagery of 16 bands and 64 bands.
Vegetation species
16 bands hyperspectral Rikola 64 bands hyperspectral Rikola
100 samples 50% of total samples 100 samples 50% of total samples
Oak (%) 0 0,21 0 1,56
Silver Birch (%) 0 0 13,51 44,66
Norway Spruce (%) 71,32 43,38 64,41 0
Salix Fragilis (%) 0 0 0 0
Horse Chestnut (%) 0 2,29 12,8 12,98
Norway Maple (%) 55,18 77,9 12,06 80,39
Boxelder Maple (%) 28,85 45,45 0,57 16,38
Linden (%) 0 23,89 0 75,65
Black Locust (%) 42,13 38,07 45,66 40,98
Mountain ash (%) 4,29 6,75 16,39 15,57
Scots Pine (%) 19,18 0 46,6 0
Thuja (%) 0 14,38 9,09 29,09
Grass (%) 31,98 87,14 22,78 97,9
O.A. (%)/kappa 27,39/0.27 63,22/0.47 14,72/0.10 73,29/0.65
Deciduous (%) 28,42 39,16 15,62 69,48
Coniferous (%) 31,27 22,54 36,01 12,44
Grass (%) 31,98 87,14 22,78 97,9
O.A. (%)/Kappa 30,51/0.12 65,75/0.47 18,89/0.08 79,28/0.65
4 CONCLUSION
Satellite imagery presents a cost effective solution for
main urban vegetation classes, with accurate
identification accuracy (i.e. superior to 90%), such
solution is nevertheless not suited for trees species
identification due to not sufficient spatial resolution.
High repetitiveness satellite imagery (e.g. Sentinel
and Landsat programs) offers an interesting solution
for inter/intra-seasons vegetation monitoring, we
showed in this study, an inter-season monitoring
using Seninel-2A imagery that permits first to
determine an optimum climatic for three main
vegetation classes identification, and second to
determine an optimum climatic for coniferous
vegetation identification.
The second part of the study focused on the
individual trees species identification using high
spatial resolution airborne imagery with higher
spectral resolution of up to 64 bands. The goal was to
identify 13 vegetation species within Kaunas city, the
strategy of fixed training samples gives poor
identification accuracy (i.e. O.A.<30%), second
training strategy was more convincing, with 50% of
the total samples per each class. For the second
training strategy, SVM classifier showed accurate
identification accuracy for both images (i.e. O.A. of
up to 73%). In parallel, the 64 bands image gives
better accuracy performance than the 16 bands one.
The increase of bands number permits better
modelling of the classes of interest and therefore,
better identification of the corresponding vegetation
species (e.g. Mozgeris et al, 2018; Ouerghemmi et al;
2018b), at the price of an increase in terms of
processing time due to higher resolution and bands
number.
High temporal satellite imagery (e.g. Sentinel-
2A), showed to be an accurate solution for coarse
scale vegetation identification and monitoring, thanks
to a large spectral interval, and to a good acquisition
repetitiveness, it could be therefore useful to several
fields of interest such urban architecture, urban
planning, agronomy, forest management, etc. At the
same time, hyperspectral imagery offer more
potentialities in terms of fine vegetation species
identification and also determination of other plants
characteristics such as health condition (e.g.
Mozgeris et al., 2016), thanks to its better technical
characteristics. Such imagery could be useful for
GISTAM 2019 - 5th International Conference on Geographical Information Systems Theory, Applications and Management
102

achieving finer studies at individual vegetation
species scale and could therefore be complementary
to satellite imagery.
The fusion of multi-sensor satellite imagery could
be an interesting perspective for identification
accuracy enhancement (e.g. Zhang and Xie, 2014;
Alonso et al., 2014; Gintautas et al., 2018). The use
of an airborne hyperspectral of 16 and 64 bands and
0.7m and 0.5m of spatial resolution permits to
identify most of the species of interest, nevertheless,
some additional investigations must be carried to
improve the identification accuracy. Ground truth
samples must be enriched and rectified for some
specific species, the integration of vegetation indices
in the classification process could be tested (e.g.
Erudel et al., 2017; Launeau et al., 2017; Brabant et
al., 2018), the use of some pre-processing steps could
be taken into consideration for optimal data
processing (e.g. MNF).
ACKNOWLEDGEMENTS
This research was funded by CNES THEIA program
(CES artificialisation urbanisation). This work was
supported by public funds received in the framework
of GEOSUD, a project (ANR-10-EQPX-20) of the
program "Investissements d'Avenir" managed by the
French National Research Agency.
REFERENCES
Brabant, C., Alvarez-Vanhard, E., M.Galića., G.,
ThanhNguyen, K., Laribi, A., and Houet, T., 2018.
Evaluation of Dimensional Reduction Methods on
Urban Vegegation Classification Performance Using
Hyperspectral Data. In IGARSS 2018, IEEE
International Geoscience and Remote Sensing
Symposium, 1636-1639.
Green, A. A., Berman, M., Switzer, P., Craig, M. D., 1988.
A transformation for ordering multispectral data in
terms of image quality with implications for noise
removal. IEEE Trans. Geosci. Remote Sens., 26, 65–74.
Ouerghemmi, W., Gadal, S., Mozgeris, G., and
Jonikavičius, D., 2018a. Urban Vegetation Mapping by
Airborne Hyperspectral Imagery: Feasibility and
Limitations. In WHISPER 2018: 9th Workshop on
Hyperspectral Image and Signal Processing: Evolution
in Remote Sensing, Sep 2018, Amsterdam, Netherlands.
pp.245-249.
Mozgeris, G., Juodkienė, V., Jonikavičius, D., Straigytė, L.,
Gadal, S. and Ouerghemmi, W., 2018. Ultra-Light
Aircraft-Based Hyperspectral and Colour-Infrared
Imaging to Identify Deciduous Tree Species in an
Urban Environment. Remote Sensing, MDPI, 10 (10).
Kamal, M., Phinn, S., 2011. Hyperspectral data for
mangrove species mapping: a comparison of pixel-
based and object-based approach. Remote Sensing
3:2222–2242.
Ballanti, L.; Blesius, L.; Hines, E.; Kruse, B., 2016. Tree
Species Classification Using Hyperspectral Imagery: A
Comparison of Two Classifiers. Remote Sens., 8, 445.
Straigytė, L. and Vaidelys, L., 2012. Inventory of green
spaces and woody plants in the urban landscape in
Ariogala, South-East European Forestry, Vol. 3, no. 2,
pp. 115-121, 2012.
Vapnik, V. N., 1995. The Nature of Statistical Learning
Theory, New York: Springer-Verlag.
Matthew, M. W., Adler-Golden, S.M., Berk, A.,
Richtsmeier, S.C. and al., 2000. Status of Atmospheric
Correction Using a MODTRAN4-based Algorithm.
SPIE Proceedings, Algorithms for Multispectral,
Hyperspectral, and Ultraspectral Imagery VI. Vol.
4049, pp. 199-207.
Ganie, M. A., and Nusrath, A., 2016. Determining the
Vegetation Indices (NDVI) from Landsat 8 Satellite
Data. Int. J. of Adv. Res. 4 (8). 1459-1463, ISSN 2320-
5407.
Gao, B.C., 1996. NDWI - A normalized difference water
index for remote sensing of vegetation liquid water
from space. Remote Sensing of Environment
, 58, 257–
266.
Piragnolo, M., Lusiani, G., & Pirotti, F., 2018. Comparison
of vegetation indices from Rpas and Sentinel-2 imagery
for detecting permanent pastures. In ISPRS, Volume
XLII-3, 2018, pp.1381-1387.
Marais Sicre, C., Inglada, J., Fieuzal, R., Baup, F., Valero,
S., Cros, J., Huc, M., and Demarez, V., 2016. Early
Detection of Summer Crops Using High Spatial
Resolution Optical Image Time Series. Remote Sens.
2016, 8, 591.
Zhang, C. and Xie, Z., 2013. Object-based vegetation
mapping in the Kissimmee River watershed using
HyMap data and machine learning techniques,
Wetlands 2013, 33, 233–244.
Fassnacht, F. E., Neumann, C., Förster, M., Buddenbaum,
H., Ghosh, A., Clasen, A., Joshi, P. K., Koch, B., 2014.
Comparison of feature reduction algorithms for
classifying tree species with hyperspectral data on three
central European test sites. IEEE J. Sel. Top, in Appl.
Earth Obs. Remote Sens. 7 (6), 2547–2561.
Ouerghemmi, W., Gadal, S., Mozgeris. G., 2018b. Urban
Vegetation Mapping using Hyperspectral Imagery and
Spectral Library. In IEEE International Geoscience and
Remote Sensing Symposium (IGARSS) 2018, Jul 2018,
Valencia, Spain. pp.1632-1635.
Mozgeris, G., Gadal, S., Jonikavičius, D., Straigytė, L.,
Ouerghemmi, W. and Juodkienė, V., 2016.
Hyperspectral and color infrared imaging from
ultralight aircraft: Potential to recognize tree species in
urban environments In 2016 8th Workshop on
Hyperspectral Image and Signal Processing: Evolution
in Remote Sensing (WHISPERS), Los Angeles, CA, pp.
1-5.
Zhang, C. and Xie, Z., 2014. Data fusion and classifier en-
Critical Analysis of Urban Vegetation Mapping by Satellite Multispectral and Airborne Hyperspectral Imagery
103

ensemble techniques for vegetation mapping in the
coastal Everglades, Geocarto International, vol. 29, nᵒ
3, p. 228‑243.
Alonzo, M., Bookhagen, B., and Roberts, D.A., 2014.
Urban trees species mapping using hyperspectral and
lidar data fusion. Remote Sens. Environ, 148, 70–83.
Erudel, T., Fabre, S., Houet, T., Mazier, F. et Briottet, X.,
2017. Criteria Comparison for Classifying Peatland
Vegetation Types using in situ Hyperspectral
Measurements, Remote Sens., vol. 9, no 7, p. 748.
Launeau P., Kassouk Z., Debaine F., Roy R., Mestayer P.
G., Boulet C., Rouaud J. & Giraud M., 2017. Airborne
hyperspectral mapping of trees in an urban area,
International Journal of Remote Sensing, 38:5, 1277-
1311.
GISTAM 2019 - 5th International Conference on Geographical Information Systems Theory, Applications and Management
104
