A Novel Demand Side Management (DSM) Technique for Electric Grids
with High Renewable Energy Mix using Hierarchical Clustering of Loads
Muhammad Arbab Arshad, Syed Hasnain and Naveed Arshad
Department of Computer science, Lahore University of Management Sciences, Sector U, DHA, Lahore, Pakistan
Keywords: Demand Side Management, Hierarchical Clustering, Quota Allocation, Machine Learning.
Abstract:
Shortfall can occur at irregular times in an electric grid that has high a concentration of intermittent renewable
energy sources. Many methods are being studied, proposed and used to change the demand in order to match
the supply with the most common being Load Curtailment. New DSM techniques have evolved as a result
of advancements in AMI technologies. The goal is to minimize the difference between supply and demand
at the time of shortfall. Our proposed algorithm selects consumers and limits their energy consumption by
profiling the commercial sites based on their historical consumption behaviour. Then, to save the required
amount of energy, the sites with peak consumption levels with respect to their own daily usage are targeted.
Thus, it harnesses the maximum potential of electricity deduction from a site while minimizing its effects on
the residents.
1 INTRODUCTION
Due to global warming and other environmental prob-
lems associated with the fossil fuels, the whole world
is trying to shift to renewable energy sources to pro-
duce electricity. For example,by 2050 the generation
from wind and solar energy sources will be 2400 GW
and 2700 GW respectively, which will contribute 60%
to the mix of renewable energy (Zou et al., 2017).
Also, recently the policies have been introduced to
encourage installation of Solar PV systems among
residential consumers (McKenna et al., 2018). Un-
like conventional power sources, renewable energy
sources are intermittent. The production of electricity
from such renewable sources is dependent on factors
that we cannot control, such as sunlight, intensity and
speed of wind. Increasing popularity and integration
of renewable energy might be a good step so solve
environmental issues, but it is making generation less
controllable. Due to this problem, the integration of
these sources becomes difficult.
The nature of demand from renewable energy sources
requires new methods from demand side manage-
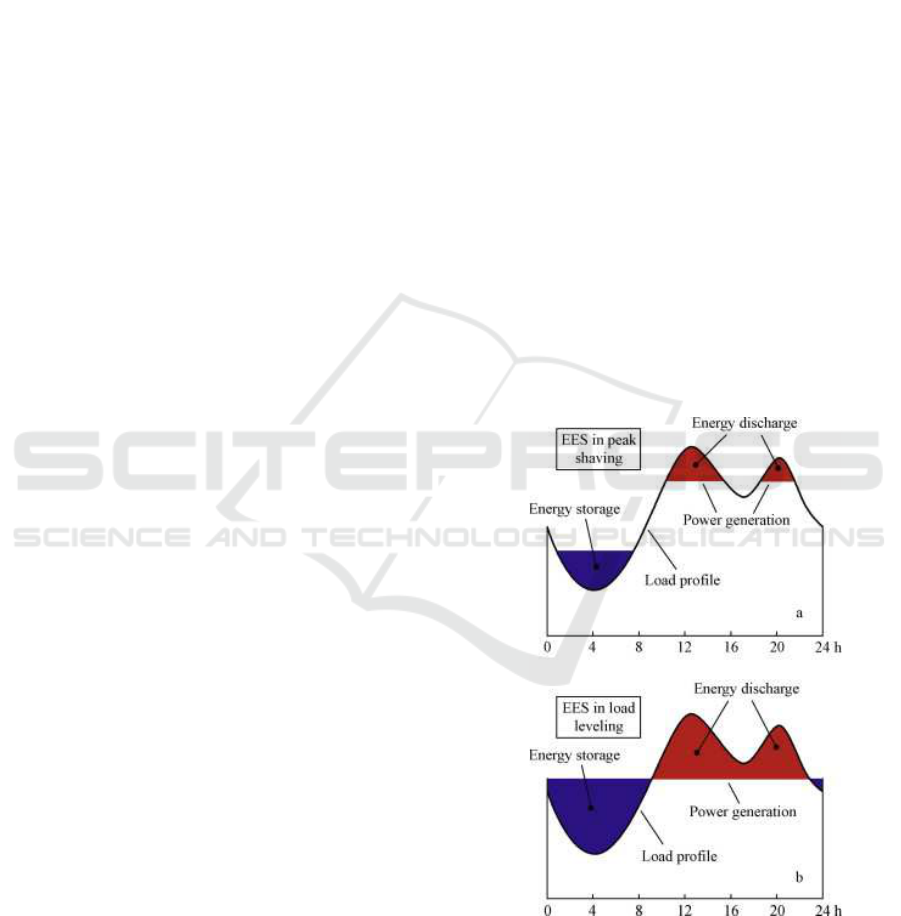
ment. One (old) method, as shown in figure 1, to
overcome the issue is to store the extra energy at the
time of extra generation and then use it at the time of
need; called Electrical Energy Storage (EES). (Chen
et al., 2009) However, this method is very expensive,
for example it cost $410/KWh for storage in Li-ion
Figure 1: EES in peak shaving and load leveling.
batteries (Obi et al., 2017). Different approaches are
being used by utilities to achieve this goal and such
approaches can be broadly classified into Direct Load
control or indirect load control. Direct load control is
the administered control of appliances by utility in or-
der to shed load at certain times. While indirect load
Arshad, M., Hasnain, S. and Arshad, N.
A Novel Demand Side Management (DSM) Technique for Electric Grids with High Renewable Energy Mix using Hierarchical Clustering of Loads.
DOI: 10.5220/0007721501370142
In Proceedings of the 8th International Conference on Smart Cities and Green ICT Systems (SMARTGREENS 2019), pages 137-142
ISBN: 978-989-758-373-5
Copyright
c
2019 by SCITEPRESS – Science and Technology Publications, Lda. All rights reserved
137

control involves techniques like real time pricing or
incentivizing consumers to reduce their electricity us-
age (Allcott, 2009).
Figure 2: Different Clusters (Dendogram). Hierarchical re-
lationship is shown within different sites based on their elec-
tricity consumption behaviour.
section − 2 represents various effective ap-
proaches proposed in the literature for the DSM.
Then, section −3 explains our proposed methodology
after mentioning the gaps in literature while also ex-
plains its significance and mathematical formulation.
At the end, section−4 and section −5 expands on the
results and possible improvements in future research
respectively.
2 RELATED WORK
Load Curtailment has previously been done on re-
gional/feeder level due to underdeveloped metering
infrastructure. However, with the development of
smart electric grids and advance metering infrastruc-
ture (AMI) , it is now possible to target individ-
ual consumers.One such approach, called soft load
shedding, is presented by (Aslam and Arshad, 2018).
Their approach makes use of clustering the consumers
based upon the amount of electricity foretasted and
limiting their usage through Cluster-based Incremen-
tal Reduction (CBIR) algorithm. Also, (Bashir et al.,
2015) have proposed Direct Load Control (DLC) sys-
tem that administers the devices of the site to limit
the overall consumption. However, for this technique,
every major device should be controllable by utility.
Additionally, due to the lack of authority over control
of these devices for consumers, many consumers may
not want to enroll into the program. Another problem
is the complexity of the system. For millions of con-
sumers, this method can get very complex. (Stenner
et al., 2017) have shown that customer distrust can re-
duce willingness to participate in Direct load Control
(DLC) programs. Utilities have to develop the trust
among consumers, which is a problem in itself.
(Erdinc et al., 2018) have proposed an incentive
model to attract more users to the DLC program. But
this method was only developed for Heating, venti-
lation, and air conditioning (HVAC) systems. Again,
this method requires utility companies to set the tem-
perature level of HVAC systems of the consumers,
and thus is impractical and also expensive(as ex-
plained earlier). (Xia et al., 2017) have also proposed
an incentive-based model to increase the effectiveness
of DSM programs. (Chrysikou et al., 2015) state that
people start losing interest in these kinds of programs
with time and hence, are no longer effective. In 2005,
Rocky Mountain Power -a company based in Utah,
USA, evaluated the use of their differential pricing-
based tariffs. They found that in opt-out schemes, up
to 98% of participating consumers chose to leave the
program after the mandatory period had been com-
pleted (Holyhead et al., 2015)
(Chandan et al., 2014) described a demand re-
sponse control by the utility that maximizes the users
convenience. However, this approach requires data
at the granularity of each appliance in site. (Hus-
sain et al., 2015) present a review of several demand
response techniques with a view on pricing signals,
appliance scheduling, optimization and their benefits.
(Lu et al., 2018) proposed an artificial intelligence
based dynamic pricing demand response algorithm.
(Allcott, 2009) presents different schemes of real time
pricing in electricity markets.
The complexity and cost associated with DLC sys-
tems makes it difficult to be deployed on large scale
while dynamic pricing has its own drawback. Our
proposed algorithm is not only inexpensive and eas-
ily deployable but also it eliminates the uncertainty
in consumer behaviour (as would have been observed
through peak pricing) by limiting their consumption
levels in advance.
SMARTGREENS 2019 - 8th International Conference on Smart Cities and Green ICT Systems
138
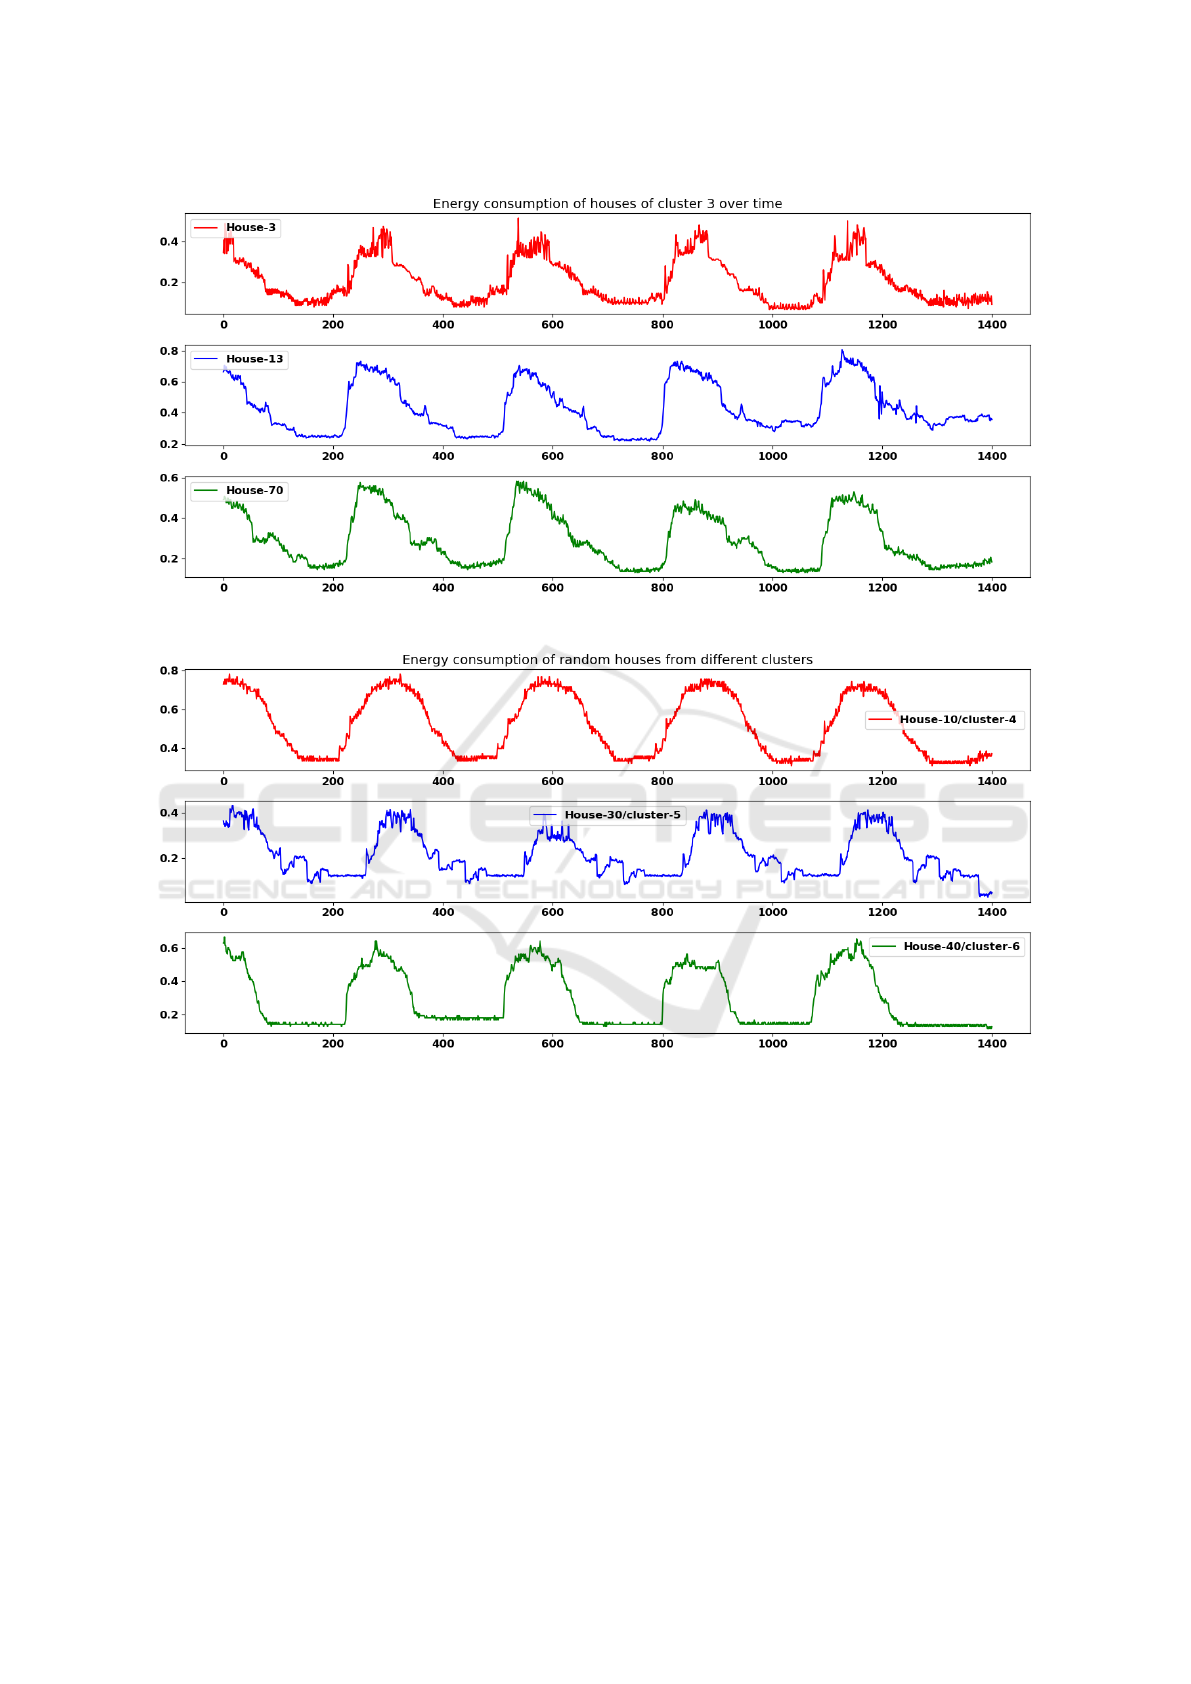
Figure 3: Same cluster Commercial sites.
Figure 4: Different cluster Commercial sites.
3 METHODOLOGY
The ultimate goal is to allocate quota to users to limit
their electricity usage. It can be thought of as a hy-
brid of indirect and direct load control programs, as
the utility has the control over maximum limit of elec-
tricity usage, while consumers have the choice of how
they want to use their allocated quota. After sites with
similar consumption behaviours are clustered, then at
the time of shortfall the cluster with maximum contri-
butions to the grid load is selected and each site within
it is allocated a quota.
3.1 Assumptions
The first assumption is that the shortfall is given or in
other words the demand and supply for the next day is
known in advance (without forecasting).Here it is im-
portant to note that the commercial sites have a pre-
dictable usage routine which could be predicted using
various Time Series forecasting techniques. In case
the sites do not show a trend and have a lot of vari-
ance in its usage behavior then our proposed strategy
is not applicable and we might need to devise a fix
quota allocation for those outliers. Secondly, the con-
sumption behaviors of people are assumed to remain
A Novel Demand Side Management (DSM) Technique for Electric Grids with High Renewable Energy Mix using Hierarchical Clustering of
Loads
139
same throughout selected time frame.
3.2 Data Acquisition And Synthesis
The data used to apply the technique consisted of
100 commercial/ industrial sites with 5-minutes en-
ergy usage granularity obtained from the Greenbut-
ton. The data consisted of different attributes but the
consumption over time of all the sites was compiled.
After compilation, to simulate the shortfall present at
a point in time, some attributes of the data were also
synthesized with a definite scheme. At each point, the
probability of a shortfall was considered 16%. If the
shortfall happens then the value of shortfall will be
under 20% of the cumulative demand of all sites at
that time.
3.3 Clustering And Algorithm
Development
The primary motivation of the work is to be able to
allocate a fair amount of quota to each site by exploit-
ing similar trends in consumption patterns of differ-
ent sites. To make different clusters machine learn-
ing technique of hierarchical clustering was used. R
was used to synthesize data and apply clustering using
HClust package. After clustering, the cumulative us-
age of each cluster was calculated. Different numbers
of sites were accompanied in each cluster which re-
flected the consumption patterns similarity in a more
granular way. However, this presented challenge in
cluster selection for soft-load shedding since now, the
cumulative consumption of a cluster does not reflects
that the sites in that cluster are consuming electricity
at their peak. To overcome this issue, the values were
normalized so that we should be able to check which
cluster contributes the most with respect to its own
consumption behavior and irrespective of other peo-
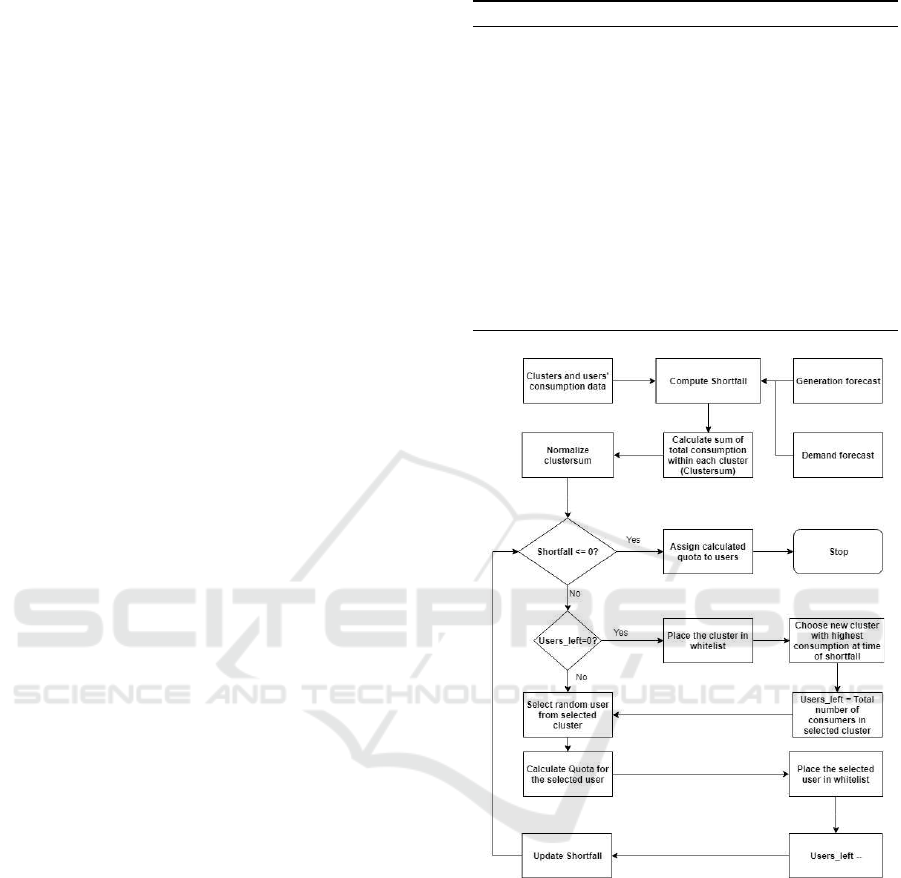
ple’s behavior. After this a Global Deduction Rate
(GDR) is defined which implies how much of the
power will be deducted from the usage value of a par-
ticular consumer (as represented in figure 5).
The selection of site within the cluster is considered
to be random. After this a point is selected where the
shortfall is present and the above mentioned steps are
performed until the shortfall is met. In every next al-
location, previous sites are white-listed and a round
robin method is used to traverse through the clus-
ters.We have used Hierarchical clustering and its re-
spective algorithm is represented in Algorithm 1.
Algorithm 1: Hierarchical clustering.
1: procedure SIMPLE HAC(d1, ..., dN)
2: for n ← 1 to N do
3: for i ← 1 to N do
4: C[n][i] ← SIM(dn, di)
5: I[n] keeps track of active clusters
6: A ← [] Clusters as sequence of merges
7: for k ← 1 to N − 1 do
8: i, m ← argmax
<i,m>:i6=mAI[i]=1AI[m]=1
C[i][m]
9: A.APPEND (< i, m >) Store merge
10: for j ← 1 to N do
11: C[i][ j] ← SIM(i, m, j)
12: C[ j][i] ← SIM(i, m, j)
13: I[m] ← 0 Deactivate cluster
14: return A
Figure 5: Flow Chart of Algorithm.
4 RESULTS AND DISCUSSION
4.1 Case Study
Based on the similar trends in their usage patterns
sites were divided into fifteen clusters. The division
of clusters and how much they differ from each other
according to previously mentioned criteria can be
observed in figure 2.
Radial phylogenetic tree in figure 2 shows that each
site is represented at its leaf and the arrangement
describes the similarity between their usages. The
SMARTGREENS 2019 - 8th International Conference on Smart Cities and Green ICT Systems
140
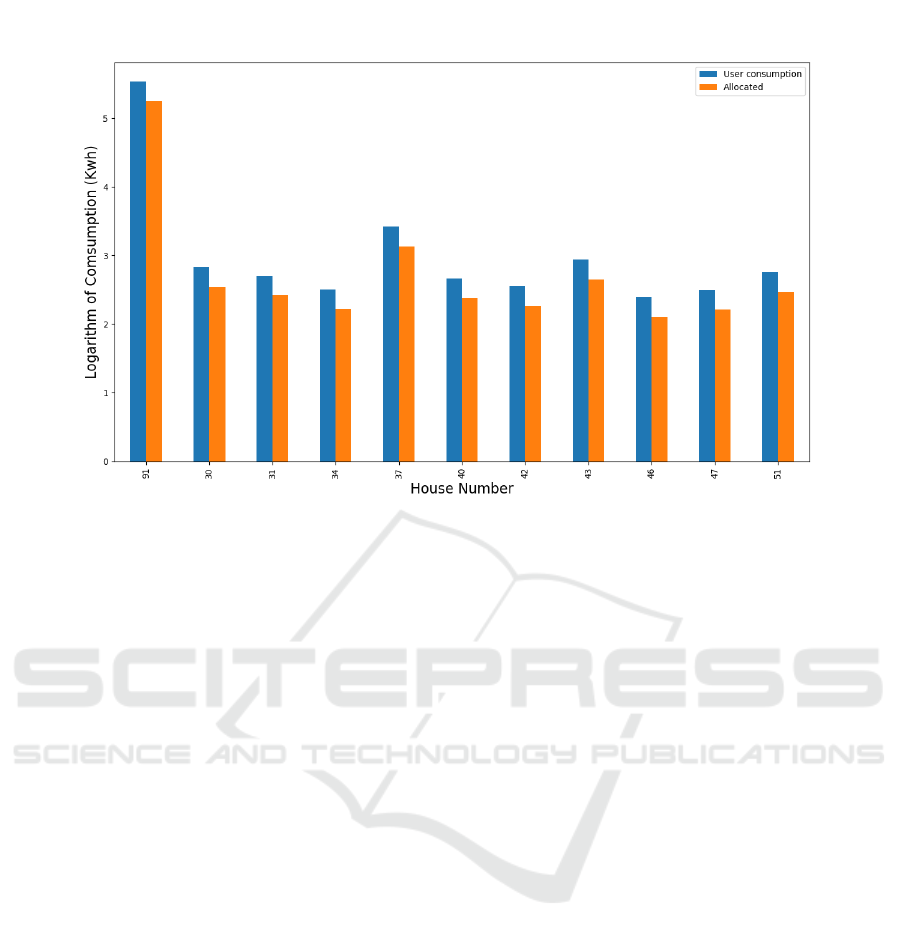
Figure 6: User consumption Vs allocated quotta at shortfall.
credibility of this technique can be illustrated if we
draw the normalized value of their usage across a
day and observe the difference between the usage
trends of sites in a single cluster vs. sites in different
clusters. The three sites in figure 3 represent a single
cluster. It can be seen how they show load peaks at
almost the same time, show increase/decrease in con-
sumption within same time period and mostly show
a single peak along a day. In contrast, if we look at
figure 4 then there is no clear relation between usage
pattern of these three sites which have been selected
randomly (site number 10, 20 and 30 belonging to
cluster 4, 5 and 6 respectively). Each site has its
own peak time, different trend for increase/decrease
in consumption, and shows multiple peaks differing
from each other.
The algorithm presented in the paper provides an
end to end solution for allocating quota to each
site. Let’s look into the scenario where a shortfall is
present with GDR equal to 25%. The results from
simulations and the allotted quota to each consumer
is displayed in figure 6
4.2 Communication with Smart Meters
The proposed algorithm requires the forecast of elec-
tricity twenty-four hours in advance. Based on the
forecasted values of generation and consumption of
electricity, the algorithm is triggered. Then, based on
those figures, recommendations will be made by the
system to limit the consumption of electricity for par-
ticular users. Having the values in advance enables us
to inform the users prior to the demand response ac-
tions. This notification system can possibly add to the
convenience of the users, leading to voluntary actions
by them to limit the electricity consumption. Also,
currently the granularity level is just one hour but the
planning can be made better by increasing the granu-
larity to 15 minutes level. For the prediction of next
fifteen minutes, mean bias error (MBE) of just 1.3%
could be achieved (Raza et al., 2016).It is advised to
use the spinning reserves as the buffer to accommo-
date the user’s energy demand. It will ensure the sta-
bility of the grid in case of a wrong forecast circum-
stances.
5 CONCLUSION AND
LIMITATIONS
The presented algorithm exploits the existing func-
tionality of advance metering infrastructure to carry
DSM, thus reducing the cost and making the solu-
tion feasible. In future we plan to improve the algo-
rithm by making the value of GDR dynamic instead
of fixed. Also, the forecasting modules will be imple-
mented with the algorithm to make an end to end so-
lution. The system relies on the forecasted values and
does not takes into account the validity of such fore-
casts. So, the scenarios where the demand becomes
lower than the generation or vice verse needs to be
accommodated. Also, to understand the consumer’s
perspective we plan to conduct an on-site experiment
in near future.
A Novel Demand Side Management (DSM) Technique for Electric Grids with High Renewable Energy Mix using Hierarchical Clustering of
Loads
141

REFERENCES
Allcott, H. (2009). Real time pricing and electricity mar-
kets. Harvard University, 7.
Aslam, T. and Arshad, N. (2018). Soft load shedding: An
efficient approach to manage electricity demand in a
renewable rich distribution system. In Proceedings of
the 7th International Conference on Smart Cities and
Green ICT Systems - Volume 1: SMARTGREENS,,
pages 101–107. INSTICC, SciTePress.
Bashir, N., Sharani, Z., Qayyum, K., and Syed, A. A.
(2015). Delivering smart load-shedding for highly-
stressed grids. In Smart Grid Communications
(SmartGridComm), 2015 IEEE International Confer-
ence on, pages 852–858. IEEE.
Chandan, V., Ganu, T., Wijaya, T. K., Minou, M., Sta-
moulis, G., Thanos, G., and Seetharam, D. P. (2014).
idr: Consumer and grid friendly demand response sys-
tem. In Proceedings of the 5th international confer-
ence on Future energy systems, pages 183–194. ACM.
Chen, H., Cong, T. N., Yang, W., Tan, C., Li, Y., and Ding,
Y. (2009). Progress in electrical energy storage sys-
tem: A critical review. Progress in natural science,
19(3):291–312.
Chrysikou, V., Alamaniotis, M., and Tsoukalas, L. H.
(2015). A review of incentive based demand response
methods in smart electricity grids. International Jour-
nal of Monitoring and Surveillance Technologies Re-
search (IJMSTR), 3(4):62–73.
Erdinc, O., Tascikaraoglu, A., Paterakis, N., and Catal
˜
ao,
J. P. (2018). Novel incentive mechanism for end-
users enrolled in dlc-based demand response pro-
grams within stochastic planning context. IEEE
Transactions on Industrial Electronics.
Holyhead, J. C., Ramchurn, S. D., and Rogers, A. (2015).
Consumer targeting in residential demand response
programmes. In Proceedings of the 2015 ACM Sixth
International Conference on Future Energy Systems,
pages 7–16. ACM.
Hussain, I., Mohsin, S., Basit, A., Khan, Z. A., Qasim, U.,
and Javaid, N. (2015). A review on demand response:
Pricing, optimization, and appliance scheduling. Pro-
cedia Computer Science, 52:843–850.
Lu, R., Hong, S. H., and Zhang, X. (2018). A dynamic
pricing demand response algorithm for smart grid:
Reinforcement learning approach. Applied Energy,
220:220–230.
McKenna, E., Pless, J., and Darby, S. J. (2018). Solar pho-
tovoltaic self-consumption in the uk residential sec-
tor: New estimates from a smart grid demonstration
project. Energy Policy, 118:482–491.
Obi, M., Jensen, S., Ferris, J. B., and Bass, R. B. (2017).
Calculation of levelized costs of electricity for vari-
ous electrical energy storage systems. Renewable and
Sustainable Energy Reviews, 67:908–920.
Raza, M. Q., Nadarajah, M., and Ekanayake, C. (2016). On
recent advances in pv output power forecast. Solar
Energy, 136:125–144.
Stenner, K., Frederiks, E. R., Hobman, E. V., and Cook, S.
(2017). Willingness to participate in direct load con-
trol: The role of consumer distrust. Applied energy,
189:76–88.
Xia, B., Ming, H., Lee, K.-Y., Li, Y., Zhou, Y., Bansal, S.,
Shakkottai, S., and Xie, L. (2017). Energycoupon:
A case study on incentive-based demand response in
smart grid. In Proceedings of the Eighth International
Conference on Future Energy Systems, pages 80–90.
ACM.
Zou, P., Chen, Q., Yu, Y., Xia, Q., and Kang, C. (2017).
Electricity markets evolution with the changing gener-
ation mix: An empirical analysis based on china 2050
high renewable energy penetration roadmap. Applied
energy, 185:56–67.
SMARTGREENS 2019 - 8th International Conference on Smart Cities and Green ICT Systems
142
