
Investigating Interaction Patterns in Educational Forums: A Social
Networks Analysis Approach
O. Ferreira-Pires, M. E. Sousa-Vieira, J. C. L´opez-Ardao and M. Fern´andez-Veiga
Department of Telematics Engineering, University of Vigo, Spain
Keywords:
Online Social Learning Environments, Forums, Social Networks Analysis.
Abstract:
Social networks analysis allows to study and understand the structural properties of a wide spectrum of natural
or artificial systems. In the field of education, online social networks arise quite naturally in the virtual class-
rooms as an inherent part of the learning activities. In this work we focus in forums participation, modeling
and investigating the social relationships taking place during an undergraduate course on computer networks.
Our findings show significant correlations among the patterns of engagement and the structure of the networks
and the students’ achievements.
1 INTRODUCTION
During the recent years, the structure of several natu-
ral and artificial complex systems has been analyzed,
and as a result many of the structural properties of
these objects have been discovered (Barab´asi, 2016).
The examples are pervasive,from biological networks
to online social networks, or from the Internet AS
topology to the Bitcoin transactions. Nevertheless,
despite the significant progress made in the structural
understanding of massive networks the ultimate goal
is to translate this physical or logical structure, which
has no meaning in itself, to functional predictions or
behavior of the system under study.
In the field of education, online social networks
(OSNs) arise quite naturally when information tech-
nology is used in the classroom as an inherent part of
the learning activities. The network is just a depiction
of the existence and strength of interaction among the
students, or among the students with the instructors.
It has long been recognized that the structure of such
interactions is key to a deep comprehension of the in-
formation flow within the students’ group, and that in
the end it can be used to measure the quality of the
learning process and to infer students’ performance
directly from their pattern of interactions.
In this paper, we discuss the results of struc-
tural social networks analysis (SNA) conducted on a
class of college students. Traditionally, information
technology-based learning activities have not been re-
garded as pure academic activities, but this view is
shifting and giving way to the introduction of infor-
mal learning-oriented tasks embedded into the course
design (Cross, 2006). In our case, we use a software
platform based on Moodle, especially built for en-
couraging online participation of the students to de-
sign, carry out and evaluate a set of online learning
tasks and games. After logging the activity during
a full year, we have performed a thorough network
analysis with the aim to understand the information
flow within this controlled group of students. In this
work we focus on the participation in forums, model-
ing the social relationships taking place in each one of
the three forums of the virtual classroom as suitable
social graphs. Our findings include the detection of
significant correlations among the pattern of activity
and the structure of the network and the final results.
The rest of the paper is organized as follows. Sec-
tion 2 summarizes some recent related work. The
methodology employed in the course under study is
reported in Section 3. Section 4 contains the main re-
sults of the SNA applied to the datasets. Finally, some
concluding remarks are included in Section 5.
2 RELATED WORK
In the last decade, a significant research effort has
been done on understanding how the interpersonal in-
teractions in OSNs shape, reinforce and enhance the
learning process. Datasets were mined in order to dis-
cover the most influential students or to find out how
collaboration among groups of students arise, and the
impact of relationships on learners’ performance. In
other words, whether the structure of the community
to which a student belongs while he/she is engaged in
the learning environment has any substantial correla-
tion on his/her performance. In this Section, we pro-
88
Ferreira-Pires, O., Sousa-Vieira, M., López-Ardao, J. and Fernández-Veiga, M.
Investigating Interaction Patterns in Educational Forums: A Social Networks Analysis Approach.
DOI: 10.5220/0007721600880099
In Proceedings of the 11th International Conference on Computer Supported Education (CSEDU 2019), pages 88-99
ISBN: 978-989-758-367-4
Copyright
c
2019 by SCITEPRESS – Science and Technology Publications, Lda. All rights reserved

vide a chronological review of representative papers.
A more extensive compilation can be found in (Dado
and Bodemer, 2017).
The focus of the study reported in (Laat et al.,
2007) is to highlight the advances that social net-
work analysis can bring, in combination with other
methods, when studying the nature of the interac-
tion patterns within a networked learning community
and the way its members share and construct knowl-
edge. Structural analysis of student networks has been
done in (Dawson, 2008) too, where the authors ex-
plore the relationships between a student’s position in
the social learning network and their reported sense
of community. The findings suggest that the posi-
tion is indicative of both their degree of perceived
sense of community and of the nature of the aca-
demic and social support the student requires for fu-
ture progression through the course. A complemen-
tary work (Haythornthwaite, 2008) studies learning
communities from a social network perspective, in-
cluding what relations are evident in these communi-
ties, how media affect online relationships formation
and what benefits can arise from successfully main-
taining learning networks. In (Manca et al., 2009)
authors highlight the importance of a good under-
standing of the communication flows that really occur
among users in educational online forums, in order to
detect significant postings to be included in social net-
works analysis. (Rienties, 2009) examines the impact
of academic motivation on the type of discourse con-
tributed and on the position of the learner in the so-
cial learning network, concluding that highly intrin-
sically motivated learners become central and promi-
nent contributors to cognitive discourse; in contrast,
extrinsically motivated learners contribute on average
and are positioned throughout the social graph. (Heo
et al., 2010) investigates the patterns and the quality
of online interactions during project-based learning,
showing its correlation with project scores. The iden-
tification of social network analysis indices that are
actually related to the experiences of the learning pro-
cess is addressed in (Toikkanen and Lipponen, 2011),
showing that some popular measures such as density
or degree centrality are meaningful or not depend-
ing on the characteristics of the course under study.
The structure of two distributed learning networks is
given in (Cadima et al., 2012) in order to understand
how it could enhance students’ success. In (Hommes
et al., 2012), the authors study the influence of so-
cial networks, motivation, social integration and prior
performance on learning, proposing degree central-
ity as a key predictor for students learning. In addi-
tion to structural properties, the influence of cognitive
styles and linguistic patterns of self-organizing groups
within an online course is the focus of (Vercellone-
Smith et al., 2012).
More recently, the work (Shea et al., 2013) ex-
amines relationships between online learner self- and
co-regulation. Here, the results indicate that students
with high levels of learner presence occupy more ad-
vantageous positions, suggesting that they are more
active and more sought after in networks of inter-
action. (Stepanyan et al., 2014) discusses the pat-
terns of network dynamics within a multicultural on-
line collaborative learning environment. The study
tests a set of hypothesis concerning tendencies to-
wards homophily/heterophily and preferential attach-
ment, participant roles and group work in the course
under study. In (Xie et al., 2014) social network
analysis techniques are used to examine the influ-
ence of the moderator’s role on online courses. The
main conclusion is that when students are assigned
to the moderator position their participation quantity,
diversity and interaction attractiveness increases sig-
nificantly, and their lack of participation influences
the group interaction. A theoretical model is devel-
oped in (Chung and Paredes, 2015) to investigate the
association between social network properties, con-
tent richness in academic learning discourse and per-
formance, concluding that these factors cannot be
discounted in the learning process and must be ac-
counted for in the learning design. In (Gaggioli et al.,
2015), the relationship between social network posi-
tion, creative performance and flow in blended teams
is investigated. The results indicate that social net-
work indices, in particular those measuring central-
ization and neighbors’ interactions, can offer valuable
insight into the creative collaboration process. (Lin
et al., 2015) compares the impact of social-context
and knowledge-contextawareness on quantitativeand
qualitative peer interaction and learning performance,
showingthat with the first one the community had sig-
nificantly better learning performance, likely related
to the more extensive and frequent interactions among
peers. (Siqin et al., 2015) investigates the discourses
involving student collaboration in fixed groups and
opportunistic cooperation. They find that activelypar-
ticipating and contributinghigh-levelideas were posi-
tively correlated with students’ domain of knowledge.
The existence of a positive relationship between cen-
tralization and cohesion and the social construction of
knowledge in discussion forums is the main conclu-
sion in (Tirado et al., 2015). In (Putnik et al., 2016)
the authors present a new model for students’ eval-
uation based on their behavior during a course, and
its validation through an analysis of the correlation
between social network measures and the grades ob-
tained by the students. Finally, (Jan and Viachopou-
Investigating Interaction Patterns in Educational Forums: A Social Networks Analysis Approach
89

los, 2018) investigate the influence of learning design
and tutor interventions on the formation and evolution
of communities of learning, employing SNA to study
three differently designed discussion forums.
Related to our previous work within this area of
research, (Sousa et al., 2017) pays detailed attention
to the characterization of informal learning activities.
To this end, we used one custom software platform,
SocialWire, for discovering what factors or variables
have measurable correlation with the performance of
the students. The dataset was first collected along
three consecutive editions of an undergraduate course
on computer networks. Later, we also measured the
extent and strength of social relations in a online so-
cial network used among students of a master level
course on computer networks (Sousa et al., 2018).
The dataset comprised again a period of three aca-
demic years. As these papers discuss, in addition to
the quantity of interactions among participants, suc-
cessful prediction of performance is possible when
the quality of interactions can also be observed, or
inferred on the basis of the network structure.
In this work we use a similar approach, but ap-
plied to the analysis of forums engagement. It is the
first time that we encourage and reward quality par-
ticipation in this activity in the undergraduate course
on computer networks under study.
3 EDUCATIONAL CONTEXT &
DATASET
We have taken as our educational environment the
2017/2018 edition of a course on Computer Net-
works directed to undergraduates of the second year
in the Telecommunications Engineering bachelor de-
gree. This course has a weekly schedule that spans 14
weeks. Overall, the classroom activities are organized
as follows:
• Lectures (2 hours each), that mix descriptive con-
tent (the Internet architecture, basic principles and
concepts, anatomy of the main protocols) with
some elementary mathematical details for analyz-
ing network performance.
• Laboratory sessions (2 hours each), organized in
small study groups. These are complementary
sessions where the students solve written exer-
cises, work hands-on with real networking equip-
ment and make a small programming assignment.
The course activities are supported by a tailored
Moodle site to which the students and teachers be-
long, and wherein general communication about the
topics covered takes place. To encourage networked
learning and collaborative work, each year different
activities are planned and carried out in the platform.
The students may gain different points by completing
or participating in these activities, and the resulting
rankings are eventually made public to the group. In
the edition forming the basis for this work, the follow-
ing online activities were proposed:
1. Homework tasks, to be worked out previously to
the in-class or the laboratory sessions. With this
activity teachers successfully encourage the stu-
dents to prepare some of the material in advance.
2. Quizzes, proposed before the midterm exams.
Quizzes are just practice exams for self-training.
3. Collaborative participation in forums. Three sep-
arate forums were created in Moodle to allow the
students to post questions, doubts or puzzles re-
lated to the organization of the course (organiza-
tion forum), the content of the in-class lectures or
the laboratory sessions (lessons forum), and the
programming assignments (programming forum).
4. Optional activities, such as collaborative edition
of a glossary of terms related to the subject,
games, peer assessment of tasks, etc.
The maximum score of tasks and quizzes is mea-
sured in so-called merit points, and represents the to-
tal score gained from engagement in online activities
during the continuous assessment. It is also possible
to obtain extra merit points by doing some optional
activities in order to compensate for bad scores or late
submissions of some of the tasks or quizzes.
The participation in forums, the answers to doubts
or the act of sharing interesting resources are also
rewarded with points granted by the teachers or the
classmates; specifically, each post can be voted in a
discrete scale: 3 points (lessons forum), 5 points (pro-
gramming forum) or 11 points (organization forum).
As new points are obtained, the karma level of each
student increases, depending on the average of the
points obtained in each forum, the difference with the
average of the points obtained by the class in each fo-
rum, the total number of points obtained and the total
number of posts voted by the student. The weighs of
the lessons, programming and organization forums to
the karma level are 75%, 15% and 10%, respectively.
Finally, the use of the virtual classroom is also re-
warded by the automatic scoring of different actions
carried out in the platform related to the normal activ-
ity unfolded along the term, like viewing resources,
posting new threads, replying to posts, etc. The so-
called experience points are awarded in a controlled
environment, with their maximum values and their
frequency set by the teachers.
CSEDU 2019 - 11th International Conference on Computer Supported Education
90
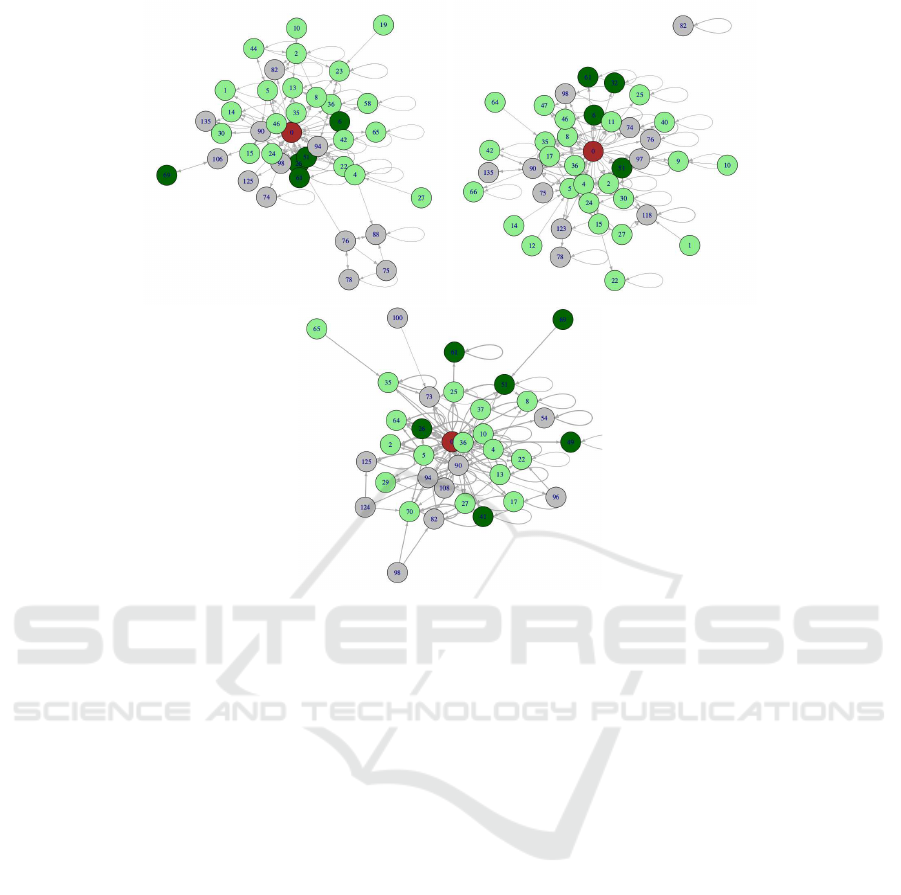
Figure 1: Forums activity graphs. LG (top-left), PG (top-right) and OG (bottom).
The accomplishment of some tasks, the karma lev-
els and the experience points are ultimately converted
into certain benefits helpful to pass the subject: bonus
points for the grades, more time for the assignments,
tips in the final exam, etc.
Though this course may be passed with a single
final examination covering all the material (provided
the programming assignment meets the minimum re-
quirements), students are encouraged to follow the
continuous assessment path. The weight of the con-
tinuous assessment is 50%, and the remaining 50% is
awarded as the result of a final exam held on two dif-
ferent dates (last week of May and first week of July,
non-exclusive). The continuous assessment weight is
split into a 20% for the programming assignment, a
20% from the midterm exam and a 10% of the final
grade comes out from the points gathered by engaging
in the social activities described previously,devised as
a tool to increase the level of participation.
To finish our description, in this edition 136 stu-
dents followed the course. 129 students which fol-
lowed the continuous assessment and 65 of these fi-
nally passed. Only 7 students were not stuck to con-
tinuous assessment, and 2 of them were able to pass.
Remarkably, one of the two had a very active partici-
pation in the three forums.
4 ANALYSIS OF THE DATASETS
We applied standard SNA (Newman, 2010) tech-
niques and tools to mine the data collected in the fo-
rums activity. As explained in the introduction, we
model the social relationships taking place in each
one of the three forums as graphs, termed hereafter
lessons graph (LG), programming graph (PG) and or-
ganization graph (OG). Our intent is to explain the
basic structural properties of such graphs as conse-
quences of the social interactions among its agents.
For such purpose, we recorded the events that took
place in each forum: users who posted new threads,
users who replied, and the average valuations they re-
ceived. This information is represented as a graph
where two nodes —the users— are connected by an
edge if one has given a reply to an entry posted by the
other. Self-edges represent new threads. The weight
of each edge is equal to the average points obtained
by the reply or the new thread post.
An illustration is given in Figure 1, where every
node is a student identified by his/her position in the
ordered list of final grades. The node with label 0 cor-
responds to the instructors. Light green nodes belong
to students that passed the subject at the first oppor-
tunity (May), while dark green is for students who
Investigating Interaction Patterns in Educational Forums: A Social Networks Analysis Approach
91

Table 1: Summary of basic structural parameters of each graph.
LG PG OG
Density
without self-edges 0.0564 0.0525 0.0764
with self-edges 0.0718 0.0666 0.0971
Reciprocity 0.4091 0.3171 0.2857
Transitivity 0.1151 0.1687 0.2201
Number of cliques
Size
2 70 69 78
3 20 32 52
4 0 5 10
5 0 0 1
6 0 0 0
Degree
In 0.1525 0.1564 0.2543
Out
without self-edges 0.5733 0.6298 0.7387
with self-edges 0.5663 0.5817 0.6941
Closeness 0.6432 0.6487 0.7579
Betweenness
Directed 0.4949 0.2275 0.4335
Undirected 0.7202 0.6637 0.6957
Eigenvector Unweighted
without self-edges 0.8355 0.8206 0.8209
with self-edges 0.8384 0.8109 0.8078
Assortativity
Degree −0.0616 −0.2551 −0.1472
Nominal 0.0955 −0.0805 0.0154
passed after the second opportunity (July), and grey
is for those students who dropped off the course or
failed the subject in the end. The width of each edge
is proportional to its weight.
4.1 Graph Level Measures
In SNA, the static or dynamic structure of a graph re-
veal key aspects of the collective and individual be-
havior of the agents. Next, we briefly report some of
the typical descriptive measures of a graph, and their
values in our datasets. Notice that for some measures
we consider simplified versions of the graphs, where
the weight of each edge is the sum of the weights of
all the edges between the underlying pair of nodes.
Moreover, including self-edges means including the
opening of new forum threads in the analysis.
4.1.1 Density
The density of a graph refers to the number of edges
that exist, reported as a fraction of the total possible
number of edges, with values ranging from 0 (spars-
est) to 1 (densest). The results in Table 1 show that the
density values are small and only a bit higher in the
organization graph. This fact simply reflects the def-
inition of the links; since only a part of the students
provide replies of each post, we would not expect a
dense graph of interactions.
4.1.2 Reciprocity
Reciprocity accounts for the number of mutual ex-
changes of information in the network. In the studied
graphs, these exchanges happen in the form of posts-
replies pairs. In mutual collaboration, either part re-
ceives at least one reply from the other part. Table 1
also lists the average reciprocity in the networks. The
results obtained are noticeable, since they are mea-
suring an interactive activity as the participation in
forums. The smaller value of the OG is due to the
fact that many of the questions raised in this forum
are solved with a single answer, in many cases by the
teachers. This also happens in the PG, in which some
of the doubts, mainly related to the specifications of
the tasks, are also solved by the teachers.
4.1.3 Transitivity
A broader form of collaboration is transitivity, the
fraction of closed loops with three nodes in the graph.
The global transitivity coefficient has been computed
for the datasets. The results obtained are shown in Ta-
ble 1 again, and confirm that transitivity is moderate.
However, this is not entirely unexpected, since in fo-
rums there is benefit in acquiring or propagating infor-
mation through third parties. Our data are consistent
with this observation and, consequently, transitivity is
quite small. Notice the opposite order of the values of
reciprocity and transitivity of the three networks.
CSEDU 2019 - 11th International Conference on Computer Supported Education
92

0
0.1
0.2
0.3
0.4
0.5
0 1 2 3 4 5 6 7 8
in degree
Frequency
0
0.1
0.2
0.3
0.4
0.5
0 1 2 3 4 5 6 7 8
in degree
Frequency
0
0.1
0.2
0.3
0.4
0.5
0 2 4 6 8 10
in degree
Frequency
0
0.1
0.2
0.3
0.4
0.5
0 5 10 15 20
out degree
Frequency
0
0.1
0.2
0.3
0.4
0.5
0 5 10 15 20 25
out degree
Frequency
0
0.1
0.2
0.3
0.4
0.5
0 5 10 15 20 25
out degree
Frequency
Figure 2: Degree centralities. LG (left), PG (middle) and OG (right).
4.1.4 Cliques
A clique is a maximal complete subgraph of a given
graph. So, a clique represents a subcommunity where
each member interacts with any other member. 2-
cliques and 3-cliques are related to the measures dis-
cussed in the last paragraphs. Table 1 lists the number
of cliques in the graphs by their size. We can see that
large cliques are not very likely.
4.1.5 Centrality
Many different measures of centrality have been de-
veloped, that capture different features of nodes’ po-
sition in a graph, the following ones being some of the
most commonly used:
• Degree centrality: measures how connected a
node is, just counting its neighbors.
• Closeness centrality: measures how easily a node
can reach other nodes, computing the inverse of
the average length of the shortest paths to all the
other nodes in the graph.
• Betweenness centrality: tries to capture the im-
portance of a node in terms of its role in con-
necting other nodes, computing the ratio between
the number of shortest paths that a node lies on
and the total number of possible shortest paths be-
tween two nodes.
• Eigenvector centrality: a measure based on the
premise that a node’s importance is determined by
how important or influential its neighbors are. The
scores arise from a reciprocal process in which the
centrality of each node is proportional to the sum
of the centralities of the nodes it is connected.
For the case of degree centrality, we considered
separately the in-degree centrality, which is the num-
ber of replies a student receives, and two measures of
the out-degree centrality: (1) the number of replies
given by a student in the graphs without self-eldges,
and (2) the number of new threads opened and replies
given by a student in the graphs with self-edges (we
consider this last measure due to the fact that these
are the interactions that can be voted by the rest of
the class). The results in Table 1 reveal that the in-
degree centrality values are only moderate, but the
out-degree centrality is noticeable, indicating a non-
homogeneous distribution of the replies submitted by
the participants, mainly in the OG. A subset of few
nodes act as very active participants in forums (the
subset includes the teachers, obviously). Neverthe-
less, more nodes act as generators of new threads and
recipients of information.
As for the closeness centrality, the high values
shown in Table 1 are again indicative of the existence
of few very active contributors. In the case of the be-
tweenness centrality, the high values observed in Ta-
ble 1 suggest that in the three networks few nodes act
as bridges between different parts of the graph. These
results are coherent with the reduced number of artic-
ulation points in each network: five in the LG (0, 4,
23, 76 and 105), seven in the PG (0, 5, 9, 15, 33, 90
and 127) and four in the OG (0, 33, 53 and 73).
Finally, for the eigenvector centrality, we consid-
ered the undirected version and tested different con-
figurations of the graphs built up from the datasets
(weighted or not, with or without self-loops). Ta-
ble 1 shows that all the measured centrality values
are noticeable, meaning again that not all nodes act as
Investigating Interaction Patterns in Educational Forums: A Social Networks Analysis Approach
93

0
0.1
0.2
0.3
0.4
0.5
0.6
0.7
0 0.5 1 1.5 2 2.5 3 3.5 4
# new threads
Frequency
0
0.1
0.2
0.3
0.4
0.5
0.6
0.7
0 1 2 3 4 5 6 7 8
# new replies
Frequency
0
0.1
0.2
0.3
0.4
0.5
0.6
0.7
0 0.5 1 1.5 2 2.5 3 3.5 4
# new threads
Frequency
0
0.1
0.2
0.3
0.4
0.5
0.6
0.7
0 5 10 15 20 25 30 35
# replies
Frequency
0
0.1
0.2
0.3
0.4
0.5
0.6
0.7
0 5 10 15 20 25 30 35 40
# replies
Frequency
0
0.1
0.2
0.3
0.4
0.5
0.6
0.7
0 5 10 15 20 25 30 35 40 45
# replies
Frequency
0
0.1
0.2
0.3
0.4
0.5
0.6
0 0.5 1 1.5 2 2.5 3
average points new threads
Frequency
0
0.1
0.2
0.3
0.4
0.5
0.6
0 1 2 3 4 5
average points new threads
Frequency
0
0.1
0.2
0.3
0.4
0.5
0.6
0 2 4 6 8 10
average points new threads
Frequency
0
0.1
0.2
0.3
0.4
0.5
0.6
0 0.5 1 1.5 2 2.5 3
average points replies
Frequency
0
0.1
0.2
0.3
0.4
0.5
0.6
0 1 2 3 4 5
average points replies
Frequency
0
0.1
0.2
0.3
0.4
0.5
0.6
0 2 4 6 8 10
average points replies
Frequency
Figure 3: Quantity and quality of interactions. LG (left), PG (middle) and OG (right).
sources or recipients of information in the same way.
4.1.6 Assortativity
The assortativity coefficient measures the level of ho-
mophyly of a graph, based on some labeling assigned
to the nodes. It is positive if similar nodes tend to con-
nect to each other, and negative otherwise. Table 1
lists the degree assortativity and the case of nominal
assortativity where each student is labeled according
to his/her final grade, considering in both cases the di-
rected graphs. For the nominal assortativity we have
obtained low values, suggesting randomness in the re-
lationships. For the degree assortativity, the negative
values obtained suggest relationships between the less
and the most active students, as it is desirable.
4.2 Per Student Behavior
Due to the fact that global level measures can hide
some characteristics of the graphs, it might be inter-
esting to study the distribution of the participation of
the students in each forum. Next, we briefly report the
results of such analysis.
4.2.1 Individual Centralities
In Figures 2 and 3 we depict the histograms of indi-
vidual degree centralities and number of new threads
or replies, which are good indicators of the students’
activity. The tail of the empirical out-degree and
number of replies distributions accumulates a non-
negligible probability. This is consistent with the
view that some nodes concentrate a significant part
CSEDU 2019 - 11th International Conference on Computer Supported Education
94

0
0.1
0.2
0.3
0.4
0.5
0 0.1 0.2 0.3 0.4 0.5 0.6 0.7
closeness
Frequency
0
0.1
0.2
0.3
0.4
0.5
0 0.1 0.2 0.3 0.4 0.5 0.6 0.7
closeness
Frequency
0
0.1
0.2
0.3
0.4
0.5
0 0.1 0.2 0.3 0.4 0.5 0.6 0.7 0.8
closeness
Frequency
Figure 4: Closeness centralities. LG (left), PG (middle) and OG (right).
0
0.2
0.4
0.6
0.8
1
0 0.1 0.2 0.3 0.4 0.5
directed betweenness
Frequency
0
0.2
0.4
0.6
0.8
1
0 0.05 0.1 0.15 0.2
directed betweenness
Frequency
0
0.2
0.4
0.6
0.8
1
0 0.05 0.1 0.15 0.2 0.25 0.3 0.35 0.4
directed betweenness
Frequency
0
0.2
0.4
0.6
0.8
1
0 0.1 0.2 0.3 0.4 0.5 0.6 0.7
undirected betweenness
Frequency
0
0.2
0.4
0.6
0.8
1
0 0.1 0.2 0.3 0.4 0.5 0.6
undirected betweenness
Frequency
0
0.2
0.4
0.6
0.8
1
0 0.1 0.2 0.3 0.4 0.5 0.6 0.7
undirected betweenness
Frequency
Figure 5: Betweenness centralities. LG (left), PG (middle) and OG (right).
of the activity of the graphs. Notice that the content
of teachers concentrates more that 36, 43 and 49 in-
teractions with more than 20 students in each one of
the three graphs. Among the students, the most active
ones (4, 5, 90) interact with several others. In addition
to the intensity of interactions, another factor is their
quality. Figure 3 shows the histograms of the aver-
age points obtained for posting new threads or replies
(remember the different limits of the scales used in
each forum, 3, 5 and 11, respectively). In general,
new threads and replies are positively voted, espe-
cially those of the lessons and programming forums.
It is important to highlight that a 70% of the best con-
tributors (those students whose posts always received
the maximum score) finally passed the course.
The alternative measures of centrality produce
similar, consistent findings. For example, the individ-
ual closeness centralities exhibit non-negligible tails
in their histograms, see Figure 4, revealing the exis-
tence of a small number of very active students (4, 5,
15, 23, 36, 90), close to many others. And for the
betweenness centralities, Figure 5 shows with the his-
tograms that the higher values are correlated to the
articulation points of each graph, listed previously.
Finally, Figure 6 depicts the histograms of the in-
dividual eigenvector centralities, taking into account
the undirected version of the graphs, weighted or not.
Again, we can observe the non-negligible probability
of the tails of the distributions (teacher and students
4, 5, 10, 25, 33, 90).
Next, in order to check the relationship among
the patterns of participation in the forums and the
achievements of the course, we have measured the
statistical correlations between the features under
study in this section and the final grades. The sample
correlations
ˆ
ρ were computed and the linear regres-
sion statistical test was used to quantify such correla-
tions. This test checks the statistical significance of
a linear fit of a response variable on one factor vari-
able. The estimated linear coefficient is denoted by
ˆ
β. Under the null hypothesis (meaning that there is
no such linear dependence) the test statistic follows a
t-distribution, so high values are very unlikely to ob-
serve empirically (James et al., 2013).
The result, in Table 2, shows a statistically signif-
icant positive dependence (
ˆ
ρ > 0.2) between almost
all the considered factors and the students’ perfor-
mance. Moreover, in order to understand the relation-
Investigating Interaction Patterns in Educational Forums: A Social Networks Analysis Approach
95

0
0.1
0.2
0.3
0.4
0.5
0.6
0.7
0 0.2 0.4 0.6 0.8 1
weighted eigenvector (with self-edges)
Frequency
0
0.1
0.2
0.3
0.4
0.5
0.6
0.7
0 0.2 0.4 0.6 0.8 1
weighted eigenvector (with self-edges)
Frequency
0
0.1
0.2
0.3
0.4
0.5
0.6
0.7
0 0.2 0.4 0.6 0.8 1
weighted eigenvector (with self-edges)
Frequency
0
0.1
0.2
0.3
0.4
0.5
0.6
0.7
0 0.2 0.4 0.6 0.8 1
unweighted eigenvector (with self-edges)
Frequency
0
0.1
0.2
0.3
0.4
0.5
0.6
0.7
0 0.2 0.4 0.6 0.8 1
unweighted eigenvector (with self-edges)
Frequency
0
0.1
0.2
0.3
0.4
0.5
0.6
0.7
0 0.2 0.4 0.6 0.8 1
unweighted eigenvector (with self-edges)
Frequency
Figure 6: Eigenvector centralities. LG (left), PG (middle) and OG (right).
0
0.1
0.2
0.3
0.4
0.5
0.6
0 5 10 15 20 25 30 35 40 45
crossclique #
Frequency
0
0.1
0.2
0.3
0.4
0.5
0.6
0 10 20 30 40 50
crossclique #
Frequency
0
0.1
0.2
0.3
0.4
0.5
0.6
0 10 20 30 40 50 60 70 80
crossclique #
Frequency
Figure 7: Crossclique numbers in the students’ networks. LG (left), PG (middle) and OG (right).
ship among the differents roles that each student plays
in each network, in Table 3 we show some correla-
tions that suggest a balanced behavior, as desirable.
Finally, in order to check the analogies among the dif-
ferent networks, in Table 4 we show some correlations
that suggest that many students show a similar pattern
of participation in the three forums.
4.2.2 Crossclique Number
The crossclique number counts the number of cliques
a node belongs to. Figure 7 depicts histograms of this
measure for the three networks. In the LG, students
with values higher than 10 are only 4, {4, 25, 53, 90}.
In the PG, the students with values higher than 20 are
just 3, {4, 5, 90}. Finally, in the OG, students with
values higher that 20 are {4, 10, 21, 36, 90}. Addition-
ally, the results in Table 2 indicate that in the three
graphs there is a statistically significant positive de-
pendence (again,
ˆ
ρ > 0.2) between membership to
many subgraphs and the students’ performance. Fi-
nally, values in Table 4 also suggest similarities re-
lated to this feature among the three forums.
5 CONCLUSIONS
In this paper, we have reviewed the extent to what
structural properties of networks can help to explain,
and ultimately predict, the behavior and performance
of students in online social learning environments, es-
pecially the ones which integrate support for informal
learning activities. Provided these informal activities
are well designed to capture the students’ interest and
engage them in participation, the structure of the col-
laboration networks reflects and contains useful, sta-
tistically significant information to identify the indi-
vidual patterns of engagement, the communities, as
well as the correlation between network position or
activity and the academic performance of students.
The work presented here focuses on the study of
participation in the forums, modeling and investigat-
ing the social relationships developed during a typical
undergraduate course. We have found evidence that
quality participation in this activity is significantly
correlated with the final outcome of the course, but
it is necessary to continue encouraging and reward-
ing it in order to increase the degree of involvement
CSEDU 2019 - 11th International Conference on Computer Supported Education
96

Table 2: Correlation between individual features in each graph and student’s performance.
May Final
Lessons Graph
ˆ
ρ (
ˆ
β,t, P(> |t|))
ˆ
ρ (
ˆ
β,t, P(> |t|))
in degree 0.2189 (0.5149, 2.5591, 1.16· 10
−2
) 0.2768 (0.6411,3.3351, 1.11· 10
−3
)
out degree 0.2401 (0.6325, 2.8192, 5.57· 10
−3
) 0.2393 (0.6352,2.8531, 5.01· 10
−3
)
number new threads 0.1927 (0.8942, 2.2401, 2.68· 10
−2
) 0.2593 (1.1634,3.1082, 2.31· 10
−3
)
number replies 0.1646 (0.3818, 1.9032, 5.93· 10
−2
) 0.1834 (0.4176,2.1613, 3.25· 10
−2
)
points new threads 0.1992 (0.3783, 2.318, 2.21· 10
−2
) 0.2514 (0.4611, 3.0081, 3.14· 10
−3
)
points replies 0.1772 (0.1572, 2.0542, 4.21· 10
−2
) 0.2025 (0.1751,2.3943, 1.81· 10
−2
)
directed betweenness 0.2089 (20.3111, 2.4361, 1.62· 10
−2
) 0.1727 (17.0614, 2.0301, 4.44· 10
−2
)
undirected betweenness 0.2206 (20.3111, 2.5802, 1.11· 10
−2
) 0.2011 (17.0614, 2.3762, 1.89· 10
−2
)
closeness 0.2901 (4.2911, 3.4552, 7.43· 10
−4
) 0.2956 (4.2402,3.5823, 4.77· 10
−4
)
weighted eigenvector 0.1702 (4.4565,1.9713, 5.09· 10
−2
) 0.1179 (3.0696,1.3756, 1.71· 10
−1
)
unweighted eigenvector 0.2572 (6.9747,3.0356, 2.91· 10
−3
) 0.2366 (6.3358,2.8191, 5.55· 10
−3
)
crossclique number 0.2488 (0.2601, 2.9291, 4.01· 10
−3
) 0.2665 (0.2742,3.2012, 1.71· 10
−3
)
Programming Graph
ˆ
ρ (
ˆ
β,t, P(> |t|))
ˆ
ρ (
ˆ
β,t, P(> |t|))
in degree 0.2585 (0.5633, 3.0521, 2.76· 10
−3
) 0.2425 (0.5227,2.8941, 4.44· 10
−3
)
out degree 0.2226 (0.4688, 2.6041, 1.03· 10
−2
) 0.2066 (0.4418,2.4453, 1.58· 10
−2
)
number new threads 0.2035 (0.6394, 2.3701, 1.93· 10
−2
) 0.1989 (0.6028,2.3501, 2.02· 10
−2
)
number replies 0.3172 (0.6326, 3.8141, 2.11· 10
−4
) 0.2708 (0.5383,3.2574, 1.42· 10
−3
)
points new threads 0.1963 (0.1333, 2.2834, 2.41· 10
−2
) 0.1928 (0.1271,2.2753, 2.45· 10
−2
)
points replies 0.3186 (0.1462, 3.8321, 1.97· 10
−4
) 0.2733 (0.1251,3.2891, 1.28· 10
−3
)
directed betweenness 0.1835 (23.9093, 2.1294, 3.52· 10
−2
) 0.1754 (23.2548, 2.0632, 4.12· 10
−2
)
undirected betweenness 0.1981 (23.9093, 2.3051, 2.28· 10
−2
) 0.1922 (23.2548, 2.2681, 2.49· 10
−2
)
closeness 0.3488 (4.9687, 4.2442, 4.14· 10
−5
) 0.3604 (5.0941,4.4732, 1.63· 10
−5
)
weighted eigenvector 0.1286 (3.8211,1.4798, 1.41· 10
−1
) 0.1439 (4.3298,1.6845, 9.46· 10
−2
)
unweighted eigenvector 0.2105 (4.2566,2.4567, 1.54· 10
−2
) 0.2639 (5.3481,3.1671, 1.91· 10
−3
)
crossclique number 0.2117 (0.1331, 2.4713, 1.48· 10
−2
) 0.2109 (0.1333,2.4987, 1.37· 10
−2
)
Organization Graph
ˆ
ρ (
ˆ
β,t, P(> |t|))
ˆ
ρ (
ˆ
β,t, P(> |t|))
in degree 0.2035 (0.4045, 2.3712, 1.92· 10
−2
) 0.2022 (0.4069,2.3912, 1.82· 10
−2
)
out degree 0.2331 (0.4814, 2.7321, 7.17· 10
−3
) 0.1767 (0.3692,2.0782, 3.96· 10
−2
)
number new threads 0.2107 (0.8142, 2.4582, 1.53· 10
−2
) 0.2176 (0.8351,2.5821, 1.09· 10
−2
)
number replies 0.1691 (0.3196, 1.7623, 5.25· 10
−2
) 0.1505 (0.2824,1.7624, 8.03· 10
−2
)
points new threads 0.2015 (0.0847, 2.3461, 2.05· 10
−2
) 0.2171 (0.0907,2.5742, 1.12· 10
−2
)
points replies 0.1911 (0.0481, 2.2193, 2.82· 10
−2
) 0.1806 (0.4052,2.1263, 3.53· 10
−2
)
directed betweenness 0.1712 (32.9823, 1.9812, 4.97· 10
−2
) 0.1243 (24.1481, 16.6465, 1.49· 10
−1
)
undirected betweenness 0.2076 (32.9823, 2.4201, 1.69· 10
−2
) 0.1681 (24.1483, 1.9743, 5.05· 10
−2
)
closeness 0.2259 (3.0287, 2.6453, 9.17· 10
−3
) 0.2181 (2.9128,2.5863, 1.08· 10
−2
)
weighted eigenvector 0.1371 (3.5669,1.5773, 1.17· 10
−1
) 0.2111 (5.3343,2.4994, 1.37· 10
−2
)
unweighted eigenvector 0.2111 (4.9496,2.4632, 1.51· 10
−2
) 0.2526 (5.9487,3.0234, 3.01· 10
−3
)
crossclique number 0.2428 (0.1109, 2.8546, 5.02· 10
−3
) 0.2094 (0.0971,2.4802, 1.44· 10
−2
)
Table 3: Correlation between number of new threads and replies posted per student in each forum.
ˆ
ρ (
ˆ
β,t, P(> |t|))
Lessons Graph 0.4707 (0.2388,6.176, 7.35· 10
−9
)
Programming Graph 0.6794 (0.4456, 10.719, 2.01· 10
−16
)
Organization Graph 0.5637 (0.2757, 7.9021, 8.92· 10
−13
)
of students. We believe that this study contributes to
a better understanding of the learning experience and
possibly to devise more effective designs of this aca-
demic activity.
REFERENCES
Barab´asi, A. (2016). Network science. Cambridge Univer-
sity Press.
Investigating Interaction Patterns in Educational Forums: A Social Networks Analysis Approach
97

Table 4: Correlation between individual features in different forums.
Lessons - Programming Graphs
ˆ
ρ (
ˆ
β,t, P(> |t|))
in degree 0.5514 (0.5132, 7.6531,3.46· 10
−12
)
out degree 0.5517 (0.4444, 7.6582,3.37· 10
−12
)
number new threads 0.2354 (0.1591, 2.8041, 5.81· 10
−3
)
number replies 0.6396 (0.5584, 9.6332,2.01· 10
−16
)
points new threads 0.2517 (0.0905, 3.0111, 3.11· 10
−3
)
points replies 0.6553 (0.3465, 10.0432,2.01· 10
−16
)
directed betweenness 0.1639 (0.2198, 1.9232, 5.65· 10
−2
)
undirected betweenness 0.0839 (0.0618, 0.9751, 3.31· 10
−1
)
closeness 0.9671 (0.9414, 43.9851,2.01· 10
−16
)
weighted eigenvector 0.2146 (0.2481, 2.5432, 1.21· 10
−2
)
unweighted eigenvector 0.5813 (0.4399, 8.2711, 1.17· 10
−13
)
crossclique number 0.5664 (0.3479, 7.9562,6.61· 10
−13
)
Lessons - Organization Graphs
ˆ
ρ (
ˆ
β,t, P(> |t|))
in degree 0.5291 (0.4596, 7.2184,3.55· 10
−11
)
out degree 0.6401 (0.5038, 9.6451,2.01· 10
−16
)
number new threads 0.3316 (0.2836, 4.0711, 8.02· 10
−5
)
number replies 0.6283 (0.5181, 9.3511,2.62· 10
−16
)
points new threads 0.3452 (1.5128, 4.2571, 3.86· 10
−5
)
points replies 0.5643 (1.9489, 7.9132,8.36· 10
−13
)
directed betweenness 0.3085 (0.6065, 3.7551, 2.58· 10
−4
)
undirected betweenness 0.1365 (0.1875, 1.5951, 1.12· 10
−1
)
closeness 0.8821 (0.8115, 21.6732,2.01· 10
−16
)
weighted eigenvector 0.3458 (0.3508, 4.2663, 3.73· 10
−5
)
unweighted eigenvector 0.6132 (0.5437, 8.9886, 2.08· 10
−15
)
crossclique number 0.6034 (0.2716, 8.7612,7.49· 10
−15
)
Programming - Organization Graphs
ˆ
ρ (
ˆ
β,t, P(> |t|))
in degree 0.5201 (0.4855, 7.0501,8.59· 10
−11
)
out degree 0.8066 (0.7881, 15.7984,2.01· 10
−16
)
number new threads 0.3133 (0.3967, 3.8191, 2.04· 10
−4
)
number replies 0.7548 (0.7791, 5.1073, 1.11· 10
−6
)
points new threads 0.2962 (0.4668, 3.5911, 4.62· 10
−4
)
points replies 0.7268 (1.3275, 12.2521,2.01· 10
−16
)
directed betweenness 0.3995 (0.5854, 5.0452, 1.45· 10
−6
)
undirected betweenness 0.5447 (1.1065, 7.5191,7.11· 10
−12
)
closeness 0.8826 (0.8342, 21.7434,2.01· 10
−16
)
weighted eigenvector 0.4458 (0.3913, 5.7654, 5.36· 10
−8
)
unweighted eigenvector 0.6331 (0.7416, 9.4684, 2.01· 10
−16
)
crossclique number 0.6445 (0.4724, 9.7651,2.01· 10
−16
)
Cadima, R., Ojeda, J., and Monguet, J. (2012). So-
cial networks and performance in distributed learn-
ing communities. Educational Technology & Society,
15(4):296–304.
Chung, K. and Paredes, W. (2015). Towards a social net-
works model for online learning & performance. Ed-
ucational Technology & Society, 18(3):240–253.
Cross, J. (2006). Informal learning: Rediscovering the
natural pathways that inspire innovation and perfor-
mance. Pfeiffer.
Dado, M. and Bodemer, D. (2017). A review of method-
ological applications of social network analysis in
computer-supported collaborative learning. Educa-
tional Research Review, 22:159–180.
Dawson, S. (2008). A study of the relationship between
student social networks and sense of community. Ed-
ucational Technology & Society, 11(3):224–238.
Gaggioli, A., Mazzoni, E., Milani, L., and Riva, G. (2015).
The creative link: Investigating the relationship be-
tween social network indices, creative performance
and flow in blended teams. Computers in Human Be-
havior, 42(1):157–166.
Haythornthwaite, C. (2008). Learning relations and net-
works in web-based communities. Journal of Web
Based Communities, 4(3):140–158.
Heo, H., Lim, K., and Kim, Y. (2010). Exploratory study
on the patterns of online interaction and knowledge
co-construction in project-based learning. Computers
CSEDU 2019 - 11th International Conference on Computer Supported Education
98

& Education, 55(3):1383–1392.
Hommes, J., Rienties, B., Grave, W., Bos, G., Schuwirth,
L., and Scherpbier, A. (2012). Visualising the invisi-
ble: A network approach to reveal the informal social
side of student learning. Advances in Health Sciences
Education, 17(5):743–757.
James, G., Witten, D., Hastie, T., and Tibshirani, R. (2013).
An introduction to statistical learning with applica-
tions in R. Springer.
Jan, S. and Viachopoulos, P. (2018). Influence of learn-
ing design of the formation of online communities of
learning. International Review of Research in Open
and Distributed Learning, 19(4).
Laat, M., Lally, V., Lipponen, L., and Simons, R. (2007).
Investigating patterns of interaction in networked
learning and computer-supported collaborative learn-
ing: A role for social network analysis. International
Journal of Computer-Supported Collaborative Learn-
ing, 2(1):87–103.
Lin, J., Mai, L., and Lai, Y. (2015). Peer interaction and so-
cial network analysis of online communities with the
support of awareness of different contexts. Interna-
tional Journal on Computer-Supported Collaborative
Learning, 10(2):161–181.
Manca, S., Delfino, M., and Mazzoni, E. (2009). Cod-
ing procedures to analyse interaction patterns in ed-
ucational web forums. Journal of Computer Assisted
Learning, 25(2):189–200.
Newman, M. (2010). Networks: An introduction. Oxford
University Press.
Putnik, G., Costa, E., Alves, C., Castro, H., Varela, L., and
Shah, V. (2016). Analysis of the correlation between
social network, analysis measures and performance of
students in social network-based engineering educa-
tion. International Journal of Technology and Design
Education, 26(3):413–437.
Rienties, B. (2009). The role of academic motivation in
computer-supported collaborative learning. Comput-
ers in Human Behavior, 25(6):1195–1206.
Shea, P., Hayes, S., Smith, S., Vickers, J., Bidjerano, T.,
Gozza-Cohen, M., Jian, S., Pickett, A., Wilde, J.,
and Tseng, C. (2013). Online learner self regulation:
Learning presence, viewed through quantitative con-
tent and social network analysis. International Review
of Research in Open and Distributed Learning, 14(3).
Siqin, T., Aalst, J., and Chu, K. (2015). Fixed group and
opportunistic collaboration in a cscl environment. In-
ternational Journal on Computer-Supported Collabo-
rative Learning, 10(2):161–181.
Sousa, M., L´opez, J., and Fern´andez, M. (2018). The net-
work structure of interactions in online social learning
environments. In Communications in Computer and
Information Science. Computer Supported Education.
Springer.
Sousa, M., L´opez, J., Fern´andez, M., Rodr´ıguez, M., and
L´opez, C. (2017). Mining relations in learning-
oriented social networks. Computer Applications in
Engineering Education, 25(5):769–784.
Stepanyan, K., Mather, R., and Dalrymple, R. (2014). Cul-
ture, role and group work: A social network analysis
perspective on an online collaborative course. British
Journal of Educational Technology, 45(4):676–693.
Tirado, R., Hernando, A., and Aguaded, J. (2015). The ef-
fect of centralization and cohesion on the social con-
struction of knowledge in discussion forums. Interac-
tive Learning Environments, 23(3):293–316.
Toikkanen, T. and Lipponen, L. (2011). The applicati-
bility of social network analysis to the study of net-
worked learning. Interactive Learning Environments,
19(4):365–379.
Vercellone-Smith, P., Jablokow, K., and Friedel, C. (2012).
Characterizing communication networks in a web-
based classroom: Cognitive styles and linguistic be-
havior of self-organizing groups in online discussions.
Computers & Education, 59(2):222–235.
Xie, K., Yu, C., and Bradshaw, A. (2014). Impacts of
role assigment and participation in asynchronous dis-
cussions in college-level online classes. Internet and
Higher Education, 20:10–19.
Investigating Interaction Patterns in Educational Forums: A Social Networks Analysis Approach
99
