Optimization of Rainwater Harvesting Sites using GIS
Ruhina Karani
1,∗
, Anant Joshi
2,†
, Miloni Joshi
2,†
, Sarmishta Velury
2,†
and Saumya Shah
2,†
Computers Department, Dwarkadas J. Sanghvi College of Engineering, University of Mumbai, Mumbai, India
Keywords:
Rainwater Harvesting, DEM, India, Drought.
Abstract:
Water scarcity is hitting new peaks every day and is exacerbated by the current rapid climatic change. Demand
for clean water in India is very high, especially for agriculture and consumption. One way to cater to these
needs is through rainwater harvesting. Through this paper, we propose a framework that optimizes the site
selection for reservoirs by intersecting various data points. Our framework uses a three-step approach to
combine stream networks, digital elevation, and soil quality to produce the most viable reservoir sites. Our
framework is easy to implement and highly scalable. For the purpose of this paper and a proof of concept, we
restrict our focus to the arid Beed district in the state of Maharashtra, India. Our approach provides consistent
results that are corroborated by the manual inferences that can be drawn from the data under consideration.
1 INTRODUCTION
India is a large and diverse country. Its exponen-
tial progress is tethered down by problems like water
scarcity and floods. Due to over-exploitation of water
resources, many of our freshwater sources are getting
depleted. Groundwater is not getting recharged. The
persistent water shortage issue and intense droughts
could be mitigated through large scale rainwater har-
vesting.
The aim of our project is to create an accurate, and
adaptable system which would provide better decision
making, and easier planning, when laying out any
plans for rainwater harvesting. Hydro-logical plan-
ning should take into account the amount of rainfall
an area receives, the groundwater and soil conditions,
land use and land cover and water requirement. Po-
tential sources for rainwater need to be identified. We
intend to use data from various sources, such as To-
pographical Maps, 3D terrain models, meteorologi-
cal data, administrative data, etc. This data will be
merged to simulate water conservation structures such
as reservoirs, canals, dams, etc.
The idealistic aim for the project is to make a sys-
tem efficient enough to serve India with the objective
of careful use of water resources and optimization to
increase the water harvesting capacity. The frame-
work and methodology followed can be used univer-
sally for the purpose of demonstration. We have con-
∗
Principal Investigator.
†
Equal contribution.
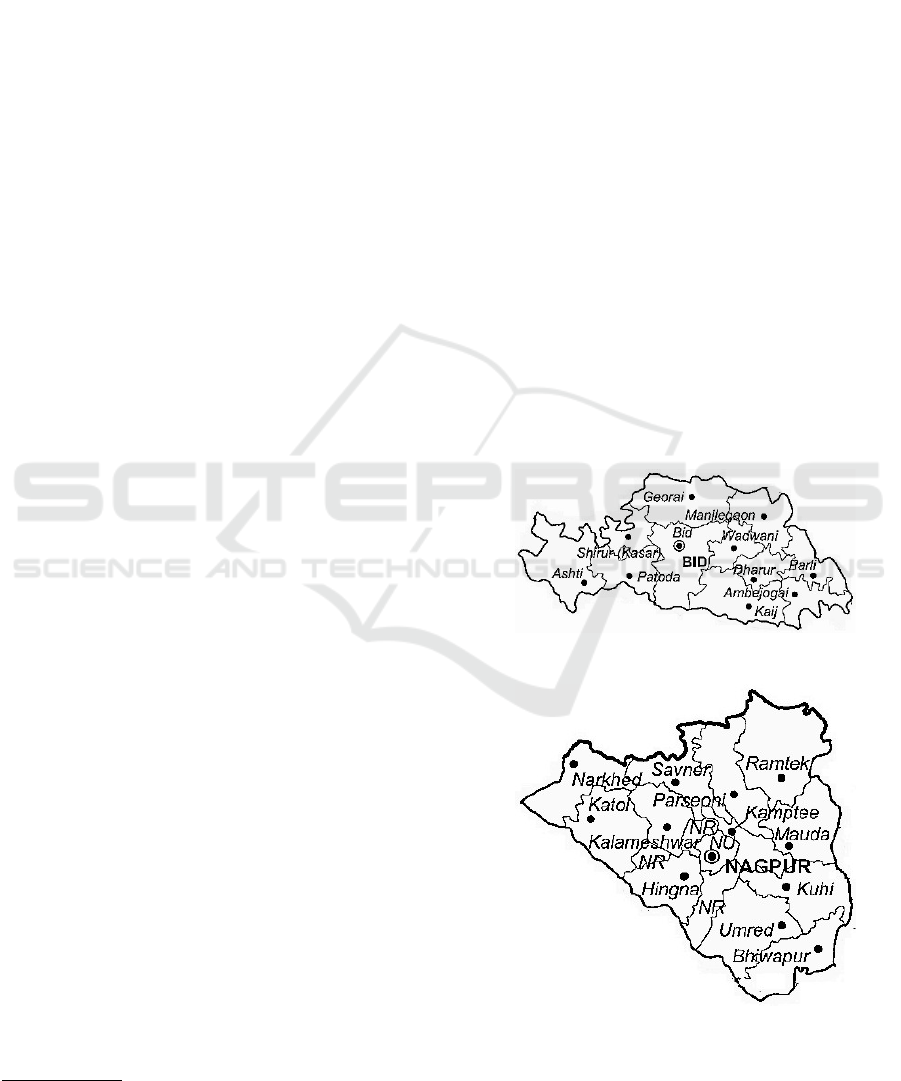
centrated on the Beed and Nagpur district of Maha-
rashtra, which often suffers from droughts.
Figure 1: Map for Beed district.
Figure 2: Map for Nagpur district.
228
Karani, R., Joshi, A., Joshi, M., Velury, S. and Shah, S.
Optimization of Rainwater Harvesting Sites using GIS.
DOI: 10.5220/0007722302280233
In Proceedings of the 5th International Conference on Geographical Information Systems Theory, Applications and Management (GISTAM 2019), pages 228-233
ISBN: 978-989-758-371-1
Copyright
c
2019 by SCITEPRESS – Science and Technology Publications, Lda. All rights reserved

2 MOTIVATION
Clean, potable water is a requirement for all land-
based biological activity. However, in the past few
years, there is a decreasing amount of water avail-
able for humans to consume because of multitude of
factors such as unpredictable rainfall, droughts, over-
utilization of wells, inefficient farming techniques,
etc.
Most of Maharashtra faces drought crisis during
the monsoon season. The drought in 2013 was con-
sidered as the region’s worst drought in 40 years. The
worst-hit areas in Maharashtra were Solapur, Parb-
hani, Sangli, Pune, Satara, Beed and Nashik. Beed,
a district in central Maharashtra, suffers with a seri-
ous drought crisis. In 2015, Beed (G Seetharaman,
2016) received less than 50 per cent of its average an-
nual rainfall of 670 mm. The previous year had only
been slightly better with 55.6 per cent of the average
rainfall. This has affected the groundwater level in
the district. Beed, along with Osmanabad and Latur,
is the most waterstarved in the Marathwada region
where the state government has declared droughtlike
conditions. According to a recent Press Trust of In-
dia report (Press Trust of India, 2016), there is only 5
per cent water in Marathwada’s dams. Beed collector
Ram says the government spent around Rs 80 crore in
2015-16 on water conservation projects in the district.
In 2018 (TNN, 2018), districts in the state have been
declared as drought-prone.
Hence, we introduce simulation based modelling
and optimization, to increase the efficiency, and water
harvesting capacity of these efforts. The system can
potentially play an important part in making appro-
priate decisions to lay out water-harvesting resources,
and thus increase the amount of water available to
people.
3 REVIEW OF LITERATURE
This paper (Jasrotia et al., 2009) suggests a study of
the water resources. The water balance study using
the Thornthwaite and Mather (TM) models with the
help of remote sensing and GIS found out the mois-
ture deficit and moisture surplus for an entire water-
shed. It showed that the maximum annual runoff re-
sulted from the built-up areas/water body followed by
agricultural land, dense forest and minimum for the
barren land and open forest. GIS software had been
used for spatial analysis of various thematic layers
and integration to produce the final runoff map. Af-
ter the runoff map was produced, it was found that
suitable sites for rainwater harvesting structures ac-
counted only for a fraction of the actual watershed
area whereas the rest of the area was unsuitable site
for rainwater harvesting.
This paper (Mahmoud and Alazba, 2014). says
that the very first step in rainwater harvesting is to
trap the rainfall where it falls. To accomplish this, a
geographic information system (GIS ) based decision
support system (DSS) was implemented, which fo-
cused on developing a methodology to suggest poten-
tial sites for in-situ water harvesting (IWH) consid-
ering factors such as rainfall, slope, potential runoff
coefficient (PRC), land cover/use, and soil texture.
Another research study made use of GIS and Re-
mote Sensing to delineate potential sites for rain-
water harvesting. This methodology (Kumar et al.,
2008). carried out their research in the districts of Ut-
tar Pradesh. They used thematic maps consisting of
land-use/land-cover, geomorphology as layers along
with geology and drainage integrated with the GIS
system. The maps were weighted by importance and
multiplied with the ranked features of each site. An
average score for each of the features was obtained
and integrated into the GIS system for inference.
Here, (Ziadat et al., 2012) applied a GIS approach
for identifying the suitability for rainwater harvesting
interventions in Jordan. They integrated biophysical
criteria such as slope, vegetation cover, soil texture,
and soil depth with socio-economic parameters such
as land owner and then modified the criteria. Each
criterion was assigned one of two ratings: best or sec-
ond best. These ratings provided more flexibility for
determining the suitability of an intervention.
This paper (Naseef and Thomas, 2016) used the-
matic maps and soil cover to determine optimum lo-
cations for rainwater harvesting in the state of Ker-
ala near the Kechri river basin. Aster Digital Eleva-
tion Model (DEM), Rainfall data are needed for this
study. Daily rainfall data of all stations situated in and
near Kecheri river basin was obtained. The thematic
maps used in this study are Landuse map, Classified
slope map, Stream order map, Runoff potential map
and Soil permeability map.An overlay of these fea-
tures is obtained using an appropriate GIS system to
get the desired locations.
4 METHODOLOGY
The system consists of two major components, that
need to be related. The features of the terrain are pro-
cessed, along with perennial stream networks to de-
termine watershed regions, and their capacity. Data
about soil type and quality is factored in to ensure
that i) regions with less porous soil are used to reduce
Optimization of Rainwater Harvesting Sites using GIS
229
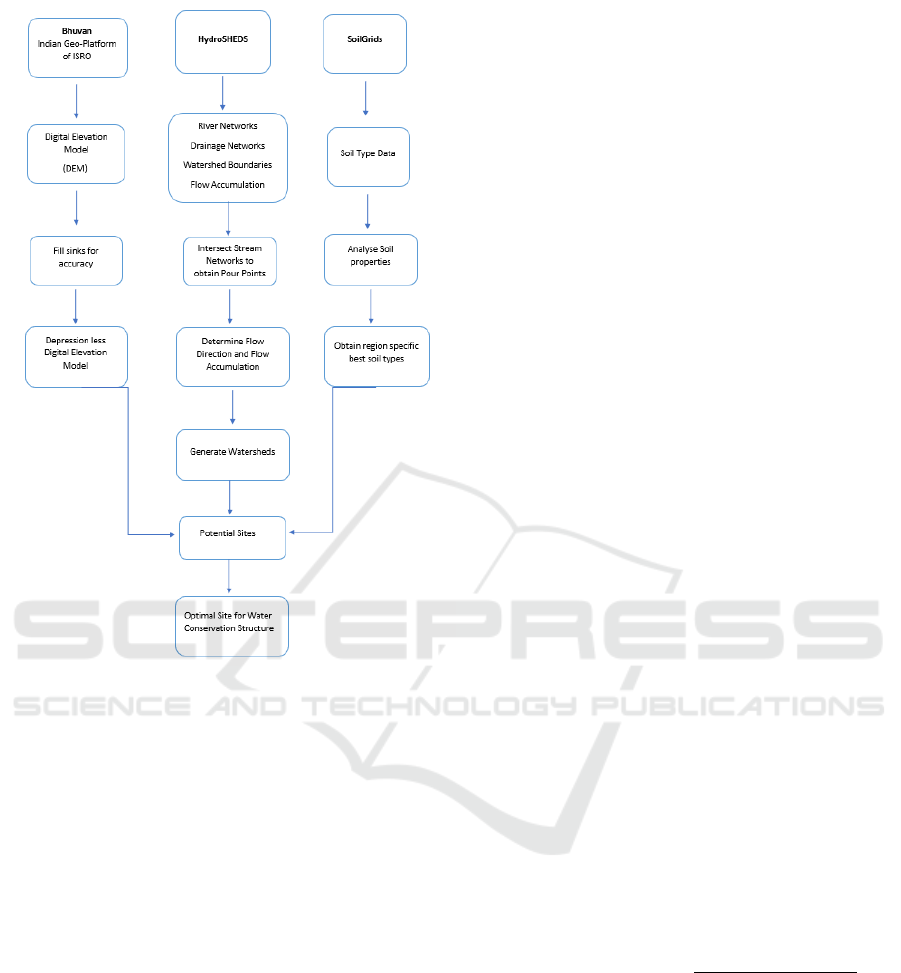
Figure 3: Overview of system architecture and processing.
seepage loss, and ii) less cropland is converted for
rainwater harvesting purposes. These features pro-
vide us a way to estimate the utility of each watershed
region as a potential site for rainwater harvesting.
Data about the terrain can be obtained in various
forms, but we chose a Raster Digital Elevation Model
(DEM), as it is universally obtainable for nearly all
regions, improving repeatability of the method. Hy-
drological conditioning of the DEM is performed to
reduce error in watershed delineation. Once the wa-
tersheds are delineated, the terrain is analyzed over
several metrics, to obtain an aggregate score for each
watershed. These scores are then used to recommend
the watersheds in which rainwater harvesting systems
should be constructed.
4.1 Hydrological Conditioning
The process of hydrological conditioning is per-
formed as follows:
1. A depressionless DEM is created by filling in
sinks.
2. Flow direction is computed for every raster cell.
3. Flow accumulation is computed for every raster
cell.
4. Points of intersection of the perennial stream net-
work are used as pour points.
4.2 Watershed Delineation
The outcomes of hydrological conditioning, namely
the depression-less DEM, the Flow accumulation
raster, and the pour points are used to delineate the
watersheds in the manner described in (Susan K. Jen-
son, 1988).
4.3 Metrics
Site suitability cannot be decided without taking the
method of rainwater harvesting into account. The
chief method of rainwater harvesting in rural India,
especially rural Maharashtra is through the creation of
small-scale mud reservoirs, or embankments around
one or more sides of a natural basin. These are known
as ‘bunds’. These bunds are inexpensive to build, re-
quire materials that are locally available, and are easy
to build. Therefore, we have devised the following
metrics taking the needs of bund-based rainwater har-
vesting into account.
The metrics we have chosen to use are explained
below.
4.3.1 Watershed Capacity
We normalize the capacity of the watershed per unit
area to remove bias towards large watersheds. This
capacity is calculated by estimating a given level of
precipitation over the area, and computing the water
retained at the surface, using the slope characteristics,
and infiltration potential of the soil. This met-
ric is computed over several levels of precipitation,
and a weighted average is computed as the final score.
Capacity =
∑
n
i=1
∑
levels
j=1
retention
j
×in f iltration
j
slope
j
×precipitationlevel
i
4.3.2 Watershed Density
For rainwater harvesting systems, it is favourable if
the storage capacity of the watershed is concentrated
over a smaller area as compared to a larger one. This
would permit the pooling of resources over a smaller
area, reduce evaporative and ingress losses, and en-
able farmers to use check-dams on natural depres-
sions. This is computed by calculating the ratio of the
total surface capacity of the watershed to the surface
area it is spread over. This is done for multiple levels
GISTAM 2019 - 5th International Conference on Geographical Information Systems Theory, Applications and Management
230

of precipitation, and a weighted average is computed
for the final score.
Density =
Capacity
Area
4.3.3 Soil Characteristics
Soil Characteristics such as permeability, as well as
regional crop suitability are taken into account. This
allows us to ensure that fertile cropland doesn’t get
destroyed for these purposes, as well as to reduce
ingress loss at the site.
The regions consist primarily of Calcisoils, Verti-
sols, and Kastanozems. Vertisols are moderately fer-
tile, clayey, and have a low porosity. They are suit-
able for agriculture if properly maintained. The re-
gions in question both have significant agriculture in
these soil types. Calcisoils are mainly found in arid
reigons, as the ones we see here, and are less suit-
able for agriculture. They are highly porous soils, due
to their loose composition. Kastanozems are highly
fertile, and humus rich. They are the most suitable
for agriculture. Thus, for our purposes, Calcisoils are
most suitable for rainwater harvesting, despite their
porosity, as they are used for less agriculture. Verti-
sols are less suitable and are hence weighted lower.
Areas with Kastanozems are small and used heavily
for farming, so they are weighted the least. After
analysis, we chose the weights 0.6, 0.3, and 0.1 for
Calcisoils, Vertisols, and Kastanozems respectively.
4.4 Combination
The watershed metrics are combined by taking the
weighted average of the watershed metrics above.
Each soil type is a multiplier, computed on the basis
of its permeability, and crop-suitability. This allows
us to weight our overall suitability score by the prod-
uct of the watershed score with the soil multiplier.
5 IMPLEMENTATION
The project is implemented in ArcGIS, as it is the
industry-standard for GIS applications. Each pro-
cess detailed in 4 has a corresponding ArcGIS imple-
mentation. The DEM data is the CartoDEM, created
by the Indian Space Research Organization, obtained
through its Bhuvan platform. It has a resolution of
1 arc second, which is equivalent to approximately
10m. It was published in May 2015. Stream networks
were obtained through the HydroSHEDS Asia Stream
Networks. It has a resolution of 3 arc seconds ( 90m
at the equator). All datasets use the WGS 1984 spatial
reference system.
The soil data was obtained through the ISRIC
SoilGRIDS dataset. It is a global system for auto-
mated mapping of soil classes and properties at 250m
resolution.
5.1 Hydrological Conditioning
The hydrological conditioning steps were performed
using the corresponding ArcGIS tools, i.e. The sinks
were filled in using the Fill tool, the Flow direction
was computed using the Flow Direction tool, and flow
accumulation using the Flow Accumulation tool. The
pour points were obtained by intersecting the vectors
of each individual stream, to obtain a set of intersec-
tion points, using the Intersect tool.
5.2 Watershed Boundaries
The watershed boundaries are computed using the
Watershed tool.
5.3 Watershed Capacity
This was computed by estimating basin volume, mi-
nus the percolation amount, obtained through the
runoff curve values. This gives an estimate of the true
capacity of a given basin to retain water. This pro-
cess is repeated multiple times to obtain a weighted
average score.
5.4 Wateshed Density
This is computed by obtaining the resultant surface
area of the waterlogged region, at varying water vol-
umes. This process was repeated at several levels, and
a weighted mean was taken.
5.5 Soil Characteristics
The soil data was obtained through SoilGRIDS, and
each type of soil was manually analysed. Each coeffi-
cient was calculated, and assigned to a particular type
of soil. Each watershed’s total coefficient was calcu-
lated by weighting the areas of each soil type, with
their respective coefficients, and dividing it by the to-
tal area of the watershed.
5.6 Final Score
The final score is computed as mentioned in 4.4. The
suitability of the entire watershed is then visualized
based on the score by assigning them colors on a spec-
trum of blue to red. Blue means high suitability, while
red means low.
Optimization of Rainwater Harvesting Sites using GIS
231
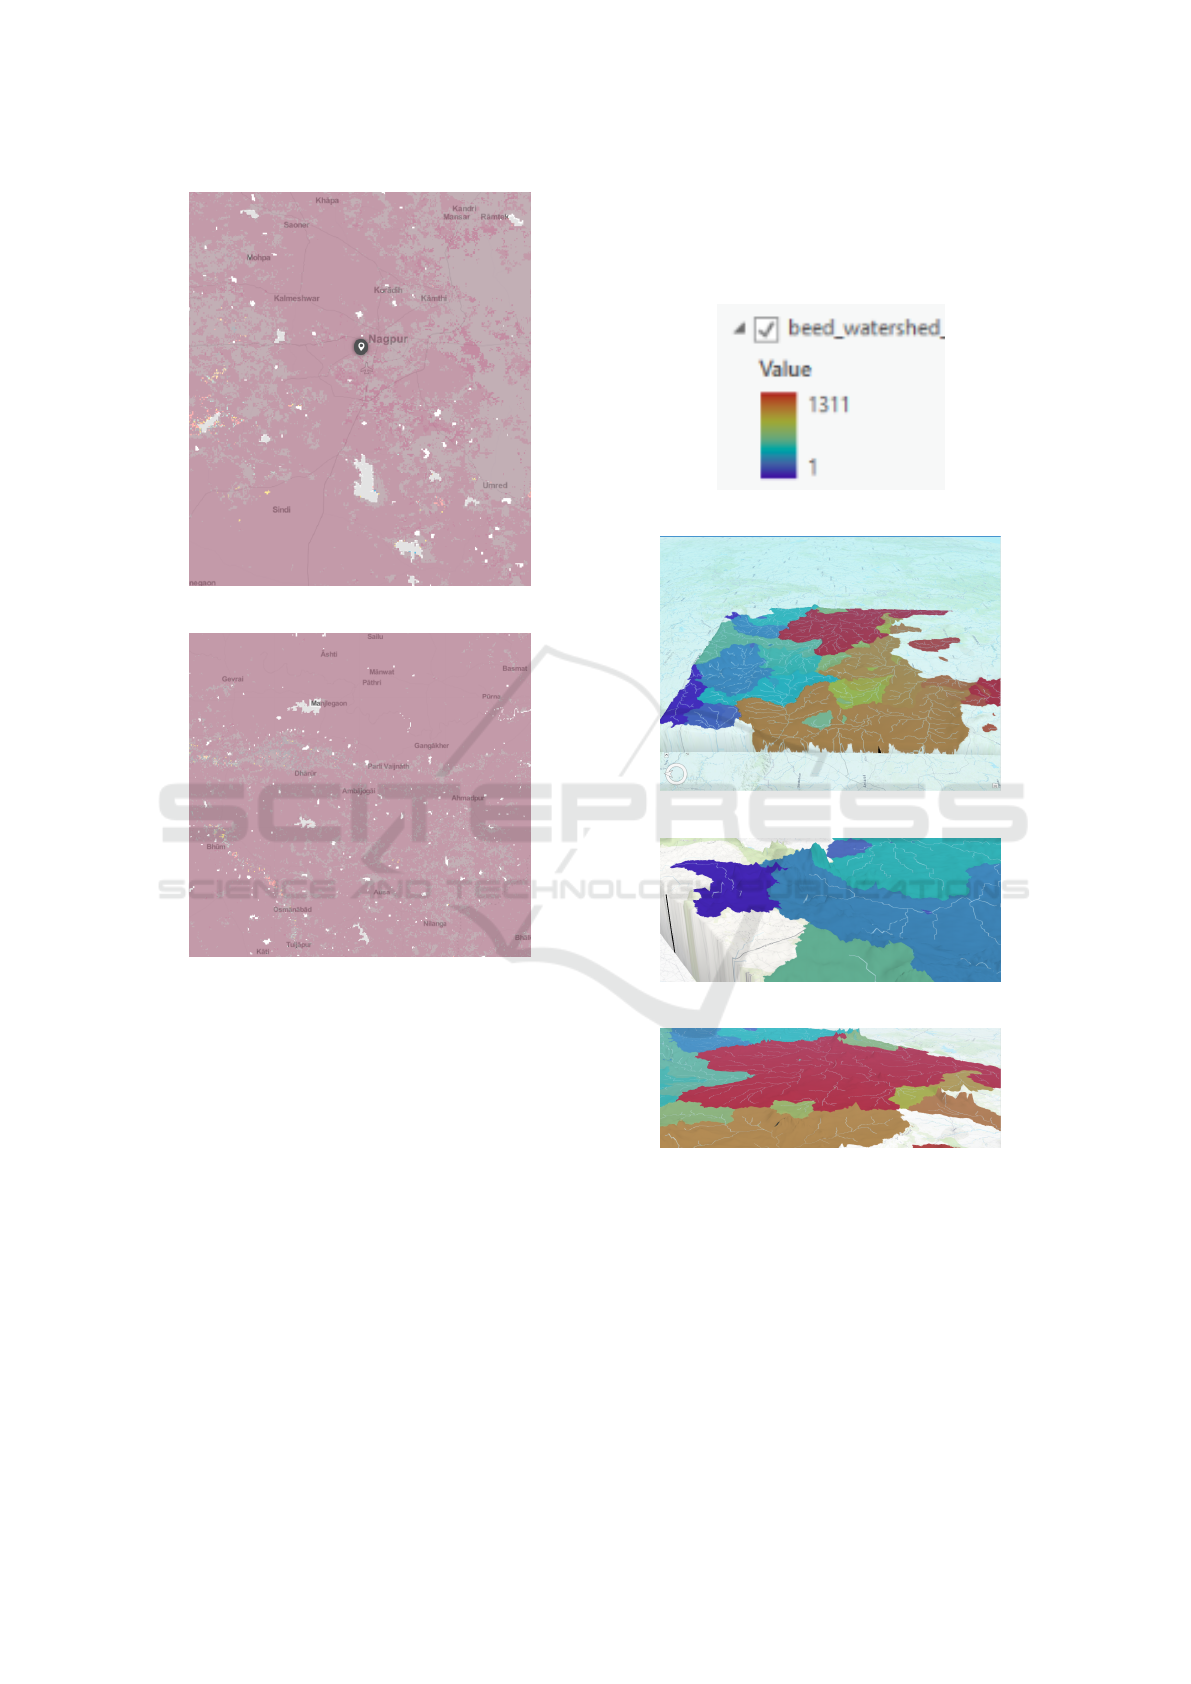
Figure 4: Soil Coverage in the Nagpur District.
Figure 5: Soil Coverage in the Beed District.
Watershed density was given the highest weigh-
tage, as a watershed with large capacity over a large
area is not as useful for harvesting. However, too
small a capacity is also detrimental, hence this term
is also included in the score.
Since the region contains just a few soils, we
performed a manual study of the soils and assigned
weights according to their properties.
6 RESULTS AND DISCUSSION
Results generated for the Nagpur area using the de-
scribed framework, along with the legend have been
depicted in 6, 8 and 9. The results for Beed are de-
picted in 7. The generated results have been assigned
a colour scale to make it easy to understand the de-
gree of usability of the watersheds delineated. Here,
we see that the gradation from dark blue to red indi-
cate suitability from best to worst.
The suitability score has values in the possible
range of:
Figure 6: Site Legend.
Figure 7: Results obtained for the Beed district.
Figure 8: Best site for Rainwater Harvesting in Nagpur.
Figure 9: Worst site for Rainwater Harvesting in Nagpur.
The Marathwada region of India is a highly arid
region with vast undulating planes. As such, the wa-
tersheds generated are much larger than average. Ver-
tisols cover a vast majority of the area and have high
water retention. Rainwater received in this area is sig-
nificantly lesser than the required amount, especially
for the largely agrarian occupations in the region.
By using permanent stream networks, we have
provided a way to leverage perennial stream water and
stream networks to find suitable watersheds. By re-
lying entirely on satellite data, we have reduced the
GISTAM 2019 - 5th International Conference on Geographical Information Systems Theory, Applications and Management
232

reliance on human data collection that is usually re-
quired for such a vast undertaking. Moreover, the lo-
cation independent nature of the framework make it
applicable to any area of the world, as long as there is
satellite data available.
The results produced by our model have been able
to make fairly consistent inferences pertaining to the
construction of dams, canals at the requisite loca-
tions. Based on the satellite data found, the methodol-
ogy has provided decent visualizations of the possible
construction locations.
7 CONCLUSION
Our methodology can be used for any location and
will provide results irrespective of the district of in-
vestigation. The algorithm requires three layers for
reaching its conclusion - the DEM, hydrosheds and
soil grids for a location specified by its latitude and
longitude. Since the data is available for the whole
country, the implementation can be reproduced for
any location.
In terms of future scope, we could use this
methodology on different districts in different parts
of the country where the climate and soil conditions
would be considerably different from those in the
state of Maharashtra. Another improvement to the im-
plementation would be to use topography data avail-
able from the Government of India which would in-
crease the accuracy of the model, if used above the
Digital Elevation Model.
ACKNOWLEDGEMENTS
We would like to thank Dr. Narendra M. Shekokar,
Head of Department, Computers, and Dr. Hari Va-
sudevan, Principal, Dwarkadas J. Sanghvi College
of Engineering, for their steady support and guid-
ance. We would also like to thank the University
Grants Commission, for providing the “Minor Re-
search Grant”, without which this project would not
have been possible.
REFERENCES
G Seetharaman, E. T. (2016). Beed in marathwada bone dry
after two years of drought.
Jasrotia, A. S., Majhi, A., and Singh, S. (2009). Water bal-
ance approach for rainwater harvesting using remote
sensing and gis techniques, jammu himalaya, india.
Water Resources Management, 23(14):3035–3055.
Kumar, M. G., Agarwal, A. K., and Bali, R. (2008). Delin-
eation of potential sites for water harvesting structures
using remote sensing and gis. Journal of the Indian
Society of Remote Sensing, 36(4):323–334.
Mahmoud, S. H. and Alazba, A. A. (2014). The potential
of in situ rainwater harvesting in arid regions: devel-
oping a methodology to identify suitable areas using
gis-based decision support system.
Naseef, T. A. U. and Thomas, R. (2016). Identification of
suitable sites for water harvesting structures in kecheri
river basin. Procedia Technology, 24:7–14.
Press Trust of India, I. T. (2016). Only 3 per cent water left
in drought-hit marathwada dams.
Susan K. Jenson, J. O. D. (1988). Extracting topographic
structure from digital elevation data for geographic
information-system analysis. Photogrammetric Engi-
neering and Remote Sensing, 54:1593–1600.
TNN (2018). Maharashtra government declares drought in
8 talukas from three districts - times of india.
Ziadat, F., Bruggeman, A., Oweis, T., Haddad, N.,
Mazahreh, S., Sartawi, W., and Syuof, M. (2012). A
participatory gis approach for assessing land suitabil-
ity for rainwater harvesting in an arid rangeland envi-
ronment.
Optimization of Rainwater Harvesting Sites using GIS
233
