
Sentinel-2 based Remote Evaluation System for a Harvest Monitoring
of Sugarcane Area in the Northeast Thailand Contract Farming
Soravis Supavetch
Department of Civil Engineering, Kasetsart University, Bangkok, Thailand
Keywords: Sentinel-2, Harvest Activity Detection and Remote Sensing for Agricultural Monitoring.
Abstract: Sugarcane is one of five important agricultural crops (Rice, Cassava, Sugarcane, Hevea, and Palm) and its
critical to Thai’s economy. From these important, several decades that government pays attention to
support the industry and help to stabilize the sector, enabling sugarcane mills to maintain their profitability
even during times of depressed sugar prices in the world market. This role of sugarcane supply chain
consists of the growers, millers and associated logistics personnel. Each miller has thousands of
smallholders who grow sugarcane with their contract but the farmer can sign more than one contract each
crop season depending on various factors such as prices and a loaning rate. Highly these competitive need
an efficient monitoring procedure to control their contract in a harvesting peak period. The monitoring of
the farmland requires tracking of them at an individual level that almost impossible for field visits. The
initiated idea of this research is from the study of the European Common Agricultural Policy (CAP) that
plan to use remote sensing data (Control with Remote Sensing: CwRS) for controlling and monitoring
agriculture land in growing season support a subsidy administration in the post-2020 timeframe. From the
aims of the control with remote sensing in CAP and also in this sugarcane industry, the purpose of this study
is checking the claimed parcels in an office in order to reduce the number of field visits. This paper
introduces an approach for that objective which using Sentinel-2 data for a harvest detection. An algorithm
(or a processing chain) in which demonstrated in this paper are an atmospheric correction, vegetation
harvest index processing, data composite (cloud-free and the bare soil inspection), and geostatistical
calculation of farmland for harvesting indicator. The results show an ability of the detection using remote
sensing and the discussion for future improvement are explained in a conclusion.
1 INTRODUCTION
Thailand is the world’s second-biggest sugar exporter
which product 14.3 million tons in 2017. Every year,
sugarcane business activities are involving a farming
and contract management. These contract between
mill and growers which mostly are the smallholders.
At the end of the season (harvest period), mill sends
their employee to monitor for keeping a contract in
which grower should send their products to the
factory with at least following the value that declared.
Over the last few years, Sentinel data become a
key technology in which EU community used to
support the monitoring of agricultural area responding
to the food security policy such as the European
Common Agricultural Policy (CAP). The use of
those satellite data reduces a field visit and shift
operation from sample inspections to large-scale
monitoring (Kanjir et al., 2018) For example, DHI
GRAS has recently completed a pilot study together
with the Danish Agrifish Agency that utilizes Sentinel
data within the field of grass mowing and catch crop
monitoring (European Space Agency). Another
example is the SEN4CAP project that aims to
provide, validated algorithms, products and best
practices for agriculture monitoring relevant for
management of various of CAP measurements on
crop diversity, activity identification, detection of
fallow land, catch crops, land abandonment, and so on
(Devos et al., 2017).
On the same objective of those considering remote
sensing data to support the monitoring of agriculture
activities and environment-related phenomena in
Thailand agriculture industry. This study
demonstrates the utilization of using Sentinel
technology for implementation in the sugarcane
industry Thailand, the details of that implementation
can be explained in the following sections.
234
Supavetch, S.
Sentinel-2 based Remote Evaluation System for a Harvest Monitoring of Sugarcane Area in the Northeast Thailand Contract Farming.
DOI: 10.5220/0007723002340241
In Proceedings of the 5th International Conference on Geographical Information Systems Theory, Applications and Management (GISTAM 2019), pages 234-241
ISBN: 978-989-758-371-1
Copyright
c
2019 by SCITEPRESS – Science and Technology Publications, Lda. All rights reserved
2 OBJECTIVE
The aim of this study is to develop the methodology
in a parcel-based technique for a sugarcane
harvesting activity detection at a farm level of
sugarcane industry’s Thailand using Sentinel-2 data.
3 STUDY AREA
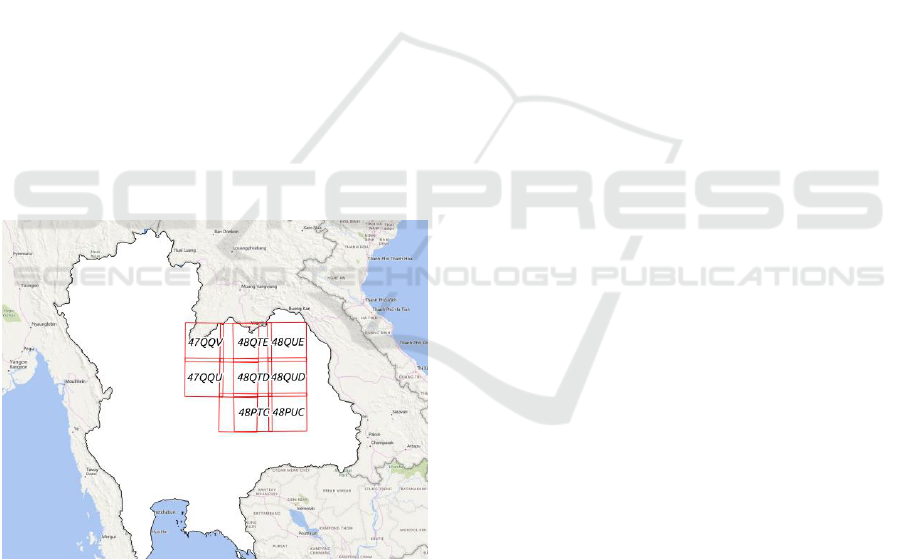
The study area is located in the northeast of Thailand
(Figure 1), where sugarcane is mainly cultivated
under rain-fed conditions. Planting time is at the end
of the rainy season, October-November. The
remaining moisture in the soil supports the
germination of cane and guarantees its survival
through the dry season. The age of sugar cane in
which planted during November-December to the
March-May, will be 4-6 month. Then the coming
rainy season will enable the sugarcane to root deeply
into the soil and grow. The sugarcane will be strong
and can endure dryness when there is a shortage of
rain, which may occur during July-September.
Agriculturists in this region regard planting during
this period more suitable than planting in May,
because it more expense of mowing weeds and it is
easy to find species.
Figure 1: Northeast of Thailand, the study area.
4 SATELLITE DATA
Ministry of Industry controls the period for
crushing sugarcane in 2018 (production year) by
allowing the mills to start crushing at 15th of
November 2018 until the end of May or June.
Thus, Sentinel-2 data during December 2018 were
collected from the Copernicus Open Access
Hub (https://scihub.copernicus.eu/) for these harvest
monitoring process. The plantation area, which is in
a mill’s contract, is used to be a boundary of
sugarcane farm for processing Sentinel-2 data to
determine the cut during the investigation period.
5 ALGORITHM
This study uses Sentinel-2 to detect the harvest
activity at a farm level. Bare soil appearance is a
key for determining that occurs from a cut activity
and various Vegetation Indices (VIs) can be used to
detect those cutting of sugarcane. Index
characteristics which convenient to indicate the cut
(the plant is disappearing) are the ability that can
eliminate another factor out of plant appearance
factor. These external factors are solar and viewing
geometry, soil background, and atmospheric effects
(Rondeaux et al., 1996). Some of these can be
controlled. The spectral reflectance of plant canopy
is obtained with a soil influenced value and
depending on plant density. In the harvest period,
plant density in reflection data between plant and no
plant (bare soil) can be extended by soil contribution
adjustment. Another factor i.e., atmospheric effects
uses SEN2COR, a processing tool, provides
atmospheric, terrain, and cirrus correction of Top-
Of-Atmosphere Level 1C to create Bottom-Of-
Atmosphere Level 2A product from Sentinel-2 data.
Subsequently, L2A product produced another layer
such as a Scene Classification (SC) map, the cloud
mask will be used in a composite process to create
15 days period image (cloud-free) for cutting
detection by using geostatistical of pixels in a land
parcel at the end of the algorithm.
5.1 Scene Classification and
Atmospheric Correction
Scene classification and atmospheric correction are
the processes in SEN2COR, the main output is the
Cloud Screening (shadows, cloud shadows, and
cirrus) (Louis et al., 2016). The classified result
contains 11 classes, only vegetation (no. 4) and bare
soils (no. 5) as demonstrated in Figure 2 are selected
for the processing algorithm in this study which is
used determining a cut activity over the sugarcane
pixels. Clouds, cloud shadows, and cirrus are
masked and not included in an analysis process in
order to avoid an error of the interpretation.
Atmospherically corrected images from
SEN2COR were first evaluated with the sampling
fields. The comparison of pixels over 10 sampling
Sentinel-2 based Remote Evaluation System for a Harvest Monitoring of Sugarcane Area in the Northeast Thailand Contract Farming
235
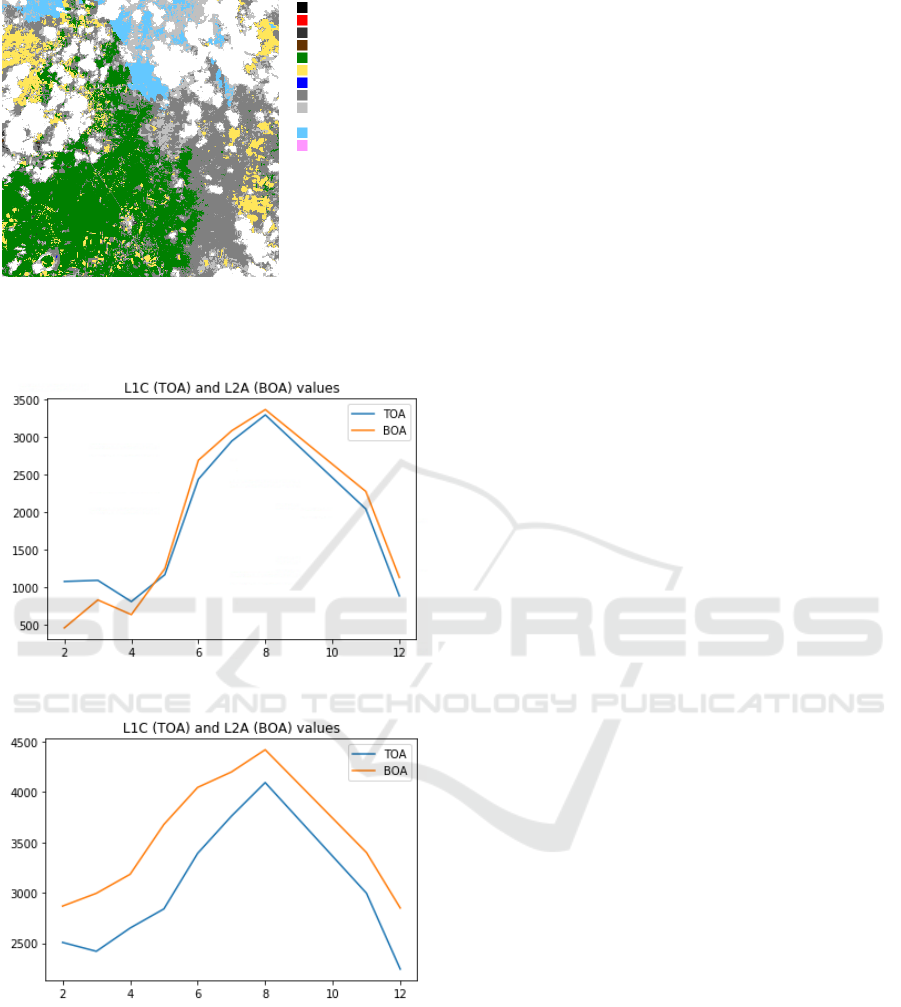
Figure 2: Scene Classification image in which only
vegetation and bare soils are selected for the procedure of
the detection.
(a)
(b)
Figure 3: Illustration of the comparison between the TOA
reflectance and BOA reflectance signature. The example
(a) shows a plot of the sugarcane experimental field, 05
December 2018, (b) shows a plot in a cloudy day over the
vicinity area, 12 December 2018.
on 05 December 2018 shows that the different
radiance typically peaks in the green reflectance and
lower values in the Red Edge, NIR, and SWIR
(Figure 3a). But the comparison on a cloudy day on
15 December 2018 shows the difference radiance
typically more different and quite symmetrically
shape (Figure 3b). Thus, NDVI or SAVI indices from
which TOA or BOA might not significant difference
in term of the ratio of the difference between
calculated bands especially on the harvest activity
detection.
5.2 Soil Adjusted Vegetation Index
(SAVI)
In a theory, SAVI is more reliable than Normalized
Difference Vegetation Index (NDVI) in some
circumstance due to reducing the influence of the
soil spectra in the reflectance. The soil contribution
through the reflectance is depending on plant
density, row effects, canopy geometry, wind effects,
and so on (Rondeaux et al., 1996). Experimental
study reveals that a given type of soil variability, the
(bare) soil reflectance at one wavelength is often
functionally related to reflectance in another
wavelength in linear relation (Jasinski and Eagleson,
1990). Several vegetation indices i.e., soil-adjusted
vegetation index (SAVI), transformed soil-adjusted
vegetation index (TSAVI), modified soil-adjusted
vegetation index (MSAVI), and environment
monitoring index (GEMI) have been developed
using the coefficient of these relationship for
reducing the effect of soil (Huete, 1998). The
selection of index for using depend on the known of
the coefficients of the soil line and that cannot be
generalized because of its variability.
For the detection of a harvest activity, SAVI
which was developed from (Huete, 1998) is selected
for use in this study due to its generalized of the
related coefficient. The study of those canopy
background adjustment factor in Thailand does not
exist thus the recommended factor from Sentinel
Hub (L=0.48) (European Space Agency) is used as
the following equation.
SAVI = (1+L)*(NIR-R) / (NIR+R+L)
(1)
First, the evaluation between SAVI and NDVI
was performed in three different types of covering of
sugarcane i.e., high density (P01), intermediate
density (P03) and low density (cut) (P02). The
following graph (Figure 4) demonstrated that NDVI
is lower reflectance and convinced that the ability of
SAVI is better for detecting the harvest over the land
parcel using the threshold method.
No data
Defective pixel
Dark features
Cloud shadows
Vegetation
Bare soils
Water
Cloud low probability
Cloud medium
probability
Cloud high probability
Thin cirrus
Snow or ice
GISTAM 2019 - 5th International Conference on Geographical Information Systems Theory, Applications and Management
236
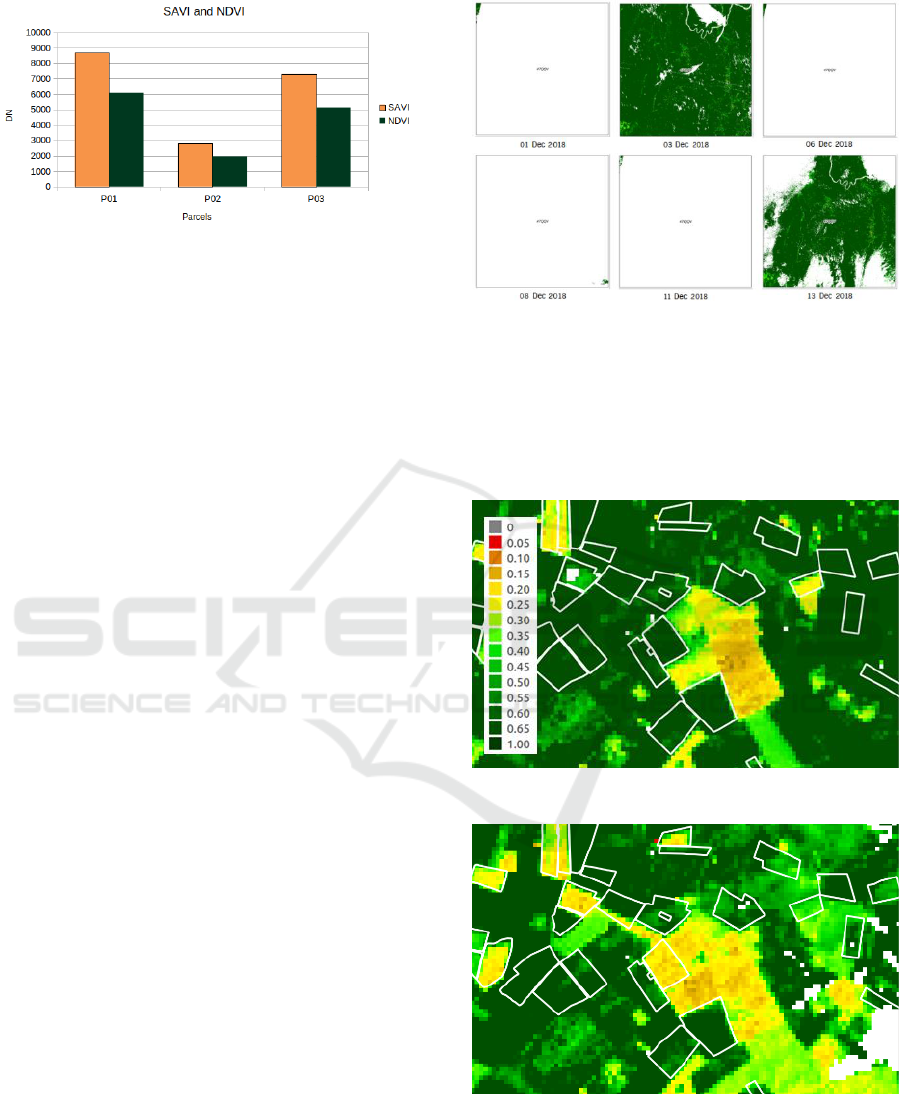
Figure 4: Comparison of SAVI and NDVI over the land
parcel i.e., high density (P01), intermediate density (P03)
and low density (cut) (P02).
5.3 Cloud-free Data Composite
The problems of single date remote sensing
analysis such as cloud contamination, atmospheric
attenuation, surface directional reflectance, and
view and illumination geometry were studied and
proofed that can be reduced by the composite of
multi-dates. For many decades Maximum Value
Composite (MVC) procedure has been
implemented by increasing the number of
acquisitions into a single composite image for
reducing those factors. Since the upcoming of
Sentinel-2 (S2A and S2B), the high spatial
resolution and its revisit frequency of 3 -5 days, the
data can be used to monitoring agriculture at a farm
level. Sentinel-2 for Agriculture Project (Sen2-
Agri) Bontemps et al., (2015) provides the
international community for finding the best
practices to process Sentinel-2 data in an
operational manner into relevant earth observation
(EO) agricultural products and recommended 7 to
10 day basis for cloud-free surface reflectance
composite.
Due to Thailand located in the tropical zone, an
annual average rainfall reports 116 mm based on
1981-2010 period (Thai Meteorological
Department, 2015), the test of data composite
shows a minimum of 15 day is suitable for the
northeast of Thailand to implement the cloud-free
reflectance (Figure 5).
Northeast of Thailand mostly done by the labors
which three parties are involved in relation to
cutting interval, sugar mill owners, cane farmers,
and truck operators. During the peak season,
supply is higher than the capacity of the mills. At
that time hundreds of trucks can be seen queuing in
front of the mills, waiting to unload sugarcane
(Chetthamrongchai, 2001). This condition making
the crushing interval by 4-5 months (December to
April). The composite image of cutting activity is
invert of the traditional composite by using the
Figure 5: The cloud masked image interval 15 days of
S2A and S2B composition of SAVI.
Minimum Value Composite (MinVC) for the cutting
detection. Figure 6 (a)-(e) show the time-related cutting
activity over the farm parcel. In this study, 15 day period
with MinVC is used to produce a pre-processing cloud-
free data for the next step.
(a)
(b)
Figure 6: SAVI images of (a) 03 Dec 2018, (b) 13 Dec
2018, (c) 18 Dec 2018, (d) 23 Dec 2018, and (e) 28 Dec
2018.
Sentinel-2 based Remote Evaluation System for a Harvest Monitoring of Sugarcane Area in the Northeast Thailand Contract Farming
237
(c)
(d)
(e)
Figure 6: SAVI images of (a) 03 Dec 2018, (b) 13 Dec
2018, (c) 18 Dec 2018, (d) 23 Dec 2018, and (e) 28 Dec
2018 (cont.).
5.4 Geostatistical of Parcels
From the farm contract of sugarcane in Thailand, an
area or a parcel of land is known from field
estimation using mobile GNSS. Thus, statistical of
pixels can determine using that GIS information.
The vector polygon is translated into pixels mask for
extracting the SAVI data which locates inside the
parcel.
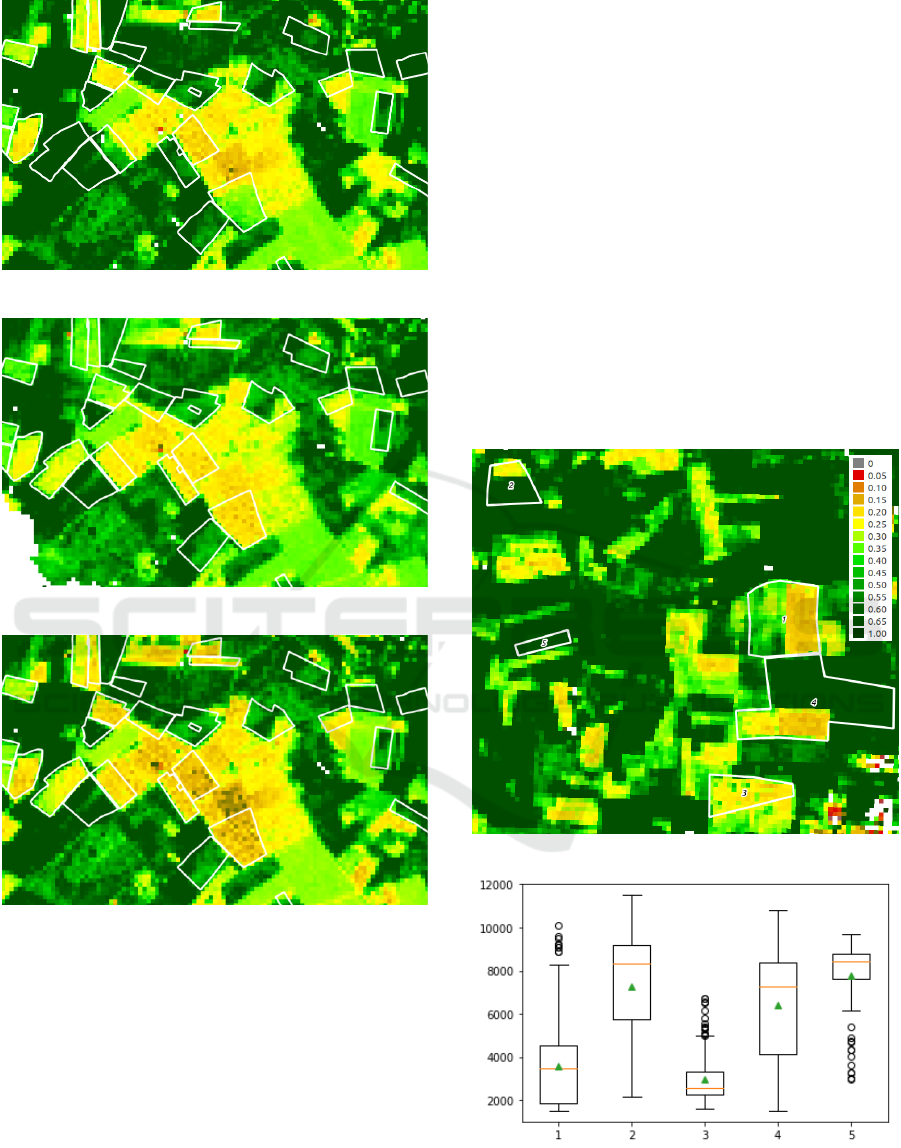
Pixels inside a farm parcel are extracted and
calculated in the term of descriptive statistics, min,
max, mean, median, standard deviation, and
percentile. Figure 7 demonstrates the geostatistical
calculation on the five parcels which have three
types of activities, (T1) “no cut yet”, (T2) “in
progress”, and (T3) “finish”. From the calculation,
mean and median can be used to indicate "in
progress" which close to "finish", but cannot
distinguish the difference between "in progress" and
"no cut yet". The values such as min, max, and
percentile are an indicator which can distinct "no cut
yet" and "in progress". From this inspection, the
cutting in a certain part of a parcel does not make a
significant change on mean and median, but min
value is significantly changed until finish the cutting
the values, max, median, and mean are less than the
threshold value of bare soil (0.4 or 4,000 in this
study).
(a)
(b)
Figure 7: (a) SAVI at 18 Dec 2018 and five farm parcels,
(b) boxplot of the farm parcels.
GISTAM 2019 - 5th International Conference on Geographical Information Systems Theory, Applications and Management
238
5.5 Thresholds for Cutting Activity
The required statuses of the cut activity for the mills'
utilization are "no cut yet", "in progress", and
"finish" as described in the previous section. The
status of each parcel performs in 15 days period by
composited SAVI. The suitable threshold for this
study is as follows.
Table 1: Thresholds of the three types of the cutting
activities.
Status
Min
Mean
Percentile(75)
no cut
yet
> 4000
> 4000
> 5000
in
progress
< 4000
> 3000
> 4000
finish
< 4000
< 4000
< 4000
In Table 1, the statistical key features which are
used to indicate the status “no cut yet” and “finish”,
are Min and Percentile (75). When grower starts
their cutting sugarcane a min value is decreased to
the value less than 3000 until percentile (75)
decreasing to lower 4000, the status then will be
changed to “finish”.
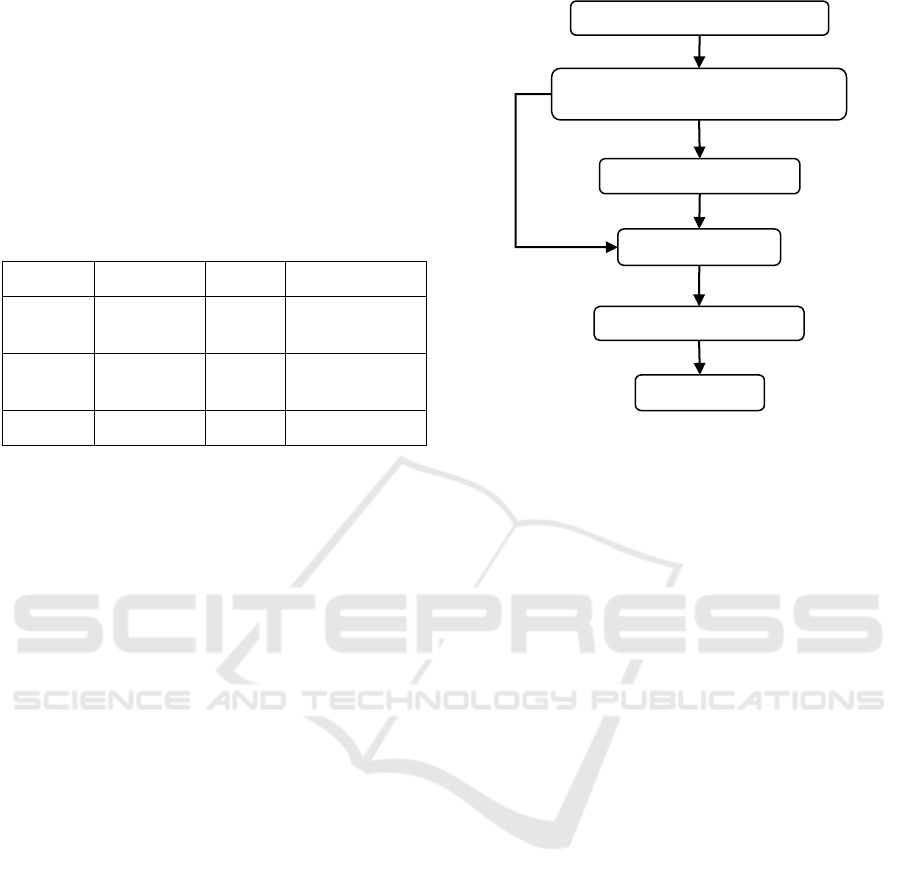
6 PROCESSING SYSTEM
Most agriculture parcels in Thailand are mostly
smallholder farms that area is between 2 – 3 ha and
frequently change their plant type responding to a
unit cost, product price, weather, and the policy of
government subsidy and so on. Cause of this behave
of Thai's agriculture and thus requires the time
related potential technique for observations spread
over time. For supporting this requirement of
agriculture remote sensing, Harvest Monitoring
through Remote Sensing (HMRS) was designed and
developed to aim the investigate the harvest of
sugarcane farmland from analyzing Sentinel-2
dataset, using fully open source or free software,
library, and programming language i.e., custom
Python script, Linux shell scripts, GDAL
(Geospatial Data Abstraction Library), OGR
(OpenGIS Simple Features Reference
Implementation), Numpy, Matplotlib, SEN2COR.
The workflow scripts (Figure 7) are explained as
follows.
Figure 8: Harvest Monitoring through Remote Sensing
(HMRS) workflow.
6.1 Query and Downloads S2 Datasets
Copernicus Open Access Hub provides OData
API for accessing Sentinel datasets over core
protocols i.e., HTTP and REST with an ability to
handle a large set of client tools for performing a
query and retrieving the Sentinel data
(European Space Agency). The python script is
executed every day for querying dataset using
$filter function with a grid name and date in order
to retrieve an observation data as following
example.
https://scihub.copernicus.eu/dhus/odata/v1/
Products?$filter=substringof('T47QQV',Name)
+and+ substringof('_MSIL1C_YYYYMMDD',Name)
6.2 Create Scene Classification and
Atmospheric Correction
SEN2COR toolbox is executed the command
L2A_Process for producing the scene
classification image and performing atmospheric
correction into the 20m resolution image.
From the lack existing of suitable experimented
parameters for Thai regional area for processing
L2A, thus the default parameters are used in this
system as follows.
Query and Downloads S2 Datasets
Create Scene Classification and
Atmospheric Correction
Create Vegetation Index
15 Days Composite
Geostatistical Calculation
Assign Status
L1C
L2A
SAVI
Cloud-free SAVI
Cloud mask
Stat.
Sentinel-2 based Remote Evaluation System for a Harvest Monitoring of Sugarcane Area in the Northeast Thailand Contract Farming
239
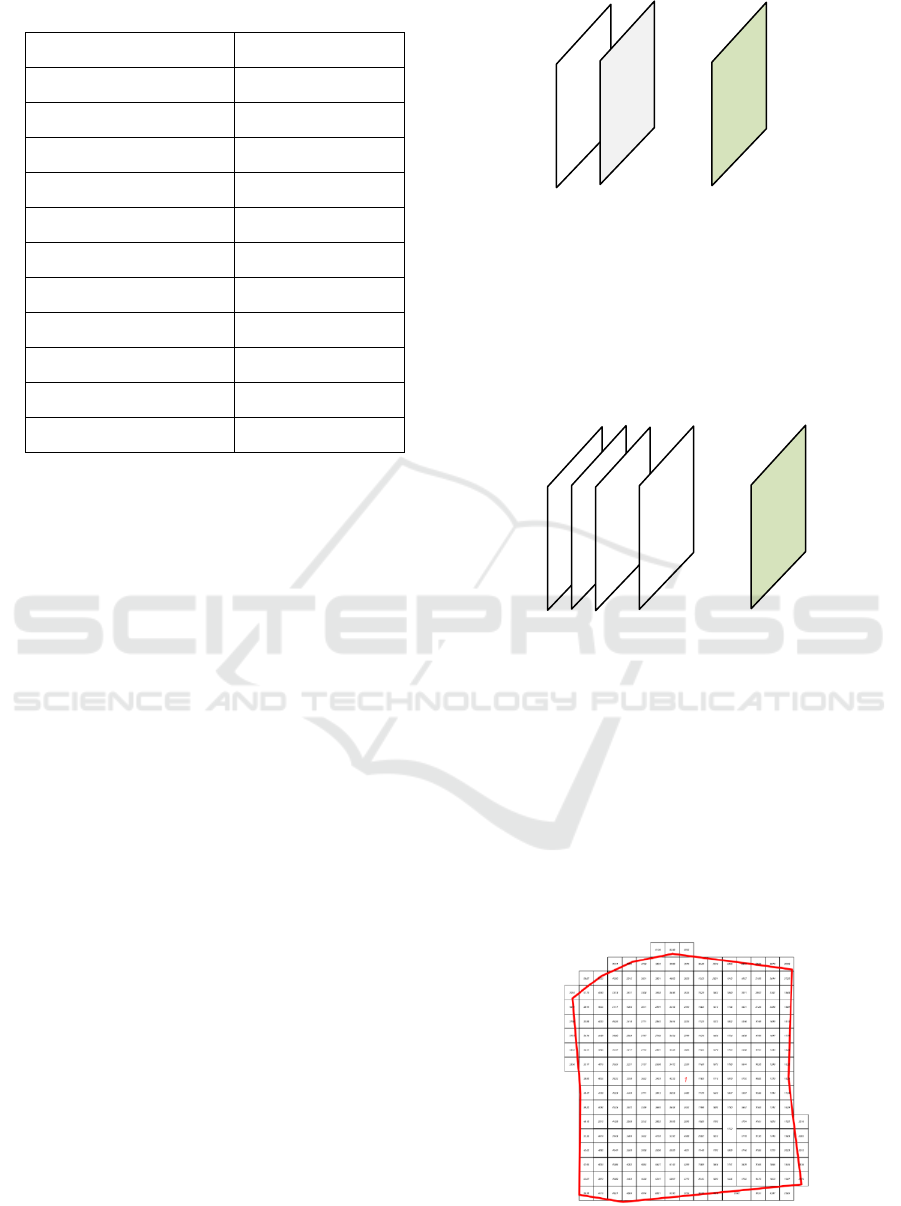
Table 2: L2A_Process parameters.
Processing Parameter
Value
Nr_Process
AUTO
Aerosol_Type
RURAL
Mid_Latitude
SUMMER
Ozone_Content
331
WV_Correction
1
WV_Watermask
1
Cirrus_Correction
TRUE
BRDF_Correction
0
BRDF_Lower_Bound
0.22
Smooth_WV_Map
100
WV_Threshold_Cirrus
0.25
6.3 Create Vegetation Index
A little quite improve here is a conversion of data
type from float SAVI to integer SAVI, in which
putting into the equation for a smaller GeoTiff and
the coordinate reference system is still used UTM
WGS84 as same as the source Sentinel-2.
The naming of SAVI product that should explain
here is the design on the support of manual selection
by the researcher that the name supports the sort in
which area are grouped and date-time can be sorted
ascending or descending. This naming aims to build
and initiate the compact system in order to have an
ability for the improvement in the future for a new
analysis model. The naming is as following
structure.
TZZGGG_YYYYMMDDTHHMMSS_VVVV.tif
ZZ = zone number
GGG = grid characters
YYYY = datatake sensing year
MM = datatake sensing month
DD = datatake sensing date
HH = start hour of sensing
MM = start minute of sensing
SS = start second of sensing
VVVV = index name
In order to build a cloud-free image for the next
composite procedure, Scene Classification (SCL) is
used here as the mask array in order to filter only
vegetation and bare soil pixel by using pixel class
number 4 and 5 respectively.
Figure 9: Filter vetgetation or bare soil from source SAVI.
6.4 15 Days Composite
The 15-day images are investigated in order to select
the minimum SAVI each pixel series for building
the 15 days composite image. If no SAVI found the
pixel is set to no data value.
Figure 10: SAVI composite for harvest detection.
6.5 Geostatistical Calculation
First, OGR is used to read the features from land
parcels of sugarcane then each parcel is selected to
create a raster mask array, thus SAVIs from a
composite image in which the same location of the
mask is extracted from the source into the
calculation procedure as demonstrated in Figure 10.
Numpy, average, mean, median, min, max, and
percentile are the functions which are used to
calculate the geostatistic for the status determination
Figure 11: Pixels masked using farm polygon for
geostatistical calculation.
=
Cloud-free. SAVI
…
SAVI
SCL
=
Comp. SAVI
…
Datetime SAVI (15 days interval)
GISTAM 2019 - 5th International Conference on Geographical Information Systems Theory, Applications and Management
240

6.6 Assign Status
The threshold parameters i.e., min, mean, and
percentile (75) (Table 1) are used to assign a status,
"no cut yet", "in progress", and "finish" in the final
step. Then, status information is sending to the GI
System for utilization in the final step.
7 CONCLUSIONS
This paper presents a proof of concept of using
Sentinel-2 data in the harvest monitoring of
sugarcane fields. SAVI can be used as a cutting
indicator in harvest period of farm plants. In rainfed
agriculture such as Thailand, recommended the
minimum of 15 days composite for cloud-free image
analysis. Geostatistics is a powerful tool for
interpretation in various ways to identify the human
activities which perform on farmland as
demonstrated in this paper.
REFERENCES
European Space Agency, (n.d.). Open Access Hub.
(European Union) Retrieved 1230 2018, from
https://scihub.copernicus.eu/userguide
/ODataAPI
European Space Agency, (n.d.). ESA Sentinels Help
Monitor Grasslands for Agricultural Subsidy Checks
in Europe. Retrieved 12 25, 2018, from
http://www.dhi-gras.com/news/2017/4/7
/successful-demonstration-of-using-sentinel-1-and-2
Thai Meteorological Department, (2015). The Climate of
Thailand.
Rondeaux, G., Steven, M., Baret, F., (1996). Optimization
of Soil-Adjusted Vegetation Indices. Remote Sensing
of Environment, 55(2), 95-107.
Holben, B. N., 2007. Characteristics of maximum-value
composite images from temporal AVHRR data.
International Journal of Remote Sensing, 7(11), 1417-
1434.
Huete, A. R., 1988. A soil-adjusted vegetation index
(SAVI). Remote Sensing of Environment, 25(3), 295-
309.
Louis, J., Debaecker, V., Pflug, B., Main-Knorn, M.,
Bieniarz, J., Mueller-Wilm, U., Cadau, E., Gascon, F.,
2016. SENTINEL-2 SEN2COR: L2A PROCESSOR
FOR USERS. Living Planet Symposium. Prague,
Czech Republic.
Jasinski, M. F., Eagleson, P. S., 1990. Estimation of
Subpixel Vegetation Cover Using Red-Infrared
Scattergrams. IEEE TRANSACTIONS ON
GEOSCIENCE AND REMOTE SENSING, 28(2), 253-
267.
Chetthamrongchai, P., Auansakul, A., Decha Supawan,
D., 2001. assessing the transportation problems of the
sugar cane. Economic and Social Commission for
Asia and the Pacific.
Sentinel Hub. (n.d.). Retrieved 12 30, 2018, from
https://www.sentinel-
hub.com/develop/documentation/eo_products/Sentinel
2EOproducts
Bontemps, S., Arias, M., Cara, C., Dedieu, G., Guzzonato,
E., Hagolle, O., Inglada, J., Matton, N., Morin, D.,
Popescu, R., Rabaute, T., Savinaud, M., Sepulcre, G.,
Valero, S., Ahmad, I., Bégué, A., Wu, B., Abelleyra,
D., Diarra, A., Dupuy, S., French, A., Akhtar, I. H.,
Kussul, N., Levourgeois, V., Page, M. L., Newby, T.,
Savin, I., Verón, S. R., Koetz, B., Defourny, P.,
(2015). Building a Data Set over 12 Globally
Distributed Sites to Support the Development of
Agriculture Monitoring Applications with Sentinel-2.
Remote Sensing, 7, 16062-16090.
Kanjir, U., Đurić, N., Veljanovski, T., 2018. Sentinel-2
Based Temporal Detection of Agricultural Land Use
Anomalies in Support of Common Agricultural Policy
Monitoring. Geo-Information.
Devos, W., Fasbender, D., Lemonine, G., Loudjani, P.,
Milenov, P., Wimhardt, C., 2017. Discussion
document on the introduction of monitoring to
substitute OTSC. European Commission.
Sentinel-2 based Remote Evaluation System for a Harvest Monitoring of Sugarcane Area in the Northeast Thailand Contract Farming
241
