
mHealth Applications: Can User-adaptive Visualization and Context
Affect the Perception of Security and Privacy?
Joana Muchagata, Pedro Vieira-Marques and Ana Ferreira
CINTESIS - Center for Health Technology and Services Research,
Faculty of Medicine, University of Porto, Portugal
Keywords: mHealth Applications, Human Computer Interaction, Security of Mobile Visualization Design, Adaptive
Graphical Visualization Interface (AGVI), Electronic Health Records (EHR).
Abstract: Through mobile applications, patients and health professionals are able to access and monitor health data. But
even with user-adaptive systems, which can adjust interface content according to individual’s needs and
context (e.g., physical location), data privacy can be at risk, as these techniques do not aim to protect them or
even identify the presence of vulnerabilities. The main goal of this paper is to test with end-users the adaptive
visualization techniques, together with the context where they are used, to understand how these may
influence users’ security perception, and decide which techniques can be applied to improve security and
privacy of visualized data. An online survey was applied to test two different use-cases and contexts, where
traditional access and access using visualization techniques are compared in terms of security characteristics.
Preliminary results with 27 participants show that when accessing personal data from a patients’ perspective,
the context has higher influence in the perception of confidentiality (authorized access) and integrity
(authorized modification) of visualized data while for a health professional’s perspective, independently of
the context, the visualization techniques are the ones that seem to primarily influence participants’ choices
for those security characteristics. For availability (data available to authorized users whenever necessary),
both visualization techniques and context have little, or no influence, in the participants’ choice.
1 INTRODUCTION
Mobile devices like smartphones or tablets are very
useful to support user needs on the move (Burigat et
al, 2008). Due to advancement of technologies such
as computing and memory capability, Global
Positioning Systems or intuitive and tactile graphical
user interfaces, the latest generation of smartphones
are progressively viewed as handheld computers
(Boulos et al, 2011). These improvements on
smartphones can increase the power of visualization
to anytime, anywhere (Chittaro, 2006) to most
computing application areas, such as medicine,
engineering and science. Visualization can make a
wide range of mobile applications more intuitive and
productive by highlighting important aspects and
hiding irrelevant details (Lapin, 2014), but finding the
best solutions and techniques is a constant challenge
(Burigat et al, 2008; Chittaro, 2006). There are
various limitations, the most obvious one being the
small screen size.
Visualization is not only a matter of information
type and content. The way people interact with
interfaces can affect information security and privacy.
One very common example is when users access
personal or sensitive data (e.g., home banking or
personal medical records) on public busy places such
as trains, airports or coffee shops. Anyone standing
behind or beside that user can easily eavesdrop some
or all information. Further, if all required and non-
required (unnecessary) data at a specific moment is
travelling via unsecure communication channels such
as public non-secure Wi-Fi hotspots, those can be
more exposed and easily eavesdropped by attackers.
Adaptive visualization techniques are available to
adapt visualization in small screens (Schwartze et al,
2010), however these were not tested in relation to
security and privacy of visualized data.
The main goal of this paper is to test with end-
users if adaptive graphical visualization techniques,
together with the user’s context of usage (type of
device, location, connection and time), can be applied
to improve security and privacy of visualized data. An
444
Muchagata, J., Vieira-Marques, P. and Ferreira, A.
mHealth Applications: Can User-adaptive Visualization and Context Affect the Perception of Security and Privacy?.
DOI: 10.5220/0007724304440451
In Proceedings of the 21st International Conference on Enterprise Information Systems (ICEIS 2019), pages 444-451
ISBN: 978-989-758-372-8
Copyright
c
2019 by SCITEPRESS – Science and Technology Publications, Lda. All rights reser ved

online survey was applied to test two use-cases where
traditional access and access using those adaptive
visualization techniques are compared in terms of
security characteristics. Further, these are also
analysed in two different scenarios.
2 ADAPTIVE GRAPHICAL
VISUALIZATION INTERFACE
(AGVI)
This paper focuses on identifying the importance of a
user-adaptive system where graphical interface and
information visualization can be adapted to support
users showing detailed results for a specific situation
according to their individual needs (Lapin, 2014;
Schwartze et al, 2010; Yelizarov and Gamayunov,
2014). Traditionally, information visualization
systems ignored user’s needs, abilities and
preferences and followed a one-size-fits-all model
(Steichen et al, 2013). Ideally, visualization
techniques must take into account users’
characteristics such as type of device, location, type
of connection, time as well as security aspects.
Usually the mobile screen has limited space, and thus
it is a challenge to identify how much and what
information should be displayed, what the user really
needs to see and find a convenient way to present it.
A significant effort has been made to study different
representations and navigation techniques, especially
for large documents which are used in desktop
systems (Lapin, 2014). A few studies (Burigat et al,
2008; Chittaro, 2006; Lapin, 2014) have shown
techniques to adapt solutions originally designed for
desktop, namely (Muchagata and Ferreira, 2018):
Restructuring of the information space - this
method transforms a multi-column layout into a
one-column layout; in some cases, the
navigation structure may change significantly
and it may be difficult for users to take full
advantage of their experience.
Scrolling and panning techniques - the space is
scrolled horizontally and vertically and also part
of the space is panned out in any direction; the
screen contains part of the information space.
Zooming - effective method to scale the
information space and can be used to get several
perspectives; objects can change size and shape
or they can appear and disappear from the
visualization space when zoomed.
Overview and detail approaches - provides two
simultaneous views, one for context and one for
detail; the context view highlights part of the
displayed space in the detail, with a rectangular
viewfinder.
Focus and context approaches - the best
example of this technique is the fish-eye view
which increases objects of the user’s focal
attention and gradually decreases the size of
more distant objects.
Each of these methods has advantages but at the
same time may be related to security problems. The
three main security characteristics: Confidentiality,
Integrity, Availability (CIA) can be compromised in
some situations.
3 METHODS
In order to demonstrate the application of AGVI, two
use-cases are presented where it is compared two
different situations and analyse how the user and
context characteristics (e.g., physical location) can
influence the way information is visualized and the
level of security in a specific moment. AGVI
techniques are used from the recommendation list
previously synthesized by two of the authors
(Muchagata and Ferreira, 2018). The visual/graphical
interface is adapted to the specific needs,
characteristics and context of the user during
visualization in real-time. In addition to the visual
part, the information content available is also
dependent on the characteristics mentioned above.
The use-cases are based on two fictional mobile
Electronic Health Records (EHR) apps. In Use-Case
A, the user is a patient who needs to visualize health
records at a pharmacy using a mobile device with the
app MyHealth. Use-Case B describes a mobile app
called iMedicine used by a doctor when searching for
her patients’ records (Sub-section 3.1). The authors
conducted an online survey to verify the perception
of security within the presented scenarios (Sub-
section 3.2).
3.1 Use-Cases
3.1.1 Use-Case A
Paulo is a patient and he is at a pharmacy during lunch
time but there is a very long queue. While he is
waiting, he is using his smartphone and trying to sign
in through the app where he has the information about
mHealth Applications: Can User-adaptive Visualization and Context Affect the Perception of Security and Privacy?
445
all his medical records, including medication,
appointments, prescriptions, lab results and allergies.
He needs to see in the system the last prescription
made by his doctor to check for allergies to a specific
medication (Figures 1 and 2) (Muchagata and
Ferreira, 2018).
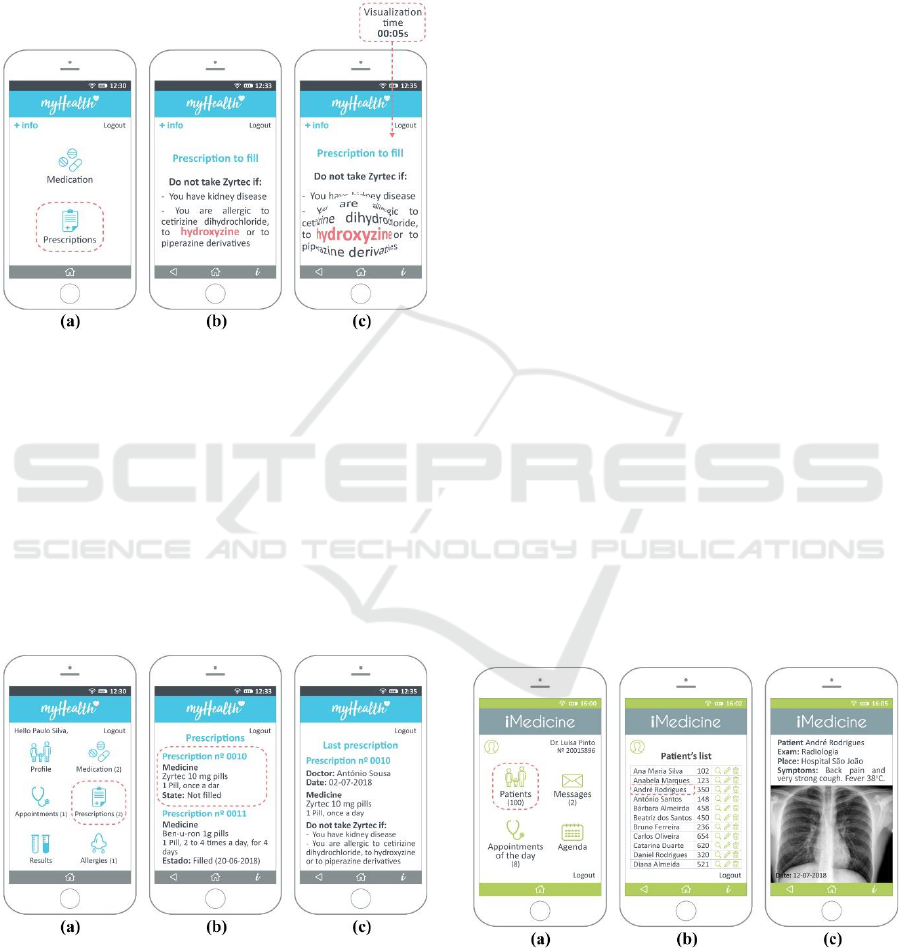
Figure 1: Before using the AGVI, Paulo, the patient, is able
to see everything available about his medical records
without considering all the involved risks.
The mHealth app analyses Paulo’s characteristics:
device (smartphone), location (pharmacy/public
place), connection (public open Wi-Fi) and time
(lunch time). Paulo connects to the pharmacy free Wi-
Fi network so he does not need to authenticate. This
is considered to be a high security risk connection. As
Paulo is in a pharmacy the system only provides the
items related with “Medication” and “Prescriptions”
(Figure 2).
Figure 2: After using the AGVI the app shows information
according with user’s characteristics and needs with
improved visual security.
If for some reason Paulo needs more information
he can access it through the icon on the upper left
corner “+info”. When he chooses the option
“Prescriptions” the system shows him the most recent
one. At this stage, visualization techniques from
Section 2 are applied. The technique Restructuring
of the information space can be used to adjust the
information content to the smartphone’s screen space.
Also, Focus and context approaches, the fish-eye
technique, is available. This is useful if Paulo needs
to see part of the information in more detail. But at
the same time, it can also increase the risk of
“shoulder surfing” and compromise confidentiality.
Thus, when using the fish-eye technique the system
uses a timer for restricting the duration of zooming
moments in contexts of high security risk (in
this case, 5 seconds). Therefore, if the time is limited,
the risk of privacy and security exposure will be
reduced.
3.1.2 Use-case B
Dr. Luísa is a medical doctor at Hospital de São João
in Porto. After her shift she goes to a coffee shop to
meet a friend around 4pm. Already in the place she
receives a call from a co-worker with some doubts
about a patient. Her colleague needs help to confirm
some diagnostic in an x-ray exam. Dr. Luísa has her
smartphone with her so she accesses the app with her
doctor’s credentials. She is using the free Wi-Fi
network from the coffee shop so it is a high security
risk connection. She signs into the app and she
searches for the patient’s exam result. Again, without
the AGVI she is able to see everything: her profile,
her patients, messages, appointments of the day and
her agenda. After choosing the patients’ icon she can
see the list of all her patients and select the patient she
needs to see the exam (Figure 3).
Figure 3: Before using the AGVI Dr. Luísa is able to see
everything about her profile, patient’s information,
messages, appointments and agenda.
On the other hand, with AGVI, the visualization
and related security are different. In this case Dr.
ICEIS 2019 - 21st International Conference on Enterprise Information Systems
446
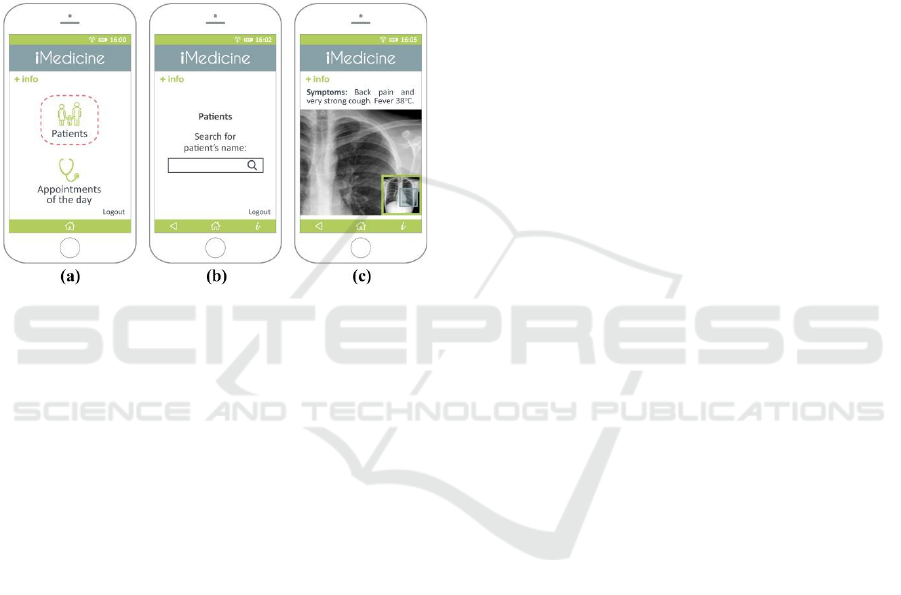
Luísa just sees two menu icons and if she chooses the
“patients” option (for security purposes), she needs to
type the patient’s name. Then it is possible to see the
exam with no other identifiable patient information to
protect their privacy (Figure 4). In this case, a
visualization technique from Section 2 is also applied.
The technique Overview and detail approaches is
used to highlight a specific part of the exam that was
mentioned by her colleague (third image right in
Figure 4). At all times she can access more detailed
information by selecting the “+info” icon (Muchagata
and Ferreira, 2018).
Figure 4: After using the AGVI, the app shows information
according to user’s most common accessed contents (e.g.
patients and appointments of the day), user’s characteristics
and needs, together with improved visual security.
3.2 Exploratory Tests
The type of test most appropriate for this study, at this
stage, is the exploratory test because it is often
conducted as a comparison test by comparing two or
more designs, such as two different interface
scenarios, to see which has the greatest potential with
our target group (Rubin and Chisnell, 2008).
The main goal is to understand and evaluate the
target opinions in terms of the advantages and
disadvantages of different designs regarding the
confidentiality, integrity and availability of
healthcare sensitive data. The authors intend to
analyse which alternative is the favourite one and,
possibly, the factors associated to this choice.
Thus, an online survey was organized through
the LimeSurvey website and due to the nature of
the study the authors selected a convenience sample
more targeted to an academic group. The survey was
made available during the month of August and
beginning of September of 2018. The use-case
images are in English (Sub-section 3.1) but they were
translated to Portuguese because the survey was taken
in Portugal. The online survey was structured into
four parts:
Part 1 - Free and informed consent to
participate in this study
Description of the study and goals, average of
duration time and information about
confidentiality and anonymity.
Part 2 - Demographic data
Year of birth; Gender; Academic skills;
Occupation; Use of smartphones and mobile
applications in healthcare; Privacy and security
in mobile healthcare applications.
Part 3 - Scenarios (Use-case A and B)
Scenario 1 (Use-case A) corresponds to a
patient’s perspective and it is divided in two
parts. Each part is composed by three pairs of
images and each pair comprehends one “before”
using the AGVI and one “after” using the AGVI
(e.g., Figure 1 (a) is paired with Figure 2 (a);
Figure 1 (b) is paired with Figure 2 (b), and so
on). In the first part the identification of the
context is not present and in the second part the
context is identified (e.g., Figure 1 (a) is paired
with Figure 2 (a) and the user is accessing the
app at Home; and Figure 1 (a) is paired with
Figure 2 (a) while the user is accessing the app
at the Pharmacy).
In its turn, scenario 2 (Use-case B) is the
doctor’s perspective and it is very similar to
scenario 1 but with different images’ content
and contexts (home and coffee shop).
The idea in both scenarios is to analyse the
participants’ perspective about which of the two
images guarantees the highest degree of the
three main characteristics of security:
confidentiality, integrity and availability.
Part 4 - Final observations
Space where participants can leave comments
and opinions about the survey’s content.
For the statistical treatment of the data SPSS
Statistics version 24 was used.
mHealth Applications: Can User-adaptive Visualization and Context Affect the Perception of Security and Privacy?
447

4 RESULTS
Our survey was answered by 27 individuals, aged
between 18 and 45 years old, with the majority of
participants (67%) between the age of 18 and 30 years
old and 33% between 31 and 50. The sample
consisted of 11 males and 16 females. The majority
of participants have higher education n=24 (89%) and
in terms of professional occupation they were
organized as follows: students and researchers n =13
(48%), senior technicians n=5 (19%), health
professionals n=5 (19%) and others n=4 (15%). This
last group includes people who are retired,
unemployed, or people who didn’t specify their
occupation.
Due to the generalization of smartphones and the
variety of applications available today, through the
survey the authors tried to analyse how people use
smartphones and mobile applications in healthcare.
Therefore, and according with our results to the
question “How often do you use a smartphone?”, the
majority of participants n=24 (89%) uses a
smartphone on a daily basis; n=9 (33%) revealed that
they never use mHealth apps and just n=1 (4%) uses
those apps several times a day.
The answers related with the question “How often
do you allow the applications you install to access
your contacts, photos, location, and other personal
information?” revealed that most of them allow it to
happen: n=6 (22%) chose the option “Sometimes”,
n=8 (30%) said “Very often” and n=5 (19%) allow
this to “Always” happen. Only a minority of n=3
(11%) said that they never allow this to happen. This
minority was composed by n=2 (7%) males and n=1
(4%) female; n=2 (7%) between 31 and 50 years old
and n=1 (4%) between 18 and 30 years old; n=2 (7%)
senior technicians and n=1 (4%) in the others group.
Regarding the degree of importance given to
privacy and security in mHealth applications, the
following question was presented to our participants:
“In your opinion, how important is privacy and
security in mHealth applications?”. The answerers of
our participants were “Important” with n=2 (7%),
“Very important” with n=13 (48%) and “Extremely
important” with n=12 (44%).
Tables 1 and 2 show the opinion of our
participants related with confidentiality, integrity and
availability. The definitions used for these terms were
as follows:
Confidentiality - The access to information is
exclusively limited to authorized persons and
entities.
Integrity - Information should only be
changed/modified by authorized persons or
entities.
Availability - Information must be accessible to
authorized persons whenever necessary.
Tables 1 & 2 are organized as follows: “Screen”
corresponds to the type of content visualized by the
participants in each pair of images (one without
AGVI – “Figure 1” and the other with AGVI –
“Figure 2”, “Menu” is the application menu;
Sensitive data - technique 1 and 2 correspond to the
visualization techniques applied in each case;
“Context of usage provided” refers to the analysis of
the images in the first place without context “No” and
in second place with context “Yes”; “Figure 1”
represents the figures with all the content available
independently of the user’s characteristics (type of
device, location, connection and time), and “Figure
2” includes the figures with the visualization
techniques applied and so the user can just see what
is relevant at that specific moment.
Regarding Patient Data (Table 1), and beginning
with the analysis of confidentiality, the participants
select “Figure 2” as being the one that ensures a
higher degree of confidentiality. When presenting the
same images accompanied by context (“Figure 1” -
home and “Figure 2” - pharmacy) small differences
could be noticed, however “Figure 2” remains in
participants’ opinion as the one that offers a greater
degree of confidentiality. In terms of integrity, Image
2 is mostly chosen independently from the context,
apart from Figure 2 (a) – Menu, that is less chosen
when the context is present. In the case of availability,
“Image 1” was chosen by all (independently of the
context) as the one that shows more availability of
patient data.
In its turn, and in the doctor’s scenario, Table 2
demonstrates that “Figure 4” guarantees a higher
level of confidentiality when compared with “Figure
3”. Relatively to the integrity of data, most
participants chose “Figure 4”, apart from Figure 4 (a)
– Menu, the most chosen for integrity with context
but less chosen when context is not present.
Regarding data availability, as it happens for the
patient’s perspective scenario, “Figure 1” is always
considered as the one which offers more availability
of patient data.
ICEIS 2019 - 21st International Conference on Enterprise Information Systems
448
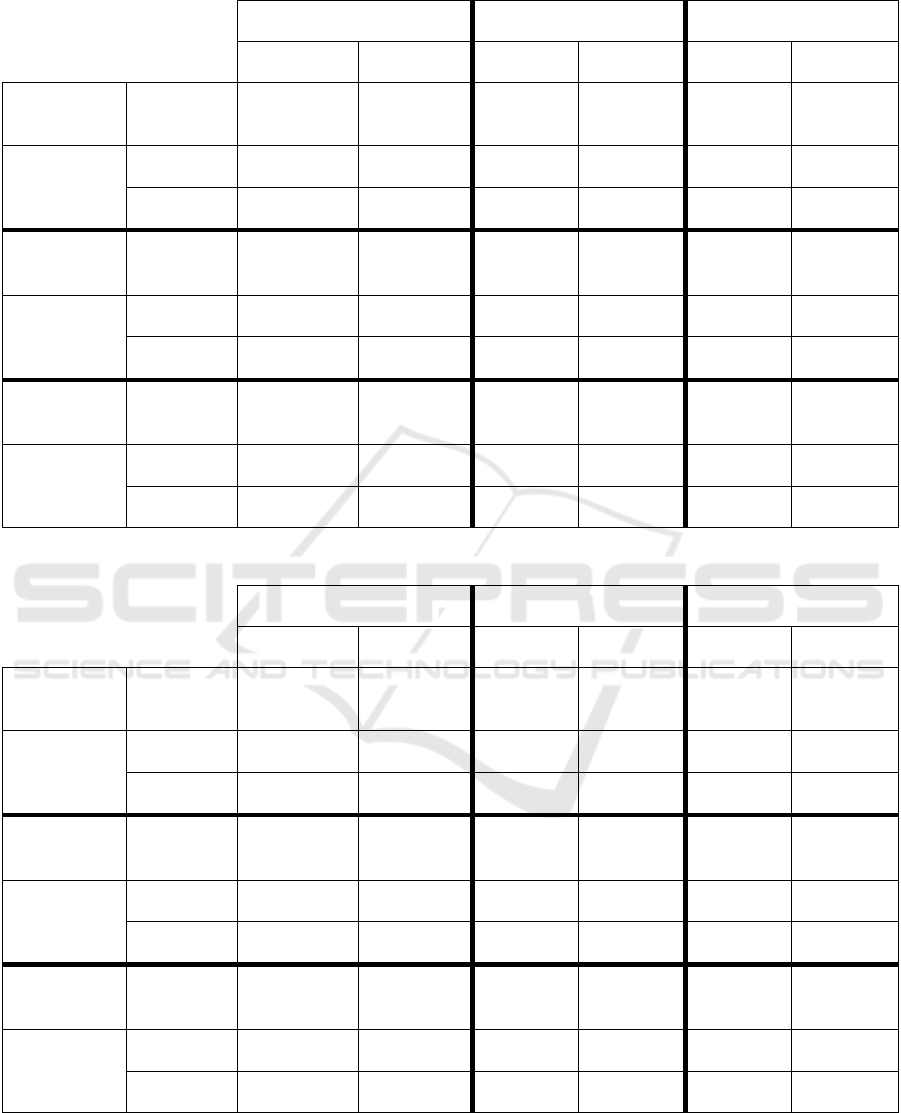
Table 1: Scenario 1 – Patient’s Perspective (confidentiality, integrity and availability).
Confidentiality
Integrity
Availability
Figure 1
Figure 2
Figure 1
Figure 2
Figure 1
Figure 2
Screen
Context of
usage
provided
Fig. 1 (a)
Fig. 2 (a)
Fig. 1 (a)
Fig. 2 (a)
Fig. 1 (a)
Fig. 2 (a)
Menu
No
9 (33%)
18 (67%)
9 (33%)
18 (67%)
24 (89%)
3 (11%)
Yes
6 (22%)
21 (78%)
15 (56%)
12 (44%)
24 (89%)
3 (11%)
Screen
Context of
usage
provided
Fig. 1 (b)
Fig. 2 (b)
Fig. 1 (b)
Fig. 2 (b)
Fig. 1 (b)
Fig. 2 (b)
Sensitive
data
technique 1
No
7 (26%)
20 (74%)
13 (48%)
14 (52%)
22 (82%)
5 (19%)
Yes
10 (37%)
17 (63%)
17 (63%)
10 (37%)
23 (85%)
4 (15%)
Screen
Context of
usage
provided
Fig. 1 (c)
Fig. 2 (c)
Fig. 1 (c)
Fig. 2 (c)
Fig. 1 (c)
Fig. 2 (c)
Sensitive
data
technique 2
No
5 (19%)
22 (82%)
15 (56%)
12 (44%)
23 (85%)
4 (15%)
Yes
9 (33%)
18 (67%)
15 (56%)
12 (44%)
24 (89%)
3 (11%)
Table 2: Scenario 2 – Doctor’s Perspective (confidentiality, integrity and availability).
Confidentiality
Integrity
Availability
Figure 3
Figure 4
Figure 3
Figure 4
Figure 3
Figure 4
Screen
Context of
usage
provided
Fig. 3 (a)
Fig. 4 (a)
Fig. 3 (a)
Fig. 4 (a)
Fig. 3 (a)
Fig. 4 (a)
Menu
No
8 (30%)
19 (70%)
12 (44%)
15 (56%)
22 (82%)
5 (19%)
Yes
13 (48%)
14 (52%)
18 (67%)
9 (33%)
22 (82%)
5 (19%)
Screen
Context of
usage
provided
Fig. 3 (b)
Fig. 4 (b)
Fig. 3 (b)
Fig. 4 (b)
Fig. 3 (b)
Fig. 4 (b)
Sensitive
data
technique 1
No
3 (11%)
24 (89%)
8 (30%)
19 (70%)
15 (56%)
12 (44%)
Yes
3 (11%)
24 (89%)
11 (41%)
16 (60%)
18 (67%)
9 (33%)
Screen
Context of
usage
provided
Fig. 3 (c)
Fig. 4 (c)
Fig. 3 (c)
Fig. 4 (c)
Fig. 3 (c)
Fig. 4 (c)
Sensitive
data
technique 2
No
2 (7%)
25 (93%)
9 (33%)
18 (67%)
21 (78%)
6 (22%)
Yes
5 (19%)
22 (82%)
10 (37%)
17 (63%)
19 (70%)
8 (30%)
mHealth Applications: Can User-adaptive Visualization and Context Affect the Perception of Security and Privacy?
449

5 DISCUSSION
Our study shows the complexity in analysing various
variables connected with human behaviour. The
authors addressed issues such as perception of
security and privacy, adaptable visualization as well
as the context to try to understand the best way to
provide data in mobile applications. Following a
previous work (Muchagata and Ferreira, 2018) where
a set of visualization techniques were analysed in
terms of their potential effect on the confidentiality,
integrity and privacy of mobile data content, this
study advances the state of the art by exploring how
the perceptions of real users are affected depending
on the content and on the adoption of visualization
techniques to present that content to the user.
Regardless if the participants represent doctors or
patients (or even both), the authors considered
relevant and appropriate to know their opinions and
perspectives when they place themselves in both
scenarios.
For the patient’s scenario, and in terms of
confidentiality, every time a particular context is
presented, some participants change their opinion on
what image’s content provides a higher degree of
confidentiality. Commonly in the first image
regarding the menu selection, participants change
their opinion to think that confidentiality is higher
when choosing from a menu when they are at a
pharmacy than when they are at home. Maybe this is
explained by the fact that the type of data they are
accessing relates to health information, which can be
commonly more sensitive. However, when asked the
same question regarding the third image which
includes the results of their search, when the context
is presented, participants change their opinion that
Figure 1 (the one with more personal data content), at
home, is the most secure in terms of confidentiality.
This may be because this information is more related
to the patient’s personal (specific medication) data
and so visualizing this data at home can certainly feel
more secure and trustworthy.
In terms of integrity, for the same patient’s
scenario, answers reveal that there is a big change for
the menu image when there is no context and when
the context is present. Participants favour Figure 2
(the one with less content and visualization
techniques) without the context, but once the context
is presented they change their opinion to favour
Figure 1 (the one with more detailed content and
without visualization techniques) that is viewed at
home. The same happens to the subsequent image
where content is searched. Regarding integrity, the
most chosen secure visualization content is the one
with more detail and viewed at home. What are the
factors that trigger this change? The authors believe
that since integrity is at stake, the more information
and detail available from the searched content, the
better (although this can be confused with
availability) but is not the same for the steps that lead
to search for that data, such as in choosing from
menus. For all options regarding integrity, being at
home is considered safer and more trustworthy than
in a public place.
In terms of availability, participants’ responses
are very consistent and do not change whether context
is present or not. This is also true for the doctor’s
scenario. The visualization content mostly chosen for
availability is Figure 3, which understandably always
comprises the most detailed and complete data, even
though in some cases it could not be considered the
most secure option.
In relation to the doctor’s scenario, there are some
differences in terms of confidentiality. In this case,
there is no variation in the participants’ choice as
Figure 4, the ones with the applied visualization
techniques (and therefore with less and more focused
content), are always chosen. For the doctor’s scenario
the context does not interfere with the perception of
security and privacy unless the content is the menu of
choices (the first image in the sequence), so for all
others it seems that the applied visualization
techniques have, alone, an impact in that choice. For
integrity in this same scenario, there is a similar
change from Figure 4 to Figure 3 for the menu option,
but here, for the other two images, the most chosen
ones in the doctor’s scenario are the ones with
visualization techniques, and not the ones with more
detailed content, as for the patients’ results. There are
just small variations when context is present. Again,
it seems apparent that when a health professional is
accessing confidential data the perception of security
for the surveyed participants is that patient data
should be more controlled and contained than when it
is a patient accessing that data, even if that access is
performed at a public place, such as a coffee shop.
Here the context “home” is not the one providing a
higher sense of trust and integrity, visualization
techniques seem to override that.
Limitations. Despite encountering a few examples of
the use of adaptive visualization techniques in mobile
applications, the authors could not find a clear and
detailed methodology and procedures that could help
with their implementation in practice, especially
within the fields of security and privacy. Also, this
study had time and management constraints with the
application of the online questionnaire within the
ICEIS 2019 - 21st International Conference on Enterprise Information Systems
450

holiday period, the month of August and beginning of
September, and the change of questionnaires
appliance in relation to the new European legislation
regarding personal data, which is for the moment
halted by the University management. Therefore, the
authors had a small turnover of responses and a small
sample to analyse and were not able to adequately
compare results with demographic variables.
Also, for the analysis of the doctor’s perspective, only
a small part of the participants were health
professionals (n=5 – 19%). As such, it can be harder
for a non-health professional to evaluate how a
certain system and related sensitive data content must
or not be protected.
However, these constitute preliminary results that can
be further detailed with a wider application of the
same questionnaire, as it is ready for use, as soon as
management constraints are lifted. The authors
believe that these are important first steps in
understanding the subject at hand. For being small,
the sample is not varied in participants’ background
or age but balanced in terms of gender.
6 CONCLUSIONS
This study provides a first overview on the influence
that context and adaptive visualization techniques can
have on the users’ perception regarding security and
privacy of mHealth applications. Due to the
complexity of human behaviour and human computer
interactions, more focus on this line of research is
needed.
The authors conclude that both context and
adaptive visualization techniques can influence
mHealth users’ perspectives on security and privacy
but add also that, consequently, the roles (e.g., patient
or health professional) and goals (e.g., searching for
a medication or a patient and analyse exams) used to
interact with the applications can also come into play
and add to the complexity and relevance of this
subject.
With this in mind, a more complete/detailed
analysis and with a wider and more diverse sample
needs to be performed to better understand the factors
and requirements to design more secure and privacy
compliant mHealth applications.
ACKNOWLEDGEMENTS
This article was supported by FCT through the
Project TagUBig - Taming Your Big Data
(IF/00693/2015) from Researcher FCT Program
funded by National Funds through FCT - Fundação
para a Ciência e a Tecnologia.
REFERENCES
Boulos, M. N. K., Wheeler, S., Tavares, C. and Jones, R.
(2011) How smartphones are changing the face of
mobile and participatory healthcare: an overview, with
example from eCAALYX. BioMedical Engineering
OnLine, 10, 24-24.
Burigat, S., Chittaro, L. and Gabrielli, S. (2008) Navigation
techniques for small-screen devices: An evaluation on
maps and web pages. International Journal of Human-
Computer Studies, 66(2), 78-97.
Chittaro, L. (2006) Visualizing information on mobile
devices. Computer, 39(3), 40-45.
Lapin, K. (2014) Visualization Approaches for Mobile
Devices, In Proceedings of the 11th International
Baltic Conference. Baltic: Databases and information
systems.
Muchagata, J. and Ferreira, A. (2018) How Can
Visualization Affect Security?, ICEIS 2018 - 20th
International Conference on Enterprise Information
Systems. Poster Presentation in Funchal, Madeira -
Portugal: SCITEPRESS Digital Library.
Rubin, J. and Chisnell, D. (2008) Handbook of Usability
Testing: How to Plan, Design, and Conduct Effective
Tests, 2 edition. Wiley Publishing, Inc.
Schwartze, V., Blumendorf, M. and Albayrak, S. (2010)
Adjustable context adaptations for user interfaces at
runtime, Proceedings of the International Conference
on Advanced Visual Interfaces. Roma, Italy, 1843051:
ACM, 321-324.
Steichen, B., Carenini, G. and Conati, C. (2013) User-
adaptive information visualization: using eye gaze data
to infer visualization tasks and user cognitive abilities,
Proceedings of the 2013 international conference on
Intelligent user interfaces. Santa Monica, California,
USA, 2449439: ACM, 317-328.
Yelizarov, A. and Gamayunov, D. (2014) Adaptive
Visualization Interface That Manages User's Cognitive
Load Based on Interaction Characteristics, Proceedings
of the 7th International Symposium on Visual
Information Communication and Interaction. Sydney
NSW, Australia, 2636844: ACM, 1-8.
mHealth Applications: Can User-adaptive Visualization and Context Affect the Perception of Security and Privacy?
451
