
Driver Cell Phone Usage Violation Detection using License Plate
Recognition Camera Images
Bensu Alkan, Burak Balci,
Alperen Elihos and Yusuf Artan
Video Analysis Group, Havelsan Incorporation. Ankara, Turkey
{balkan, bbalci, aelihos, yartan}@ havelsan.com.tr
Keywords: Cell Phone Usage Detection, Convolutional Neural Network (CNN), Deep Learning, Object Detection,
Traffic Enforcement, Intelligent Transportation Systems (ITS).
Abstract: The increased use of digital video and image processing technology has paved the way for extending the
traffic enforcement applications to a wider range of violations as well as making the enforcement process
more efficient. Automated traffic enforcement has mainly been applied towards speed and red light violations
detection. In recent years, there has been an extension to other violation detection tasks such as seat-belt usage,
tailgating and toll payment violations. In the recent years, automated driver cell phone usage violation
detection methods have aroused considerable interest since it results in higher mortality rates than the
intoxicated driving. In this study, we propose a novel automated technique towards driver’s phone usage
violation detection using deep learning algorithms. Using an existing license plate recognition camera system
placed on an overhead gantry, installed on a highway, real world images are captured during day and night
time. We performed experiments using more than 5900 real world images and achieved an overall accuracy
of 90.8 % in the driver cell phone usage violation detection task.
1 INTRODUCTION
Modern cities stand on the edge of a transformational
change that is driven by the technological innovation.
Smart city technologies are revolutionizing the way
we live, see and think the cities we live in. Thanks to
the proliferation of sensors placed around the city,
cities continuously collect data to monitor security
and welfare of its citizens. Law enforcement agencies
may also benefit from data streaming from these
sensors. In the recent years, many companies have
proposed smart law enforcement solutions using
machine learning techniques towards traffic
enforcement, predictive policing and crime
prevention (IBM report, 2012).
Traffic enforcement on highways and roads is
typically performed manually by a road-side police
officer. However, this process is known to be
laborious and ineffective due to the lack of sufficient
personnel to perform the inspection. Therefore, there
has been a need to develop automated systems that
would assist police officers in the enforcement
process. Camera based enforcement systems on
roadways have been gaining popularity. Using the
existing license plate recognition cameras that are
installed for smart city purposes, we propose a driver
cell phone usage enforcement method using deep
learning algorithms.
Although mobile phone usage while driving is
prohibited in many countries, roadside surveys
indicate that around 1% to 11% of drivers use phone
while driving (ERSO report, 2015). In a recent study,
the World Health Organization (WHO) reports that
distracted driving (e.g. driver cell phone usage)
results in higher mortality rates than that of
intoxicated driving (WHO2017). Therefore, traffic
safety agencies highly desire an automated cell phone
usage violation detection system. Roadway
surveillance camera images may offer an inexpensive
and efficient solution to this problem (Artan et al.,
2014; Berri et al., 2014; Seshadri et al., 2015; Le at
al., 2016; Elings 2018).
Many studies in the past have proposed image
based solutions towards traffic enforcement purposes.
Most of these earlier studies present solutions towards
seat belt detection, red-light violation detection,
autonomous driving etc. to name a few (Zhou et al.,
2017; Bojarski et al., 2016). In this study, we propose
driver cell phone usage violation detection using
license plate recognition camera images. Proposed
method utilizes deep learning based object detection
method in the subtasks of the cell phone violation
468
Alkan, B., Balci, B., Elihos, A. and Artan, Y.
Driver Cell Phone Usage Violation Detection using License Plate Recognition Camera Images.
DOI: 10.5220/0007725804680474
In Proceedings of the 5th International Conference on Vehicle Technology and Intelligent Transport Systems (VEHITS 2019), pages 468-474
ISBN: 978-989-758-374-2
Copyright
c
2019 by SCITEPRESS – Science and Technology Publications, Lda. All rights reserved
detection process; windshield region detection, driver
detection and phone usage detection.
In the next section, we discuss previous works for
our task. Section 3 presents the details of our
methodology. Then, we report our experiments and
results using real world images. Final section presents
our conclusion.
2 RELATED WORKS
In this section, we review the previous studies that
proposed solutions to detect cell phone usage while
driving. These studies utilized machine learning and
deep learning based methods in their analysis as
shown in Table 1. Artan et al., (2014) captured near
infrared (NIR) images by a highway transportation
imaging system for detecting cell phone usage by
drivers. Once the NIR images are acquired, they
detect windshield of the vehicle and apply DPM base
face detector within localized windshield region.
Upon the detection of drivers’ face, 3 locally
aggregated descriptors BoW, VLAD and FV are used
in image classification tasks. Berri et al., (2014)
proposed an algorithm that can detect the use of cell
phones by using the frontal camera mounted on the da
shboard of a vehicle. They used machine learning
based SVM classifier for classification stages.
Seshadri et al., (2015) detect faces to check the
presence of hands and cell phones. Challenging
Strategic Highway Research Program (SHRP-2,
2006-2015) face view videos are utilized for a study
of driving behaviour. Their approach is to first detect
the drivers’ face using Supervised Descent Method of
(Xiong et al., 2013) and extract the left side and right
side of the face region. Next, feature extraction
techniques applied on these left/right side images, and
these features are classified using Real Adaboost
(Schapire et al., 1999) and SVM (Cortes et al., 1995)
to detect cell phone usage.
In recent years, deep learning algorithms have
shown to be the most effective method producing
state-of-the-art results on many challenging
application areas such as object detection, image
recognition, speech processing (Zhou et al., 2017;
Bojarski et al., 2016; Liu et al., 2016; Redmon et al.,
2016; Ren et al., 2015; Huang et al., 2017). Le et al.,
(2016) present a deep learning based Multiple Scale
Faster R-CNN approach to solve the problems of
driver distraction monitoring and highway safety,
namely, the hand on the wheel detection and the cell-
phone usage detection. They used Vision for
Intelligent Vehicles and Applications (VIVA) Hand
Database (Das et al., 2015) and SHRP-2 dataset.
Results of this study show that it performs only very
slightly better than regular Faster R-CNN (Ren et al.,
2015). Elings, (2018) proposed a straightforward
convolutional neural network approach and a various
combination of phone, hand and face detection and
hand classification were compared. It must be noted
that each study utilized different training and testing
data, so comparison of this studies may be
misleading.
Table 1: Overview of the previous works.
Authors
Algorith
m
Detected
Objects
Placed
Artan et al.
(2014)
Machine
Learning
Windshield,
Face
Overhead
Gantry on
Highways
Berri et al.
(2014)
Machine
Learning
Face
Inside of
the Vehicle
Seshadri et
al. (2015)
Machine
Learning
Face
Inside of
the Vehicle
Le at al.
(2016)
Deep
Learning
Face, hand,
steering
wheel
Inside of
the Vehicle
Elings
(2018)
Deep
Learning
Face, Phone
Pose, hand
Mounted
above the
highway
3 METHODOLOGY
In this section, we describe the details of the proposed
solution for driver’s cell-phone usage violation
detection task. Proposed solution consists of 3-stages;
windshield detection, driver region localization and
phone usage violation detection. Steps of the
proposed cell phone usage detection method is shown
in Figure 1.
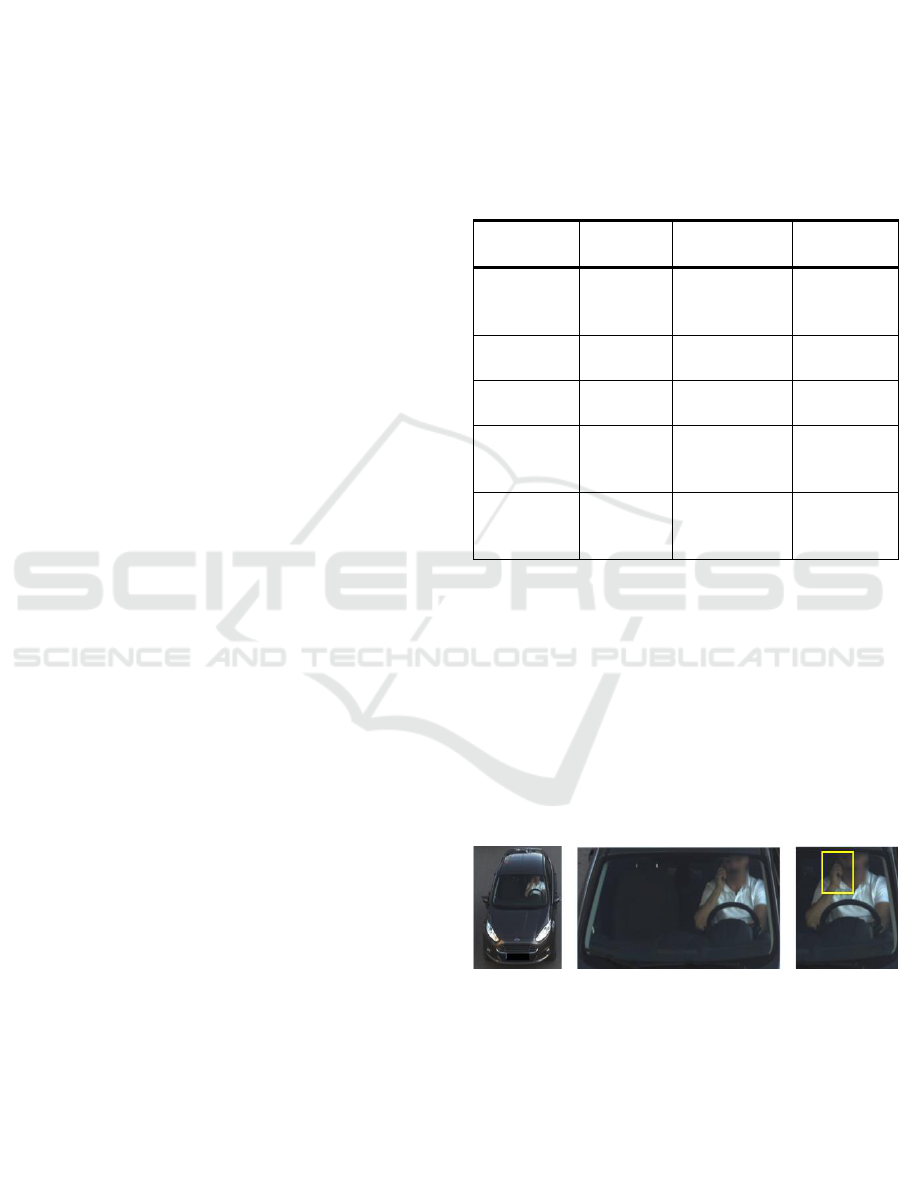
Figure 1: Steps of the proposed method. Left, middle and
right column show License Plate Recognition Camera
vehicle image, detected windshield region and detected
driver region, respectively. Yellow rectangle shows the
presence of cell phone usage within the driver region.
In this study, for object detection tasks, we utilize
a popular deep learning based object detection
technique, Single Shot Multi Box Detector (SSD)
(Liu et al. 2016). General architecture of the SSD
model can be seen in Figure 2. In terms of object
Driver Cell Phone Usage Violation Detection using License Plate Recognition Camera Images
469
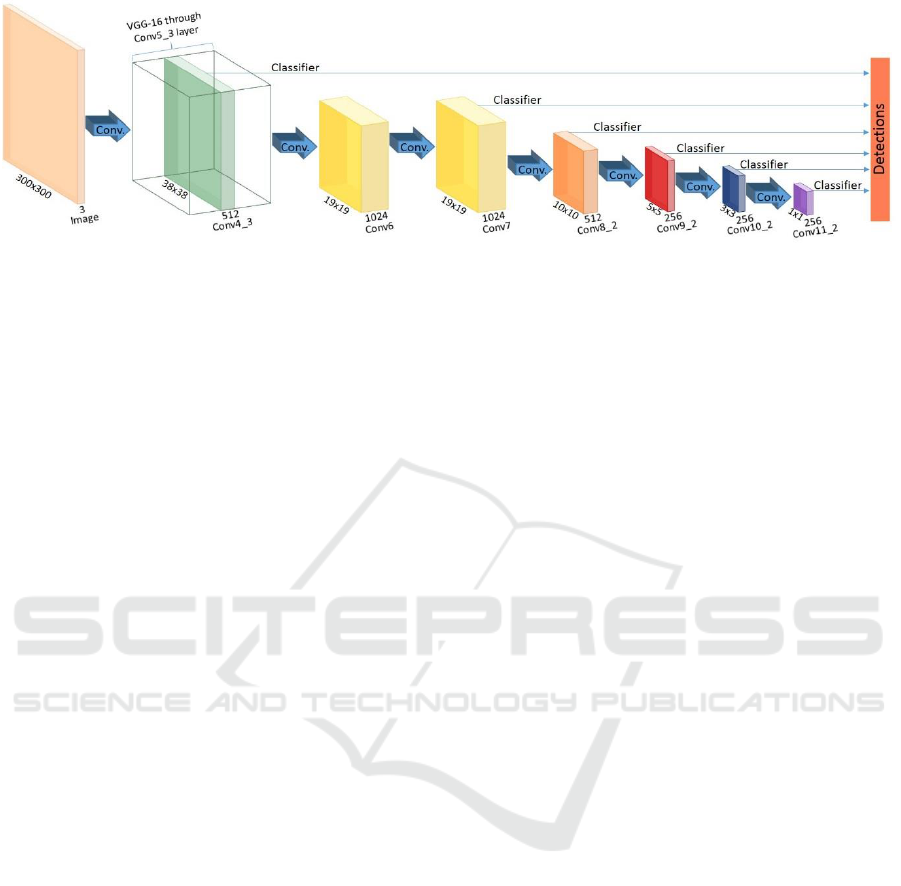
Figure 2: General architecture of SSD model (Liu et al., 2016).
detection tasks, SSD model is shown to perform
better than alternatives (You Only Look Once
(YOLO) (Redmon et al., 2016) and Faster R-CNN
(Ren et al., 2015)) in terms of speed and accuracy
(Huang et al., 2017).
3.1 Cell-Phone Usage Detection Stages
3.1.1 Windshield Region Detection
The first step in the violation detection task is the
detection of the windshield region within the captured
image. Windshield region constitutes the main region
of interest (ROI) in phone usage detection task.
Remaining part of the image is simply ignored since
it is irrelevant for our objective. To construct
windshield detector model, we fine-tuned a pre-
trained SSD model using windshield region annotated
training dataset. Afterwards, localized windshield
region image is provided to driver and phone usage
detection stages.
3.1.2 Driver Region Localization
Upon the completion of windshield detection, driver
detection operation is performed within the detected
windshield region. Driver detection is necessary since
the image may contain undesired reflection effects
due to environmental conditions. Driver detection
allows us to eliminate the unnecessary violation
detections in the images of windshield regions
containing excessive amount of reflection. For driver
detection model, we again fine-tuned a pre-trained
SSD model using driver region annotated windshield
images. At the end of this stage, localized driver
region is given as input into the cell phone usage
detection stage.
3.1.3 Cell Phone Usage Detection
Upon the completion of driver detection as described
in earlier steps, we perform phone usage analysis on
this localized driver region. Similar to windshield and
driver detector models, we create another SSD model
to capture the cell phone usage behaviour of driver.
In our experiments, we compare the performance of
proposed SSD object detection method with a
convolutional neural network (CNN) and Fisher
Vector (FV) based image classification methods for
cell phone usage violation detection task as explained
below.
3.2 Architecture of Proposed Methods
In this study, we utilized either an NIR image or RGB
image in the decision making process. Instead of
creating separate models for two types of image
source, we convert single channel NIR images to 3
channel NIR images by cloning them channel-wise
and generate a single model using NIR and RGB
images together. Below, we explain training
procedures and hyper parameter selections used in the
training process.
3.2.1 SSD Model
In this approach, SSD object detector is utilized to
detect the presence of a phone usage within the input
image. To this end, we trained SSD model to detect
phone usage violation in detected driver region.
During the windshield, driver and phone usage
detection training process, we utilized transfer
learning approach to make the training process more
efficient. We utilize a base SSD model presented in
(Liu et al., 2016). Using this base model, we fine-
tuned it with our specific dataset. Fine tuning
operation is performed by freezing the weights of the
first three convolutional blocks of the base model.
The rationale behind this strategy is based on two
VEHITS 2019 - 5th International Conference on Vehicle Technology and Intelligent Transport Systems
470

Figure 3: General architecture of CNN-P model.
facts. First three convolutional blocks trained with a
large dataset (ImageNet-1k dataset (Deng et al.,
2009)) behave as a feature extractor. Thus, there is no
need to update these weights with our relatively small
dataset. Secondly, since the first feature map to be
analysed to detect objects fall into 4
th
convolutional
block, it is logical to update weights starting from
there. In our fine tuning operations, we set the batch
size as 16. As learning hyper parameters, Adam
optimizer (Kingma et al. 2014) with a relatively small
learning rate 0.0003 is utilized. Also we applied
learning rate decay strategy shown in Eq. 1 where
is the learning rate, is the epoch number.
(1)
Using validation set, confidence threshold to accept
detections as valid in windshield detection is
determined as 0.95. Best performance is achieved
with the confidence threshold of 0.8 in the driver
detection and phone usage detection cases.
3.2.2 Convolutional Neural Network (CNN)
Models
Very deep CNN models have achieved state-of-the-
art performance in image classification tasks
(Simonyan et al., 2014). In this study, we propose
CNN based image classification. Proposed CNN
architecture (CNN-P) is shown in Figure 3. In this
architecture, the filter size of convolution layer 1 is
chosen to be the same size as width of the phone
usage within the image. Convolutional block of the
model transforms input image to a 9x9x128 feature
map. Then fully connected block works as a classifier
to produce decision using feature map. All
convolution and fully connected layers include
rectified linear unit as an activation function. Cross
entropy is used as loss function to train this model.
Since it is a small CNN model, we trained the
model from scratch utilizing our dataset. Stochastic
gradient descent (SGD) optimizer with learning rate
0.01 is utilized during the training. In order to avoid
overfitting, the training was finished after 66
th
epoch.
3.2.3 Fisher Vector (FV) Model
Image vector representation using d-dimensional
local image descriptors ubiquitously used in image
classification studies. Suppose X
denote the set of local descriptors extracted from a
given image. We assume that the generation process
of the local descriptors can be modelled by a
probabilistic model
, where denotes the
parameters of the function. (Perronnin et al., 2010)
proposed to describe X by the gradient vector;
(2)
In which the gradient of the log likelihood
describes the contribution of the parameter to the
generation process. A natural kernel on these gradient
vectors is fisher kernel (Perronnin et al., 2010),
(3)
where
denotes the Fisher Information Matrix of
. It is symmetric and positive definite, it also
has a Cholesky decomposition
,
therefore, the kernel K(X,Y) can be written as a dot
product between normalized vectors shown in Eq. 4,
(4)
where
is referred to as fisher vector of X. Fisher
vector extends the BoW by encoding first and
second-order statistics. This description vector is the
gradient of the samples likelihood with respect to the
parameters of this distribution, scaled by the inverse
square root of the Fisher Information Matrix. As a
result, it gives a direction in parameter space into
which the learned distribution should be modified to
better fit the observed data. Therefore, FV describes
the deviation of local descriptors from an average of
descriptors that are modelled parametrically. In this
study, FV is used as a method to capture the
information conveyed by a set of descriptors into a
fixed length representation.
In our experiments, we used Gaussian mixture
models (GMM) with K = {32, 64, 128, 256, 512}
Gaussians to compute fisher vectors. The GMMs are
trained using the maximum likelihood (ML) criterion
Driver Cell Phone Usage Violation Detection using License Plate Recognition Camera Images
471
and expectation maximization algorithm (EM).
Similar to (Perronnin et al., 2010), we apply power
and L
2
normalization to fisher vectors to improve
classification performance. In our experiments, we
report results only for K = 256 since it achieved the
best performance. For local image descriptors, we
extract features from 32x32 pixel patches on regular
grids at 3 scales. We only extract 128-D Scale-
Invariant Feature Transform (SIFT) feature
descriptors for these patches.
4 EXPERIMENTS
4.1 Image Acquisition
In this study, a 3MP (2048x1536) NIR and a 3MP
(2048x1536) RGB camera pair with the same field of
view (FOV) are placed on an overhead gantry
approximately 4.5 m above the ground level. Video
based triggering is used during the image acquisition.
Figure 4 illustrates a camera directed at the
windshield of the vehicle.
Figure 4: Visual illustration of image acquisition system.
4.2 Datasets
In the training process of the windshield, driver and
phone usage detection stages, we utilized 768
(NIR+RGB) images to train models and 192 images
were used for validation. Training dataset includes
NIR and RGB images to be able to utilize models over
both type of images. We have partitioned our training
set into 3 classes; positive (violation), negative (no-
violation) and hard negative which is shown in Figure
5.
For testing purpose, 2264 RGB images (2173
negative, 49 positive, 42 hard negative) and 3717 NIR
images (3519 negative, 113 positive, 85 hard
negative) were collected from various hours of a day.
Positive and hard negative test images are relatively
small from negative test images because of the
difficulty in collecting data as a result of low
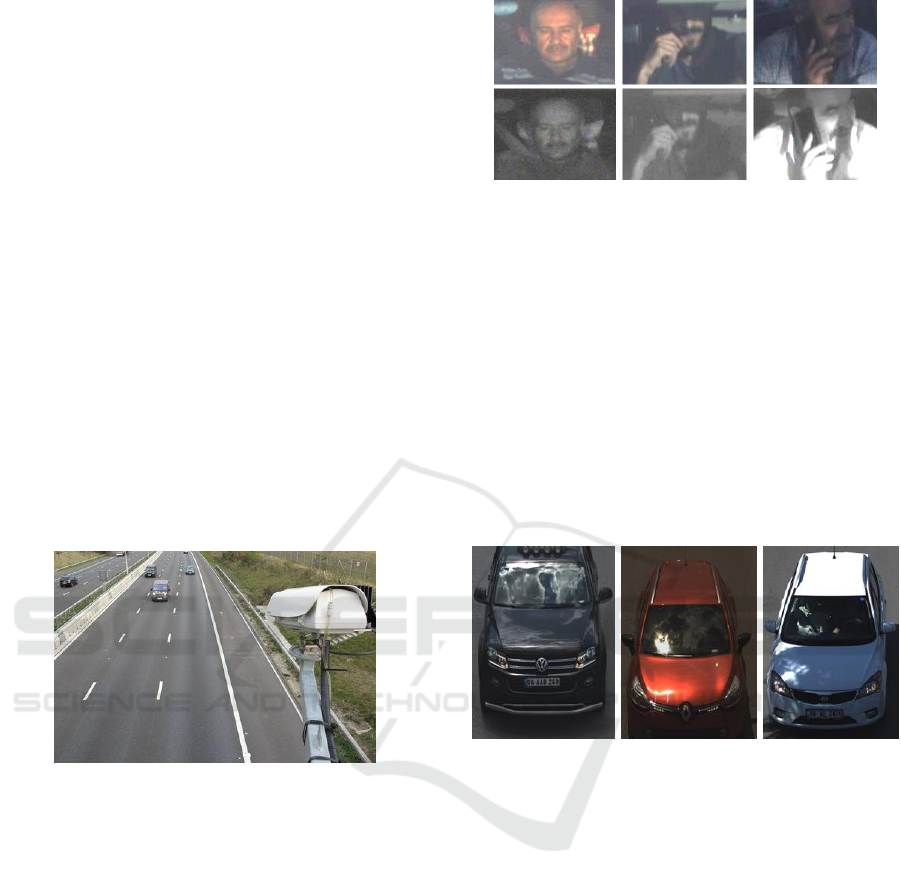
Figure 5: First, second and third column represent negative,
hard negative and positive images, respectively. First row
shows RGB sample images, second raw illustrates NIR
sample images.
probability of encountering phone usage. The dataset
has been put together carefully in order to emulate
real life conditions. Images were collected from the
summer days, excluding the hours between 12:00 and
15:00 o’clock. On NIR and RGB images taken from
this interval, inside of windshield cannot be seen due
to excessive amount of reflection. Therefore, data
from these hours are not included in test set. Figure 6
shows some of the challenging cases in which
windshield detection or driver detection fails.
Figure 6: Samples of excessive amount of reflection on the
windshield of vehicles.
4.3 Test Results
In our analysis, first, we would like to present the
performance of the windshield detection and driver
detection subtasks using test images. Detector output
is considered as correct if its overlap with ground
truth is greater than 80 %. On the test set, SSD
detector achieves an accuracy of 99.5 % for
windshield detection task. Once the windshield
region is detected, the driver detector is applied to
detect driver on the front seat. On the same test
dataset, overall accuracy is measured as 99.3 %. Note
that, 0.7 % loss does not only depend on the
performance of the driver detector. It also depends on
the performance of the windshield detector. These
undetected windshield images causes additional loss
to the driver detector, therefore performance of
windshield detector affects the performance of driver
detection.
VEHITS 2019 - 5th International Conference on Vehicle Technology and Intelligent Transport Systems
472
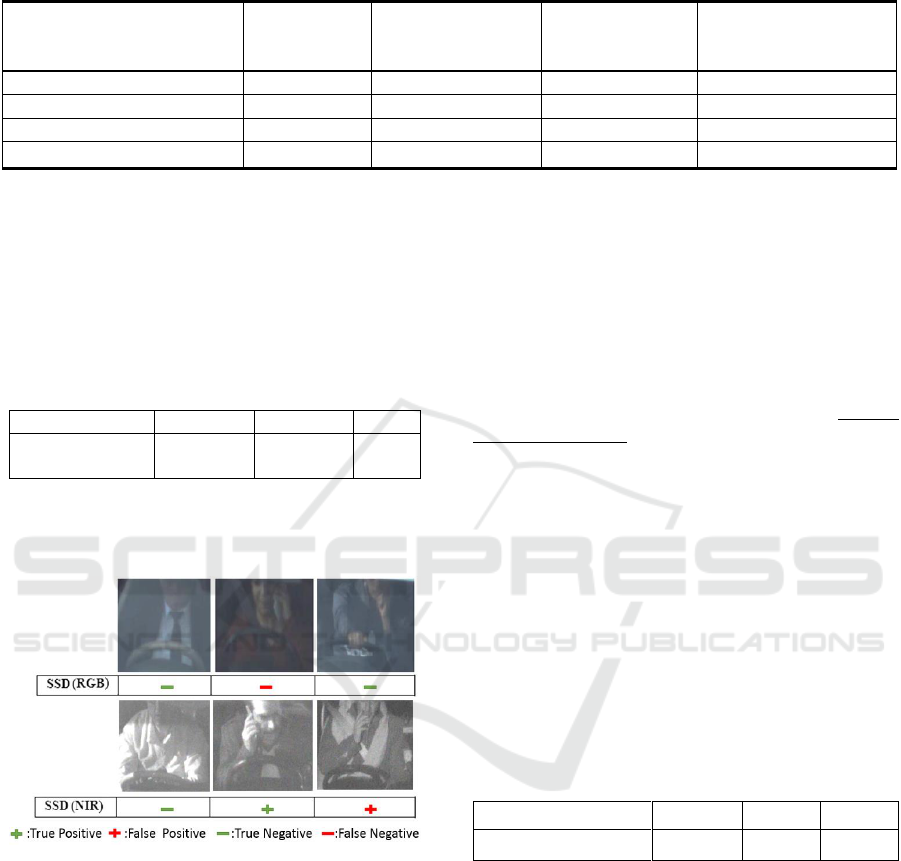
Table 4: Confusion Matrix of proposed SSD method. Numbers in the table are presented as NIR and RGB test results,
respectively.
When the driver is detected, we apply phone
usage violation detection/classification methods for
either NIR or RGB images. Table 2 presents the
overall performance of the proposed methods for
phone usage violation detection and Table 3 shows
visual illustration obtained for SSD method under
various imaging conditions.
Table 2: Accuracy Rates of the proposed methods.
Methods
SSD
CNN
FV
Accuracy
(NIR/RGB)
0.904/
0.911
0.739/
0.720
0.641/
0.881
Table 3: A visual illustration of SSD output for sample
images. First, second and third column show no violation,
violation and hard negative cases, respectively.
In order to compare the performance of SSD, we
utilized image classification based CNN and FV
models. It is clear that SSD outperforms CNN model
and FV model by giving the highest accuracy. SSD is
very successful at learning a pattern thanks to its
spatial and spectral learning mechanism. For better
interpretation of the performance, confusion matrix of
results, sensitivity and precision rates of SSD method
are shown in Table 4. We have partitioned our test set
as NIR and RGB images in order to analyse the results
of different image representation. The results
demonstrate that usage of either NIR or RGB images
is convenient for our phone usage violation detection
task. Hard negative case detection allows us to
eliminate unnecessary violation detection in the
driver region containing hand gestures.
According to the results, even though high
accuracy rate is observed, sensitivity and precision
rate is relatively low. Considering our NIR and RGB
test set sensitivity rate of SSD model is 44, 2 % and
42, 8 %, respectively. In some cases, mobile phone
use of driver may not be observed clearly. Therefore,
detectors tend to decide as there is no violation and it
causes serious reduction in sensitivity rate. From a
different viewpoint, even though there is no violation
in some cases, hand gestures of driver might cause a
complexity making a right decision of detector.
Therefore, For NIR and RGB images in the test set,
precision rate drops to 68, 4 % and 60 %, respectively.
Computation times of the proposed methods are
analyzed using a computer with 16 GB RAM, Intel
Core i7 processor and an Nvidia GeForceGTX 780 Ti
GPU card. GPU card is utilized for SSD object
detection and CNN image classification tasks. It is
observed that SSD300 model produce detection
results at 60 milliseconds and CNN model classifies
an image at approximately 32 milliseconds as shown
in Table 5.
Table 5: Run-time of 3 methods for a single image.
SSD
CNN
FV
Run Time (seconds)
0,060
0, 032
0,078
5 CONCLUSION
In this study, we proposed driver cell phone usage
violation detection using license plate recognition
camera images. Proposed method combines state-of-
the-art deep learning based object detection
technique. In order to compare our deep learning
based SSD model, we utilized deep learning based
CNN model, also we analysed machine learning
based FV method as a prior work. Proposed SSD
model typically achieve an overall accuracy around
91 % on a test set consisting of 2264 RGB images and
Actual Class / Predicted
Class
(NIR/RGB)
Violation
No-Violation
Hard Negative
Overall
Violation
50/21
29/11
34/17
113/49
No-Violation
15/10
3269/2020
235/143
3519/2173
Hard Negative
8/4
35/15
42/23
85/42
Overall
73/35
3333/2046
311/183
3717/2264
Driver Cell Phone Usage Violation Detection using License Plate Recognition Camera Images
473

3717 NIR images. In the future, we will look into
using the combination of different deep learning
based object classification techniques and well-
known classification techniques.
REFERENCES
IBM Smarter Cities Public Safety, (2012). Law
Enforcement.
European Road Safety Observatory (ERSO), (2015). Cell
phone use while driving, https://ec.europa.eu/transport/
road_safety/erso-synthesis-2015-cellphone-
detail_en.pdf.
World Health Organization (WHO), (2017). “Save Lives-a
Road Safety Technical Package”, http://www.who.int/,
2017.
Strategic Highway Research Program (SHRP2), (2006-
2015).http://www.trb.org/StrategicHighwayResearchP
rogram2SHRP2/ Blank2.aspx.
Artan, Y., Bulan, O., Loce, R. P.,Paul, P., (2014) Driver
Cell Phone Usage Detection From HOV/HOTNIR
Images, In IEEE Conf. on Comp. Vis. Pat. Rec.
Berri, R. A., Silva, A. G., Parpinelli, R. S.., Girardi, E.,
Arthur, R., (2014). A Pattern Recognition System for
Detecting Use of Mobile Phones While Driving, In
arXiv:1408.0680v1.
Elings, J.W., (2018). Driver Handheld Cell Phone Usage
Detection, Utrecht Univ. M.S. Thesis.
Seshadri, K., Juefei-Xu, F., Pal, D. K., Savvides, M., Thor,
C., (2015). Driver Cell Phone Usage Detection on
Strategic Highway Research Program (shrp2) Face
View Videos, In Proc. IEEE Conf. CVPRW, pp. 35-4.
Le, T. H. N., Zheng,Y., Zhu, C., Luu, K. and Savvides, M.,
(2016). Multiple Scale Faster-RCNN Approach to
Driver’s Cell-phone Usage and Hands on Steering
Wheel Detection, in CVPR.
Zhou, B., et al., (2017). Seat Belt Detection Using
Convolutional Neural Network Bn-Alexnet, pp.384-
395, in ICIC.
Elihos, A., Balci, B., Alkan, B., Artan, Y., (2018).
Comparison of Image Classification and Object
Detection for Passenger Seat Belt Violation Detection
Using NIR & RGB Surveillance Camera Images, in
AVSS.
Bojarski, M., Desta, D., Drawokovski, D., Firner, B., Flepp,
B., Goyal, P., Jackel, L., Monfort, M., Muller, U.,
Zhang, J., Zhang, X., Zhao, J., Zieba, K., (2016). End-
to-end deep learning for self driving cars, In arxiv
Preprint arxiv:1604:07316.
Liu, W., Anguelov, D., Erhan, D., Szegedy, C., Reed, S.,
Fu, C., Berg, A., (2016). Ssd: Single shot multibox
detector, In European Conference on Computer Vision,
pp. 21–37. Springer.
Redmon, J. , Divvala, S., Girshick, R., Farhadi, A., (2016).
You only look once: Unified real time object detection,
In IEEE CVPR, pp. 779-787.
Ren, S., He, K., Girschick, R., (2015). Faster R-CNN:
towards real-time object detection with region proposal
networks, In NIPS.
Huang, J., Rathod, V., Sun, C., Zhu, M., Korattika, A.,
Fathi, A., Fischer, I., Wojna, Z., Song, Y., Guadarrama,
S., Murphy, K., (2017). Speed/accuracy trade-offs for
modern convolutional object detectors, in arXiv:
1611.10012v3.
Deng, J., Dong, W., Socher, R., Li, L., Li, K., Fei-Fei, L.,
(2009). Imagenet: A large-scale hierkarchical image
database, in Proceedings of the IEEE Conference on
Computer Vision and Pattern Recognition, pp. 248–
255.
Simonyan, K., X Zisserman, V., (2014). Very Deep
Convolutional Networks for Large-Scale Image
Recognition, In arXiv:1409.1556.
Perronnin, F., Sanchez, J., Mensink, T., (2010). “Improving
Fisher Kernels for Large-Scale Image Classification,”
in ECCV.
Kingma, D. and J. Ba (2014). Adam: A method for
stochastic optimization. arXiv preprint
arXiv:1412.6980.
Xiong, X. and Torr, F. De la, (2013). Supervised Descent
Method and its Application to Face Alignment. In IEEE
Conference on Computer Vision and Pattern
Recognition (CVPR), pages 532–539.
Cortes, C., and Vapnik, V., (1995). Support-Vector
Networks. Machine Learning, 20(3):273–297.
Das, N., Ohn-Bar, E. and Trived, M.M , (2015). On
performance evaluation of driver hand detection
algorithms: Challenges, dataset, and metrics. In Conf.
on ITS.
Schapire, R.E and Singer, Y., (1999). Improved Boosting
Algorithms Using Confidence-rated Predictions.
Machine Learning, 37(3):297–336.
VEHITS 2019 - 5th International Conference on Vehicle Technology and Intelligent Transport Systems
474
