
Sizing of II-Life Batteries for Grid Support Applications and
Economic Evaluations
Giuseppe Graber
a
, Vito Calderaro
b
, Vincenzo Galdi
c
and Antonio Piccolo
d
Department of Industrial Engineering, University of Salerno, Fisciano (SA), Italy
Keywords: Battery Sizing, Economic Assessment, Electric Vehicles, Energy Storage Systems and Second Life.
Abstract: Power systems are facing increasing stress due to modernization changes in both supply, through the growing
penetration level of renewable sources, and demand due to the spread diffusion of electric vehicles (EVs). In
this scenario, the use of energy storage systems (ESSs) is becoming technologically attractive but problems
of economic and ecological sustainability are still evident. For these reasons, II-Life battery modules are a
possible solution for supporting power systems: they are a promising prospect for the modernization process.
We propose a method to size an ESS of exhausted plug-in EV battery packs for grid support applications. The
method estimates the residual value of cycles for II-Life battery modules, the decrease in the supplied power
due to the battery ageing and the number of EV battery packs to meet service requirements. Then, an economic
assessment is presented to compare them with an equivalent I-Life storage system.
1 INTRODUCTION
Energy storage systems (ESSs) for power system
application is attracting significant interest and
attention as an enabling solution for integrating the
growing penetration of renewable energy resources
and electric vehicles (EVs) into electrical grids,
(Calderaro, 2014 – Tejada-Arango, 2018). Likely,
ESSs are becoming an essential contributor to
modernization investments of power systems at each
voltage level. In fact, the ESSs can provide a technical
solution to face current industry challenges such as
power quality, network security, congestion
management, generator’s low utilization factor, and
fuel price volatility. Consequently, the storage
devices can propose ancillary services bringing
benefits to customers and energy operators, (Graber,
2017 – Ju, 2018).
However, two main challenges must be faced to
support the integration of ESSs into the networks: the
economic and ecological sustainability. Promising
prospects are coming from the use of II-Life battery
modules, reusing EV battery packs for alternative
uses. In particular, they still have significant
a
https://orcid.org/0000-0002-3474-2470
b
https://orcid.org/0000-0003-0868-6601
c
https://orcid.org/0000-0002-7768-7125
d
https://orcid.org/0000-0001-6405-7020
remaining capacity for grid support applications,
although this is not sufficient to provide an electric
driving range. The main advantages of these battery
modules are the supposed lower cost compared with
new battery modules and the possibility to delay the
development of the EV battery packs recycling chain
(Viswanathan, 2011).
Figure 1: II-Life battery process, (Reid, 2016).
In the literature, the relationship between II-Life
batteries and network electrical systems has been the
subject of several recent investigations. The use of
80
Graber, G., Calderaro, V., Galdi, V. and Piccolo, A.
Sizing of II-Life Batteries for Grid Support Applications and Economic Evaluations.
DOI: 10.5220/0007728800800088
In Proceedings of the 8th International Conference on Smart Cities and Green ICT Systems (SMARTGREENS 2019), pages 80-88
ISBN: 978-989-758-373-5
Copyright
c
2019 by SCITEPRESS – Science and Technology Publications, Lda. All rights reserved

II-Life battery-based ESSs for network support is
recently analysed in several papers. In particular, in
(Viswanathan, 2011) the authors propose a method
for determining the optimal rating of the modules and
the state of charge (SoC) profile during the operation.
In (Saez-de-Ibarra, 2016), an optimization study is
presented in order to maximize the value of an electric
vehicle battery to be used as a transportation battery
(in its first life) and, then, as a resource for providing
grid services (in its second life). Also in (Lacey,
2013) II-Life batteries are used for provision of
services with particular emphasis on peak shaving
and upgrade deferral of low voltage (LV) distribution
systems, while in (Gladwin, 2013) and (Koch-
Ciobotaru, 2015) a general estimation of the use of
batteries for electrical systems and a feasibility
analysis are investigated, respectively. The
integration of photovoltaic (PV) energy sources is
proposed in (Mukherjee, 2015), where studies on the
modular boost-multilevel buck converter to control
the storage systems are proposed, and in (Gohla-
Neudecker, 2015), where it is deducted an effective
control strategy for attaining maximum system
performance with minimum battery cell aging. Ref.
(Strickland, 2014) and (Tong, 2015 – Hamidi, 2013)
suggest a more general approach for supporting the
integration of renewable energy resources. In (Saez-
de-Ibarra, 2016) the important task of II-Life batteries
sizing, is faced. It is a complex procedure due to many
uncertainty factors such as degradation factors,
calendar life, and applications.
With this in mind, here, we extend (Calderaro,
2017) by proposing a method to size the II-Life
battery-based ESSs and assess the economic
outcomes. The method is based on two main steps:
the first one allows identifying an approximate value
of the residual number of cycles and the maximum
power that battery modules of II-Life ESS can
deliver, whereas in the second one, we calculate the
annual cost of energy to compare it with an equivalent
I-Life storage system.
2 SIZING METHOD FOR II-LIFE
BATTERIES
We propose a method for sizing an ESS consisting of
II-Life lithium batteries. The method takes into
account the real calendar life of the battery modules
and the uncertainty related to the residual capacity
measurements. The sizing methodology is composed
of four steps:
• modelling of the II-Life battery model consisting
of the series of a resistance and an ideal voltage
source and their relationship with SoC and
charging/discharging cycles (CDC);
• calculation of the residual cycles of the II-Life
lithium batteries by linearizing the relationship
between the batteries residual capacity and CDC;
• estimation of the II-Life battery aging in terms
of supplied power by linearizing the relationship
between the batteries internal resistance and CDC;
• Monte Carlo (MC) analysis to compute the
number of II-Life battery modules according to the
capacity and capability requirements.
2.1 Ii Life Battery Model
The II-Life battery is modelled as an ideal voltage
source in series with a resistor. In particular, the ideal
voltage source represents the open circuit voltage
(OCV) depending on SoC of the battery module,
while the series resistor R
int
represents its overall
internal resistance.
Figure 2: Proposed II-Life battery model.
The equations (1) describes the electric model of
II-Life battery modules. Specifically, the first
equation represents the Kirchhoff's voltage law, while
the second one is the n-polynomial relation between
OCV and SoC. The third equation models the SoC
update law, according to the required current from the
battery modules.
int
1
10
0
( ) ( ) ( )
( ) ...
1
( ) ( 0) ( ) ( )
3600
BATT BATT
nn
nn
t
BATT BATT
BATT
V t OCV t R I t
OCV SoC SoC SoC
SoC t SoC t V I d
C
(1)
In (1), β
0
… β
n
are the interpolation coefficients,
I
BATT
, V
BATT
and C
BATT
are the battery modules current,
voltage, and capacity, respectively.
Moreover, battery-aging leads to a decrease in
battery capacity as CDC increases described by the
function f as follows:
Sizing of II-Life Batteries for Grid Support Applications and Economic Evaluations
81
()
BATT
C f CDC
(2)
In Section 2.2, we present a method to estimate
the function f starting from EV battery datasheet. In a
similar way, the g function describes the increase of
R
int
by increasing CDC as follows:
int
()R g CDC
(3)
The method to estimate the function g is presented
in Section 2.3.
2.2 Residual Capacity vs. CDC
Approximation
Often, manufacturers do not provide any information
about relationships between the battery residual
capacity C
BATT
and its maximum number of CDC
performed at different depth of discharge (DoD) or
they give only some curves at certain DoD. In the
following, we describe a methodology to approximate
this relationship at different DoD.
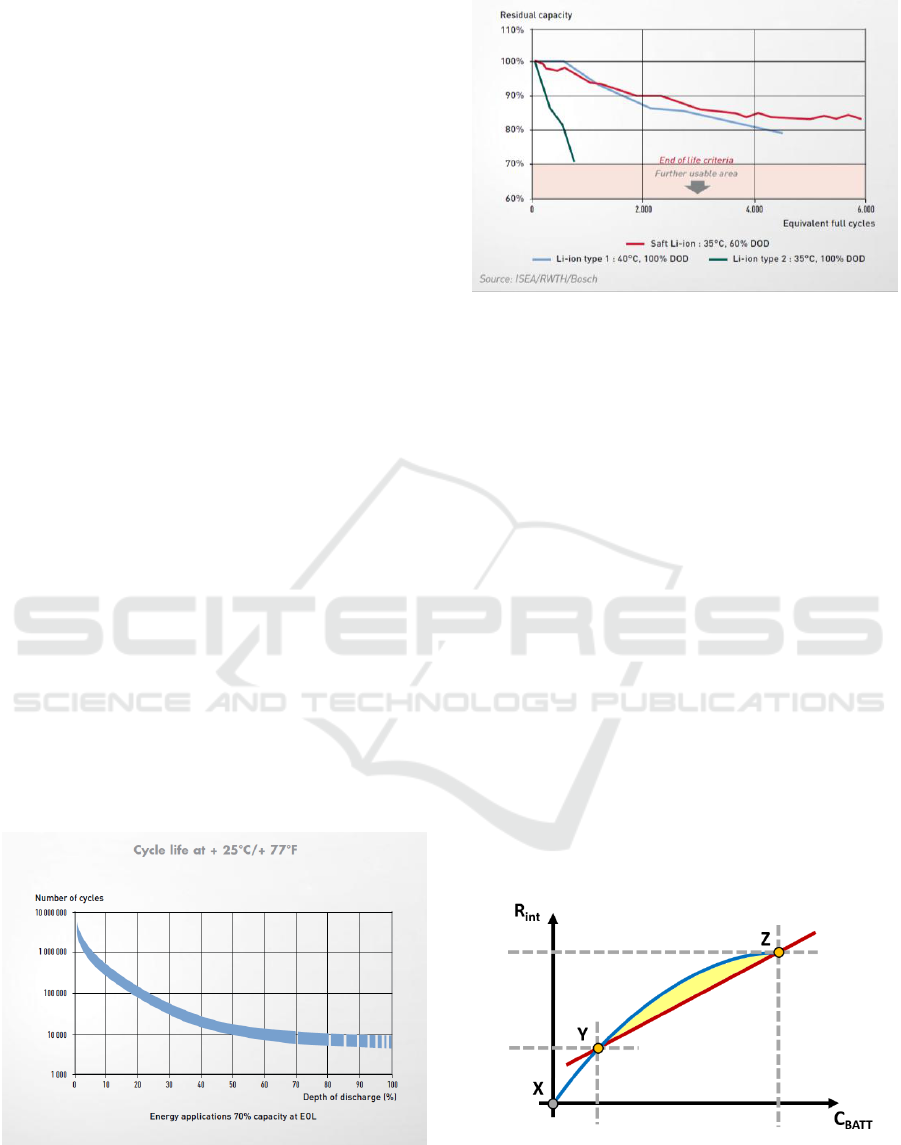
Figure 3 shows the typical trend (in logarithmic
scale) between the calendar life in terms of maximum
number of CDC and the DoD of a battery module
(Julien, 2016). Generally, the functional dependency
between CDC and DoD can be formalized by a test
curve, a table, or a mathematical relationship based
on measured data, which allows us to estimate the
number of CDC before the battery module reaches its
end of life (EoL). The EoL identifies the maximum
acceptable reduction of the battery rated capacity and
it is strongly dependent on the battery application
(traction, energy, etc.).
Figure 3: Lithium batteries typical trend - maximum
number of CDC vs. DoD.
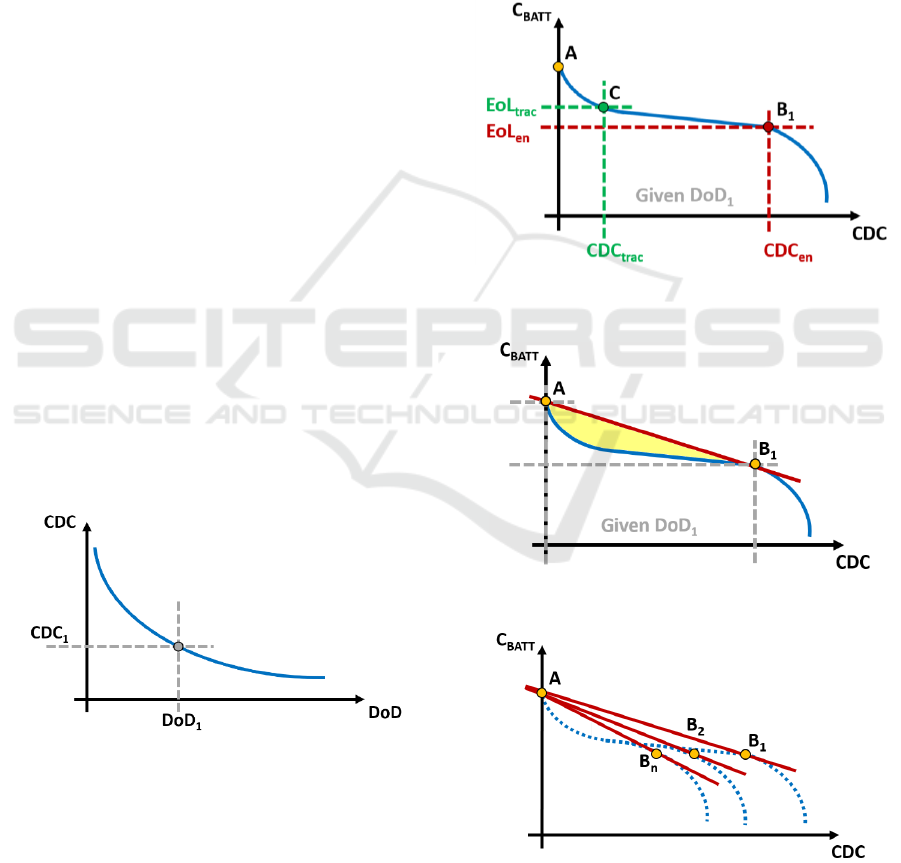
In Figure 4, we show the general trend of the
relationship between the residual capacity C
BATT
and
the maximum number of CDC for a fixed value of
DoD, which is given by the manufacturer (Julien,
2016). Typically, a nonlinear function describes this
relationship for lithium batteries. We observe a rapid
decrease of the battery residual capacity in the first part
of the characteristic, then, in the middle one, the trend
is almost linear and it decreases very quickly at the end
of the curve. The knee of the curve on the right of
Figure 4 identifies the battery EoL for energy
applications EoL
en
(typical value 60 - 70% of C
BATT
rated value) whereas the EoL for traction purposes is
defined when the residual capacity is in the range of 80
- 85% of C
BATT
rated value. For our purpose, it is not
relevant to identify battery discharge profiles (such as
DoD, CDC, etc.) before the point EoL
trac
- CDC
trac
(i.e.
the number of CDC at the EoL
trac
).
Figure 4: Lithium batteries typical trend - residual capacity
vs. CDC.
Figure 5: Linear approximation:residual capacity vs. CDC.
Figure 6: Linear approximation - residual capacity vs. CDC
for different DOD values.
SMARTGREENS 2019 - 8th International Conference on Smart Cities and Green ICT Systems
82
If the battery manufacturer does not give this
curve, it is possible to take some assumptions to
estimate the parameters of interest for our study. We
use the following procedure to approximate the curve
in Figure 4 by a line for different DoD values, as
shown in Figure 5:
• select a DoD value from Figure 3 (DoD
1
) to
obtain a maximum number of CDC (CDC
1
) that
represents the number of cycles when the battery
module reaches its energy EoL
en
;
• draw the point B
1
in the plane C
BATT
/CDC
(Figure 5);
• repeat the same procedure for each value of DoD
in Figure 3 in order to obtain a set of
n-1 maximum values (CDC
2
, CDC
3
,…, CDC
n
)
and for each maximum value of CDC, in the
plane C
BATT
/CDC draw the points (B
2
, B
3
,…,B
n
)
as show in Figure 6;
• in the plane C
BATT
/CDC, identify the point A in
correspondence of 0 cycles and C
BATT
rated
capacity;
• draw a line from the point A to each point
B
i
, i=(1, 2, … , n); each line represents a specific
DoD value (Figure 6);
• calculate the coefficients of the straight lines.
It is worth noting that the constellation of points
(B
1
, B
2
… B
n
) defines different number of cycles at
the energy EoL of the battery.
In particular, the yellow area in Figure 5 shows
the error obtained by using the proposed linear
approximation. It is greater in the I-Life of the battery,
but it is not important for our methodology.
Figure 7: Maximum number of CDC vs. DoD trend for
SAFT lithium-ion batteries.
Figure 8: Residual capacity vs. CDC trend for SAFT
lithium-ion batteries.
According to real data provided by batteries
manufacturers (SAFT, 2014), and showed in
Figure 7-8, the proposed linear approximation
reasonably describes the relationship between
residual capacity and the maximum number of CDC.
2.3 Aging of Internal Resistance
Approximation
The internal resistance of Li-ion batteries also
increases with use and aging. The increase in R
int
leads to a reduction of the maximum power that the
battery can deliver and therefore it is necessary to
estimate this increase so that the ESS is able to supply
the required power for a given grid service until its
EoL. Unfortunately, manufacturers of EV batteries
very often do not provide such information in
datasheets.
In our analysis, we assume that the increase of the
internal resistance during the battery life is a
synchronous process with the reduction of its residual
capacity.
Figure 9: Internal resistance vs. Residual capacity: typical
trend and linear approximation.
Sizing of II-Life Batteries for Grid Support Applications and Economic Evaluations
83

Figure 9 shows the typical trend of the internal
resistance reducing the battery residual capacity (i.e.
increasing the aging). In particular, the X, Y and Z
points are defined by the pair of values R
int
, C
BATT
at
the beginning of life (these values are provided by
battery manufacturer), at the EoL for traction, and at
the EoL for energy applications, respectively. The Y
and Z points are very difficult to estimate because we
usually do not have any data from the battery
manufacturers.
We assume that the increase in the R
int
is given by
the ratio between the nominal capacity and the
residual capacity of the battery. Therefore, to estimate
the point Y (or Z) it is necessary to multiply the R
int
nominal value (X point) for the ratio between battery
nominal and residual capacity. Finally, established
the Y and Z points, we can linearly estimate the trend
of R
int
with the aging. The yellow area in Figure 8
shows the error obtained by using the proposed linear
approximation.
2.4 Equivalent Sizing of II-Life ESS
In order to size the II-life ESS (i.e. define the number
of II-Life battery modules), we have to identify the
service that the ESS must perform. Let us assume that
this application has a fixed DoD (e.g. DoD
1
).
The proposed procedure is based on a preliminary
sizing obtained by using a conventional methodology
computing the number of I-Life battery modules M,
fixed the application (i.e. the necessary power and
energy for the service, the DoD value and thus the
maximum number of CDC). M is equal to the
maximum value between the ratio of the energy
requirement and the energy of one I-Life battery
module, and the ratio of the power requirement and
the power of one I-Life battery module. In order to
consider the II-Life of the modules, we assume, for
each one of them, a reduced capacity (battery capacity
equal to the EoL
trac
value multiplied C
BATT
) and an
increased R
int
value: in this way, the number of II-Life
modules is greater than the one obtained by using
I-Life battery modules.
Afterwards, we bring into the problem the
uncertainties due to an incorrect estimation of the
residual capacity and maximum power. We assume
M as the number of II-Life battery modules needed
for the application in case of uncertainty is not
considered. According to the available data, it is
possible to consider the points B
1
, C and Z as random
variables with a given probability distribution (e.g.,
uniform, Gaussian, etc.) to in order to bring into
account their uncertainties. We use a MC approach to
calculate: i) a distribution of residual cycles of II-Life
battery for the application; ii) a distribution of battery
maximum power at the EoL for the application.
We assume for our studies two Gaussian
distributions (μ
1
=CDC
trac
, σ
1
=1, μ
2
=CDC
en
and
σ
2
=1), to tackle the uncertainty due to a wrong
estimation of points B
1
and C. In a similar way, a
Gaussian distribution (μ
Z
=1.66*R
int
, σ
Z
=1) is
assumed at the point Z.
For these reasons, we consider m II-Life battery
modules in addition to M, able to guarantee a number
of CDC equal to CDC
*
≥ CDC
trac
- CDC
en
, and
maximum battery power at EoL
en
, P
BATT
≥ P
*
. In such
a way, the remaining life of the II-Life ESS and its
maximum power at the EoL
en
can be designed. In
particular, we introduce m
1
and m
2
that represent the
additional capacity necessary to the II-Life ESS for
satisfying the required CDC and the additional power
necessary for satisfying the maximum required
power, respectively. We calculate the parameter m
1
and m
2
by implementing an iterative procedure based
on a MC approach. Our procedure starts with
m
1
=m
2
=0 and ends when it finds the smaller value of
m
1
that ensures
Pr (CDC of M modules ≥ CDC
m
1
modules) >
90%
(4)
and the smaller value of m
2
that ensures
Pr (P
BATT
of M modules ≥ P
m
2
modules) >
90%
(5)
where
90%
is the percentile of the resulting
distribution.
The number m of battery modules satisfying the
CDC
*
and the P
*
requirements is the maximum value
between m
1
and m
2
. Then, we are able to define the
final number of II-Life battery modules (M+m
i
with
i=1 or 2 depending on the m
i
maximum value)
necessary to achieve an equivalent I-Life ESS and to
perform an economic assessment.
3 ECONOMIC METRIC
We use the net present value (NPV) as economic
metric to examine costs and revenues while
accounting for the time value of money (Masters,
2013). If the NPV of a system is positive, then the
investment should may be profitable. A negative
NPV indicates that the returns are worth less than the
cash outflows and the investment does not show a
financial benefit, although unquantified benefits may
be present. Annual cost of energy (ACOE) in [$/year]
represents the present value of total cost C
tot
multiplying by the capital recovery factor CRF. The
CRF converts a present value into a stream of equal
SMARTGREENS 2019 - 8th International Conference on Smart Cities and Green ICT Systems
84

annual payments over a specified lifetime N [year], at
a specified interest rate r. It is defined as follows:
(1 )
(1 ) 1
N
N
rr
CRF
r
(6)
and the C
tot
is given by:
&tot I M O REP
C C C C
(7)
where C
I
is the storage capital cost, C
M&O
is the net
present value of the total operations and maintenance
costs and C
REP
is the present value of the replacement
costs.
The capital cost C
I
is the one-time investment,
which brings the ESS into an operable status. It
contains two subsystems: the first one is the power
sub-system whereas the second one is the energy
storage sub-system. The cost of the two sub-systems
should be added together to get the overall capital
cost. C
I
can be formulated as
I P R E R FC
C C P C E C
(8)
where P
R
[kW] and E
R
[kWh] are the ESS rated
power and capability; C
P
[$/kW] and C
E
[$/kWh] are
the specific costs mainly related to the electronic
interface to the network and to the size of the ESS,
respectively. C
FC
[$] is the fixed cost (building cost,
landing cost, construction cost, etc.).
There are at least four elements in the C
M&O
cost:
1) labour associated with plant operation, 2) plant
maintenance, 3) equipment wear leading to its loss-
of-life, and 4) disposal and decommissioning cost.
The C
M&O
cost is defined as follows:
&
1
(1 )
N
n
MO
n
n
C
C
r
(9)
where C
n
[$] is the annual operation cost on n years
and it is defined as a function of two main parts: a
fixed one related to the ESS rated power, and a
variable part depending on its annual discharged
energy E
year
[kWh].
n f R v year r
year
r CH
CH
C C P C E C
E
CC
(10)
The annual operation cost is split in variable cost
(C
v
) and charging cost (C
r
): where η
CH
is the battery
charging efficiency and C
CH
[$/kWh] is the electricity
cost coefficient for charging the ESS.
Battery modules have to be replaced one or more
times during the project lifetime. The NPV of
replacement cost is:
2
[(1 ) (1 ) ...]
LL
REP RP
C C r r
(11)
where C
RP
[$] is the future value of replacement cost
and L is the replacement period that can be estimated
by using the battery modules datasheet such as
(Julien, 2016).
4 SIMULATION FRAMEWORK
We apply the introduced methodology for the sizing
of II-Life ESSs to a real distribution system. We
consider the implementation of a peak shaving
service for the microgrid that supplies the Campus of
the University of Salerno (UniSA).
4.1 Case Study
The UniSA microgrid is a 12 bus 20 kV distribution
system with two feeders configured in closed loop
(Figure 10). Connected to the grid, there are several
distributed generators (DG). Two combined heat and
power (CHP) units, with a rated power of 580 kW
each one at bus 11, and eight PV power plants for a
total PV rated power of 1076 kW installed on the roof
of the campus buildings (bus 2, 3, 4, 5, 6, 8, 9 and 12).
CHP units produce both electricity used to supply the
loads and thermal energy used to heat water of the
campus sport facilities.
Figure 10: Power grid of the UniSa Campus.
In Figure 11, we show the typical daily profiles of
the net active power drown from the main external
PCC by the UniSA network (bus 1). Blue and green
lines depict the active power absorption with and
without internal PVs and CHPs, respectively. Finally,
yellow and pink lines show the average (calculated
every 15 minutes) active power generated by the PV
and CHP units.
Sizing of II-Life Batteries for Grid Support Applications and Economic Evaluations
85
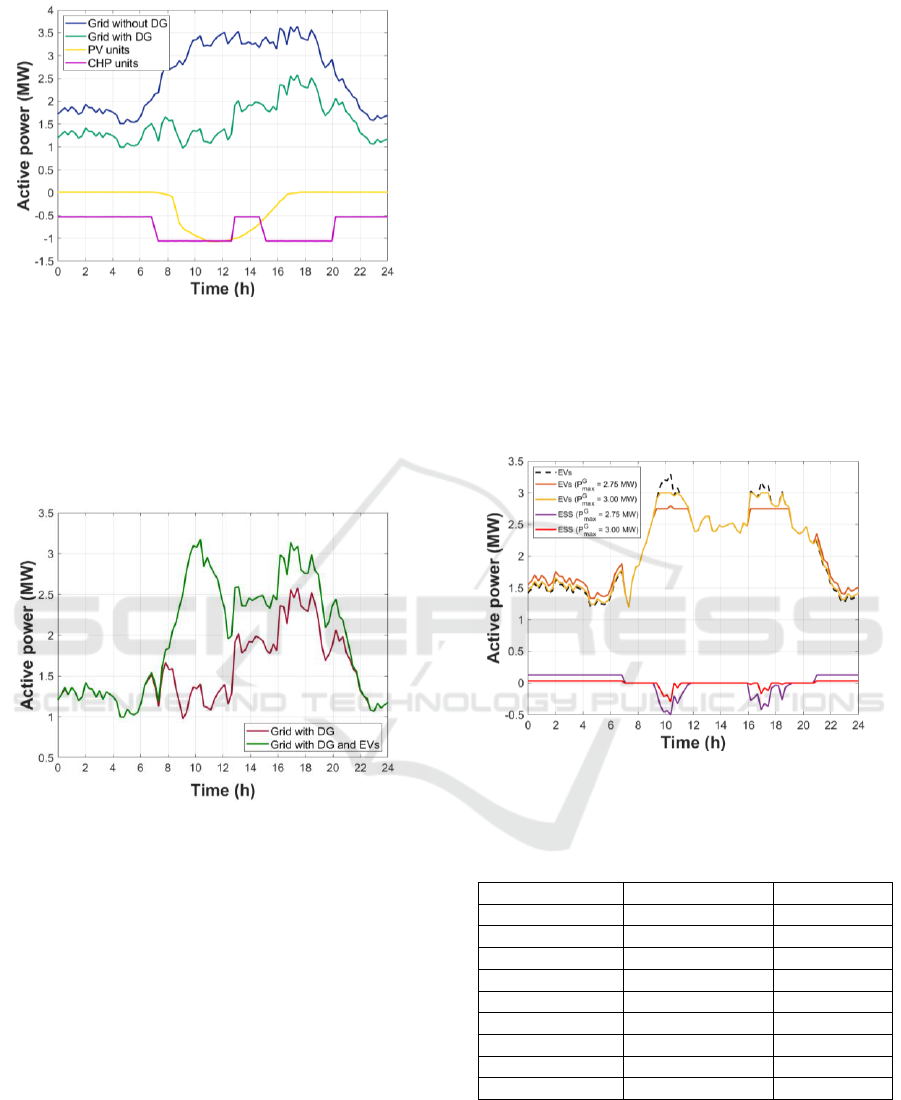
Figure 11: Active power drown from the UniSA microgrid.
Furthermore, the study in (Graber, 2017), based
on the CO.S.MO. (Cooperative Systems for
Sustainable Mobility and Energy Efficiency)
European research project, allows us to consider the
additional demand due to the connection of EVs to
charging stations (CSs) into the Campus.
Figure 12: Active power drown from the UniSA microgrid
by adding the EVs charging load.
The study assumes that the users behaviour and
their mobility needs highlighted by the COSMO data
analysis, do not change moving from ICE-based
(internal combustion engine) vehicles to battery EVs.
Moreover, different types of CSs (AC level 2,
CHAdeMO, SAE Combo, Tesla Supercharger, etc.),
each of them characterized by different values of
charging power, are considered in the analysis. EV
charging demand profile is depicted in Figure 12.
4.2 Economic Assessment
We consider one II-Life battery ESS supporting CSs
in the UniSA parking area and implementing a peak
shaving based control. More in detail, during the day,
the ESS acts when the power demand of the UniSA
Campus is greater than a given threshold working in
load following mode. At night, the ESS charge itself
in constant charging power mode.
In our analysis, we consider two different size of
the ESS according to the imposed maximum power
drown from the main external grid, P
G
max
. More in
detail, by imposing P
G
max
=3.00 MW we need an ESS
of 0.55 MW, 1.6 MWh (ESS
1
), while by imposing
P
G
max
=2.75 MW we need an ESS of 0.80 MW,
2.0 MWh (ESS
2
), (Graber, 2017).
Figure 13 shows the flattening effect of the II-Life
battery ESSs on the UniSA power demand when the
electric load is greater than P
G
max
. The results for the
P
G
max
=3.00 MW and P
G
max
=2.75 MW case studies are
presented. In particular, the ESS reduces the peak
load acting in load following mode from 9:00 a.m. to
12:00 p.m. and from 16:00 p.m. to 19:00 p.m., while
the ESS charges itself from the external grid in
constant power mode, from 21:00 p.m. to 7:00 a.m.
Figure 13: Daily trends of active power drawn by UniSA
Campus from the external grid with EVs charging load and
second life ESS.
Table 1: Parameter for the Economic Assessment.
Parameter
Value
Unit
N
20
Years
r
4
%
C
P
125
$/kW
C
E
470
$/kWh
C
f
9.2
$/kW
C
v
0.0011
$/kWh
E
year
for ESS
1
440
MWh
E
year
for ESS
2
550
MWh
C
CH
0.114
$/kWh
SMARTGREENS 2019 - 8th International Conference on Smart Cities and Green ICT Systems
86

Figure 14: Comparison of ACOE for I-Life and II-Life
battery ESS.
We calculate the ACOE for I-Life and II-Life
battery solutions based on the parameters in Table 1.
We, also, assume that C
FC
is zero and the C
REP
is equal
to 80% of C
I
.
In Figure 14, we compare the ACOE of the I-Life
ESS and that of the II-Life ESS, assuming the
P
G
max
=3.00 MW case study. The aim is to give a
competitive price to the II-Life ESS compared to the I-
Life solution. In our case study, the sensitivity analysis
has pointed out that the price of II-Life battery modules
should be reduced at least of 55% compared to the I-
Life battery modules, in order to obtain an ACOE value
for the II-Life ESS comparable to that of the I-Life
ESS. It is worth to note that 100% cost reduction of II-
Life battery modules leads to an ACOE of the II-Life
ESS not equal to zero due to O&M costs.
Table 2: II-Life ESS Sizing by using Different Battery
Packs (0.55 MW, 1.6 MWh).
Model
Module
energy
Module
power
M
m
1
m
2
Nissan leaf
24 kWh
90 kW
67
15
3
Tesla
Model S
75 kWh
285 kW
22
5
1
BMW i3
33 kWh
125 kW
49
11
2
Renault Zoe
22 kWh
65 kW
73
16
4
Citröen C0
14 kWh
49 kW
114
25
6
Table 3: II-Life ESS Sizing by using Different Battery
Packs (0.8 MW, 2.0 MWh).
Model
Module
energy
Module
power
M
m
1
m
2
Nissan leaf
24 kWh
90 kW
84
19
4
Tesla
Model S
75 kWh
285 kW
27
6
2
BMW i3
33 kWh
125 kW
61
14
3
Renault Zoe
22 kWh
65 kW
91
20
5
Citröen C0
14 kWh
49 kW
143
32
8
In Table 2, we show the number of I-Life battery
modules (M) and II-Life battery modules (M plus the
maximum value between m
1
and m
2
) needed to satisfy
the load following application (P
G
max
=3.00 MW case
study) and whose economic evaluation is shown in
Figure 13. The number M, m
1
, and m
2
are calculated
by using different EV battery packs of the best-selling
EV models for tackling the uncertainty due to residual
capacity estimation and increase of the internal
resistance. A similar analysis is carried out for the
P
G
max
=2.75 MW case study and it is proposed in
Table 3. It is worth to note that the additional II-Life
battery modules needed to satisfy the power
requirement of the peak shaving service is always less
binding than that concerning the maximum number of
CDC requirement.
5 CONCLUSIONS
We present a sizing method for the economic
assessment of II-Life ESSs in providing energy
services. A linear approximation is assumed to deal
with the degradation and aging of lithium-ion
batteries. We propose a methodology to calculate the
number of battery modules able to guarantee the
power service requirements at the EoL for energy
applications and to tackle the uncertainty due to the
estimation of the residual capacity in II-Life batteries.
We calculate the ACOE of two different II-Life
battery solutions able to provide a peak shaving
service on the UniSa Campus MV network by
reducing the imposed maximum power drown from
the main external grid. We compare them with the
I-Life ESS in order to identify a competitive price of
II-Life battery modules.
ACKNOWLEDGEMENTS
The authors gratefully thank UE and all technological
partners who have contributed to the success of the
CO.S.MO. research project.
REFERENCES
Tejada-Arango, D. A., Domeshek, M., Wogrin, S.,
Centeno, E., 2018. Enhanced Representative Days and
System States Modeling for Energy Storage Investment
Analysis. In IEEE Transactions on Power Systems, vol.
33, pp. 6534-6544.
Ju, C., Wang, P., Goel, L., Xu, Y., 2018. A Two-Layer
Energy Management System for Microgrids with
Sizing of II-Life Batteries for Grid Support Applications and Economic Evaluations
87

Hybrid Energy Storage Considering Degradation Costs.
In IEEE Transactions on Smart Grid, vol. 9, pp. 6047-
6057.
Calderaro, V., Galdi, V., Graber, G., Graditi, G., Lamberti,
F., 2014. Impact assessment of energy storage and
electric vehicles on smart grids. In Proc. Electric Power
Quality and Supply Reliability Conf., pp 15-18.
Graber, G., Lamberti, F., Calderaro, V., Galdi, V., Piccolo,
A., 2017. Stochastic characterization of V2G parking
areas for the provision of ancillary services. In Proc.
Innovative Smart Grid Technologies Conf. Europe,
pp.1-6.
Viswanathan, V. V., Kintner-Meyer, M., 2011. Second Use
of Transportation Batteries: Maximizing the Val ue of
Batteries for Transportation and Grid Services. In IEEE
Trans. Vehicular Technology, vol. 60, pp. 2963-2970.
Saez-de-Ibarra, A., Martinez-Laserna, E., Stroe, D.,
Swierczynski, M., Rodriguez, P., 2016. Sizing Study of
Second Life Li-ion Batteries for Enhancing Renewable
Energy Grid Integration. In IEEE Trans. on Industry
Applications, vol. 52, pp. 4999-5008.
Lacey, G., Putrus, G., Salim, A., 2013. The use of second
life electric vehicle batteries for grid support. In Proc.
IEEE EUROCON Conf., pp. 1255-1261.
Gladwin, D. T., Gould, C. R., Stone, D. A., Foster, M. P.,
2013. Viability of “second-life” use of electric and
hybridelectric vehicle battery packs. In Proc. IECON
Industrial Electronics Society Conf., pp. 1922-1927.
Koch-Ciobotaru, C., Saez-de-Ibarra, A., Martinez-Laserna,
E., Stroe, D. I., Swierczynski M., Rodriguez, P., 2015.
Second life battery energy storage system for enhancing
renewable energy grid integration. In Proc. Energy
Conversion Congress and Exposition Conf., pp. 78-84.
Mukherjee N., Strickland, D., 2015. Control of Second-Life
Hybrid Battery Energy Storage System Based on
Modular Boost-Multilevel Buck Converter. In IEEE
Trans. on Industrial Electronics, vol. 62, pp. 1034-
1046.
Gohla-Neudecker, B., Bowler M., Mohr, S., 2015. Battery
2nd life: Leveraging the sustainability potential of EVs
and renewable energy grid integration. In Proc. Clean
Electrical Power Conf., pp. 311-318.
Strickland, D., Chittock, L., Stone D. A., Foster, M. P.,
Price, B., 2014. Estimation of Transportation Battery
Second Life for Use in Electricity Grid Systems. In
IEEE Trans. on Sustainable Energy, vol. 5, pp. 795-
803.
Tong, S., Fung T., Park, J. W., 2015. Reusing electric
vehicle battery for demand side management
integrating dynamic pricing. In Proc. IEEE Smart Grid
Communications Conf., pp. 325-330.
Hamidi, A., Weber L., Nasiri, A., 2013. EV charging station
integrating renewable energy and second-life battery. In
Proc. Renewable Energy Research and Applications
Conf. pp. 1217-1221.
Julien, C., Mauger, A., Vijh, A., Zaghib, K., 2016. Lithium
Batteries - Science and Technology. Springer, 1
st
edition.
SAFT, May 2014. Lithium-ion battery life. Document
N°21893-2-0514 [Online]. Available: http://www.saft
batteries.com/force_download/li_ion_battery_life__Te
chnicalSheet_en_0514_Protected.pdf&prev=search
Masters, G., 2013. Renewable and Efficient Electric Power
Systems. Wiley, 2
nd
edition.
Calderaro, V., Galdi, V., Graber, G., Massa, G., Piccolo, A.,
2014. Plug-in EV charging impact on grid based on
vehicles usage data. In Proc. International Electric
Vehicle Conf., pp. 1-7.
Calderaro, V., Galdi, V., Graber, G., Lamberti, F., Piccolo,
A., 2017. A sizing method for economic assessment of
II-life batteries for power system applications. In Proc.
Power & Energy Society General Meeting, pp.1-5.
Graber, G., V., Galdi, Calderaro, V., Mancarella, P., 2017.
A stochastic approach to size EV charging stations with
support of second life battery storage systems. In Proc.
IEEE Manchester PowerTech, pp.1-6.
Reid, G., Julve, J., 2016. Second Life-Batteries as Flexible
Storage for Renewables Energies. Report. [Online].
Available: https://www.bee-ev.de/fileadmin/Publikatio
nen/Studien/201604_Second_Life-Batterien_als_flexi
ble_Speicher.pdf
Thirugnanam K., Kerk S. K., Yuen C., Liu N., Zhang M.,
2018. Energy Management for Renewable Micro-Grid
in Reducing Diesel Generators Usage with Multiple
Types of Battery. In IEEE Transactions on Industrial
Electronics, vol. 65, pp. 6772-6786.
SMARTGREENS 2019 - 8th International Conference on Smart Cities and Green ICT Systems
88
