
Learning from an Adaptive Learning System:
Student Profiling among Middle School Students
Shuai Wang
1
, Mingyu Feng
2
, Marie Bienkowski
1
, Claire Christensen
1
and Wei Cui
3
1
SRI Education, SRI International, 1100 Wilson Blvd., Suite 2800, Arlington, VA, 22209, U.S.A.
2
WestEd, 400 Seaport Court, Suite 222, Redwood, City, CA, 94063, U.S.A.
3
Squirrel AI Learning, 10 Jianguozhonglu #5110, Shanghai, China
Keywords: Adaptive Learning, Student Profiling, Mathematics Education, Cluster Analysis.
Abstract: Individuals who use adaptive technology products will have different learning experiences due to differences
in background knowledge. The Yixue intelligent learning system is a computer-based learning environment
that adapts content and guidance to individualize learning. Using K-means clustering on data collected from
206 middle school students (72440 records) who interacted with the mathematics learning system, we created
three clusters of students based on prior achievement: high, medium, and low. These three clusters were not
significantly associated with students’ gain scores, which implies that the learning system was able to help
students from different achievement levels learn equally well. We discuss implications for supporting
mathematics learning using adaptive systems for Chinese students.
1 INTRODUCTION
Adaptive learning systems (e.g., Knewton and
ALEKS) personalize instruction to students’
characteristics and abilities using a variety of adaptive
methods including machine learning. Adaptive
learning systems determine a student’s mastery level
and move the student through a path to prescribed
learning outcomes. One major challenge for
researchers and developers of adaptive learning
systems is to understand how students’ behaviors, and
the system’s response, can maximize student learning
outcomes (Sonwalkar, 2008).
Fortunately, online learning systems produce data
that can help researchers and developers understand
how students learn in response to system actions.
Student clustering is an effective approach to examine
how different types of students interact with
technology-based learning systems. For example,
researchers have used cluster analysis to explore
(1) student characteristics and preferences, (2) help-
seeking activities, (3) self-regulating approaches,
(4) error-making behaviours, (5) data from different
learning moments, and (6) data from various learning
environments (individual vs. collaborative).
Clustering algorithms used include K-means and
expectation maximization (Vellido et al., 2010).
Characterizing the types of students in adaptive
learning contexts expands our knowledge of ways to
effectively promote student learning. For example,
Bouchet et al.’s (2013) study of an intelligent tutoring
system found that high prior achievement clustered
with certain navigational behaviours in ways that
elicited more prompts from the system for high-
achieving students. Based on this finding, the authors
recommended system revisions to ensure that lower-
performing learners have equal opportunity to receive
system prompts.
Many schools in the United States are adopting
adaptive learning systems and efficacy studies are
beginning to show positive effects (Pane et al., 2017).
However, the use of adaptive learning systems in
Asia, especially in China, is still in the earliest stage.
No prior studies, to the best of our knowledge, have
explored how Chinese students interact with adaptive
learning systems. This paper details the distinct
student profiles that emerge when Chinese students
use an adaptive learning system, and it presents the
relationship between these profiles and students’
achievement using the system.
78
Wang, S., Feng, M., Bienkowski, M., Christensen, C. and Cui, W.
Learning from an Adaptive Learning System: Student Profiling among Middle School Students.
DOI: 10.5220/0007729700780084
In Proceedings of the 11th International Conference on Computer Supported Education (CSEDU 2019), pages 78-84
ISBN: 978-989-758-367-4
Copyright
c
2019 by SCITEPRESS – Science and Technology Publications, Lda. All rights reserved
2 PERSPECTIVE
Adaptive learning systems identify individual needs
and interests to provide personalized content and
learning pathways for students, with the goal of
maximizing student learning. Research shows
promising effects on student learning (VanLehn,
2011; Jones, 2018). Nevertheless, more research is
needed, as researchers have found encouraging but
mixed evidence for the causal impact of adaptive
learning as measured by standardized achievement
tests (CEPR, 2016).
The present study focuses on Yixue, a computer-
based adaptive learning system that diagnoses student
knowledge and progresses students through an
optimal path to knowledge mastery. We describe
Yixue’s features in brief here; for more see Li et al.,
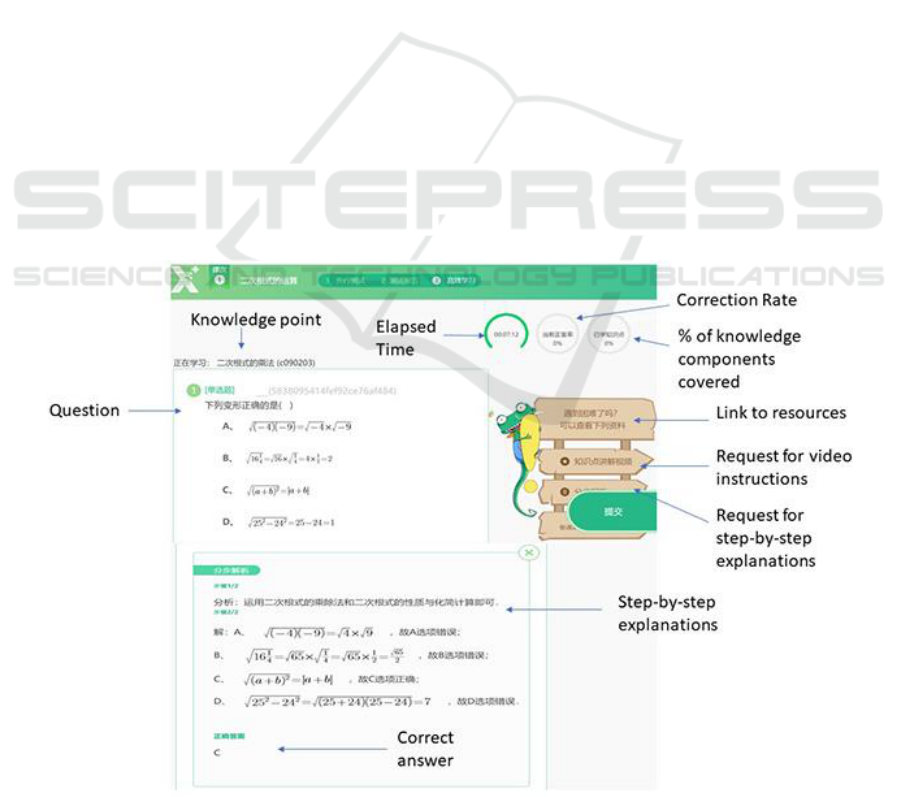
2017. As shown in Figure 1, Yixue’s features include:
(1) immediate feedback on correctness of student
responses, (2) an option to see an explanation of
solution processes after multiple incorrect attempts or
difficulties, and (3) automatic video play to address
student misconceptions when repeated errors are
detected. Yixue uses a “learning by doing” strategy:
Students do not receive instruction prior to answering
problems, but instead use resources embedded within
each problem as needed. Studies have found that
these features are instrumental to student learning
(e.g., Hattie and Timperley, 2007). Furthermore,
studies have found that students assigned to use
Yixue learn more efficiently and feel more positive
about their learning experience than students assigned
to comparison learning platforms (Li et al., 2017), and
that students learn more from using Yixue than whole
classroom instruction by teachers (Feng et al., 2018).
This prior work on Yixue did not look at variation
among students grouped by their characteristics and
behaviors with Yixue. This study extends this prior
work. Below we describe four key characteristics that
have been found to define student groups and/or to
predict their learning outcomes: student knowledge,
item difficulty, item duration, and item coverage.
First, studies have clustered students by prior
knowledge (e.g., Bouchet et al., 2013). Knowledge
predicts learning gains: students with different levels
of prior knowledge may benefit from instructional
approaches at different levels (Ayres, 2006; Flores et
al., 2012). In adaptive learning systems, identifying
student prior knowledge is essential to provide
scaffolding in learners' zone of proximal development
(Lin et al., 2009). For instance, in an analysis of an e-
learning program, clustering of students by ability
allowed assistance to be customized to students'
predicted achievement levels (Lykourentzou et al.,
2009).
Learning may also vary by the difficulty of the
items the system assigns. In adaptive learning
systems, item difficulty adjusts based on student prior
Figure 1: Screenshot of Yixue system.
Learning from an Adaptive Learning System: Student Profiling among Middle School Students
79

achievement and progress. Research has found that
students attempt more problems and show greater
improvements in performance when learning systems
adapt to the user’s ability level (Jansen et al., 2013).
Students can be categorized by the duration of
time they spend on items, and item coverage, or the
number of items and topics they cover (e.g., Bouchet
et al., 2013). For example, one study used student
response time to assess learning and to determine
mastery of the content (Mettler et al., 2011).
Completing items in a shorter duration and covering
more indicates higher level of content mastery.
Similarly, another study examining student profiling
in an intelligent tutoring system found that high-
achieving students completed items and learning
sessions in a shorter period.
A key question is whether students who vary on
these characteristics benefit equally from adaptive
systems. In regular instructional settings, one teacher
cannot attend to every single student for their unique
needs and interests, and thereby disadvantaged or
otherwise unprepared students may be left further
behind. However, in an effective adaptive system, we
expect students to benefit equally regardless of their
characteristics (e.g., prior performance). This is
because such systems provides personalized and just-
in-time feedback which is found to be effective for
student learning (Azevedo and Bernard, 1995; Shute,
2011).
The following research questions were explored
in this study:
1. What is the ideal number of clusters to best
capture the variability in students’ performance
and interaction with Yixue?
2. What are the characteristics that distinguish the
identified clusters?
3. How do these clusters relate to students’
achievement through using the system?
3 DATA SOURCES AND
METHODS
3.1 Participants
Students in this study were recruited from three
provincial capitals in China to learn Mathematics
using the online system. The study lasted for 4 days
with 5 hours of instruction per day. All participating
students were aged 13-15. 206 were included in the
analysis, with complete test information and system
data, with an average age of 13.8, and 56% were
female.
3.2 Data Sources
Students took paper-and-pencil content knowledge
tests before and after their use of the Yixue online
system. Tests were developed and reviewed by
experienced mathematics teachers. Tests were scored
on 100-point scale and measured using the same
units. The pre-test average was 55.72 and the post-test
average was 63.92. The pre-test and post-test have a
high correlation of 0.86 which permits us to use gain
scores can be used to measure student achievement
(U.S. Department of Education, 2018).
Yixue logs students’ interactions with the system.
We created student characteristics from the log data
of student behaviours and system responses, and
computed summary variables for each student (see
Table 1). For our purposes, these characteristics
constituted an overall or average picture of student
performance and learning with the system in terms of
duration. More fine-grained tracking of students’
interactions over time were beyond the scope of this
work. Values were standardized so that the clustering
results were not driven by differences in variable
units.
3.3 From Characteristics to Clusters
For each student, we computed values for each
variable in Table 1. These sets of characteristics
constitute a profile for each student. We conducted a
series of analyses to determine which of the 8 profile
characteristics (we did not use the post-test scores)
grouped students into similar sets. We used K-means
clustering, the most common clustering algorithm in
e-learning studies (Dutt et al., 2016), to compare
cluster solutions In K-means clustering, data are
initially partitioned into a set of K clusters. This is a
partition based on a first “good” guess at seed points,
which form the initial centres of the clusters. Then
data points are iteratively moved into different
clusters until there is no sensible reassignment
possible. To aid in differential description of each
cluster, we categorized mean scores as high, medium,
or low, as other studies have (Bouchet et al., 2013).
4 RESULTS
4.1 Cluster Extraction
Because the number of different prototypical learner
behaviours was unknown, we initiated K means
clustering with K = 1 - 10. We did not test a K value
larger than 10, considering that one of the purposes of
CSEDU 2019 - 11th International Conference on Computer Supported Education
80
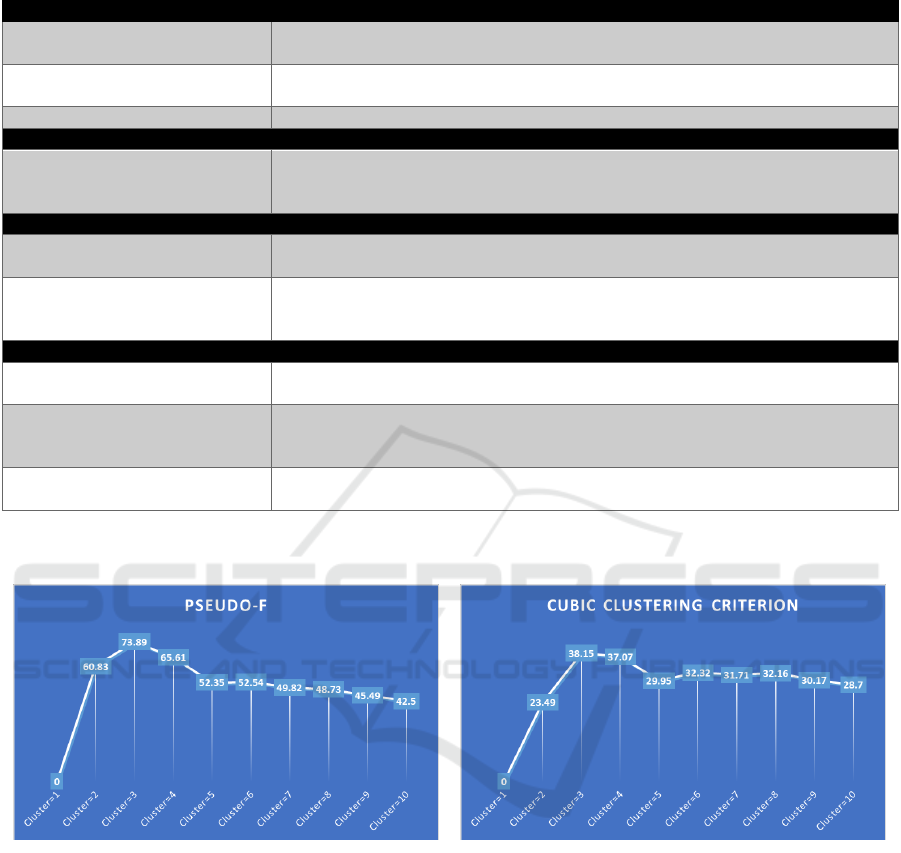
Table 1: Characteristics Used in Analysis.
Student Knowledge
Correct answer rate
The ratio of the number of items answered correctly and total number of items that
each student covered in the Yixue learning system.
Pre-test
Paper-pencil pre-test score collected outside the Yixue learning system. The range
of score was between 0-100.
Post-test
Paper-pencil post-test score. The range of score was between 0-100.
Item Difficulty
Mean difficulty level
Yixue adjusts the difficulty levels of the items based on students’ prior knowledge.
This variable is calculated as the mean of the difficulty levels of the items that
students were assigned and completed.
Content coverage
Number of items students
completed
Yixue learning system consists of many items. This variable represents the number
of items students completed in a limited amount of time.
Number of knowledge points
(topics) covered
Each item may contain multiple knowledge points (topics), and multiple items may
focus on the same knowledge point (topic). The system records the number of
knowledge points (topics) each student covers.
Duration
Mean duration of the items
completed
Average time spent on the items.
Mean duration differences of the
items answered correctly
An average of the centered variable of durations of the items answered correctly.
Centering was accomplished by subtracting the mean duration of items answered
correctly for all students from the duration for a particular item.
Mean duration differences of the
items answered incorrectly
An average of the centered variable of durations of the items answered incorrectly.
Note: We expect students to complete items in under 5 minutes. We set a threshold of 10 minutes for removing a specific
response from the analysis. The assessment designers indicated that a response time of greater than 10 minutes was a strong
indication of an outlier.
Figure 2: Pseudo-F statistics of cluster analysis with K = 1
to 10. A larger Pseudo-F value indicates a better cluster
solution.
Figure 3: Cubic clustering criterion statistics of cluster
analysis with K = 1 to 10. A larger cubic clustering criterion
value indicates a better cluster solution.
cluster analysis is data reduction, and many clusters
may not be meaningful. For each of the 10 clustering
sizes, we performed K-means analysis on the
variables generated above and produced clusters. To
decide the optimal K for the data set, we used the
Pseudo F Statistic and cubic clustering criterion -
CCC (Caliński and Harabasz, 1974) to assess the
number of clusters. K = 3 clustering generated the
largest Pseudo F Statistic and CCC (Figures 2 and 3),
offering clear interpretations (Figure 4) and
parsimony.
4.2 Distinguishing Clusters
We examined student and system-interaction
characteristics for each of the three clusters. ANOVA
analyses comparing the three clusters indicated
significant differences on all 8 characteristics,
p < .0001 (Table 2).
Learning from an Adaptive Learning System: Student Profiling among Middle School Students
81
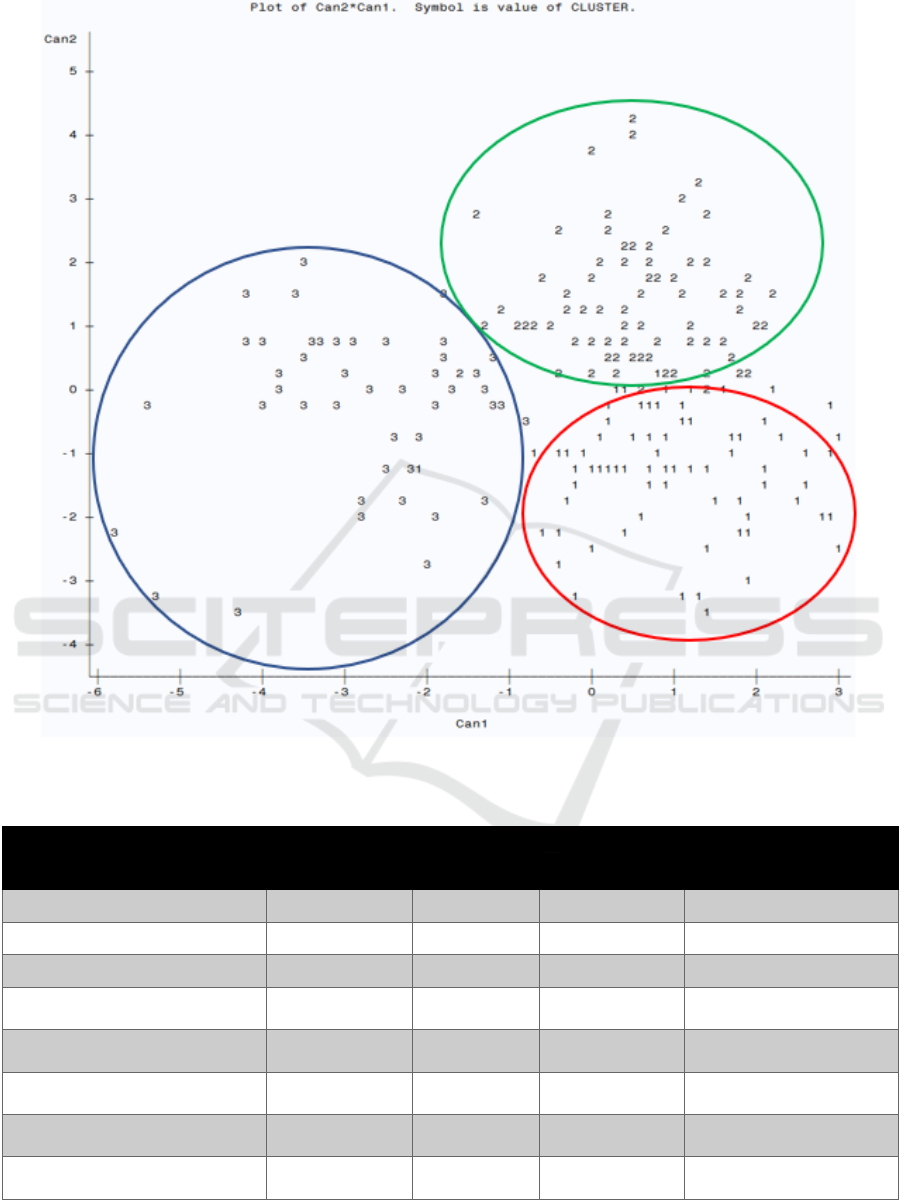
Figure 4: Canonical correlation plots. The red circle indicates cluster 1, green indicates cluster 2, and dark blue is cluster 3.
Table 2: Mean of standardized values of three clusters generated by K means.
Variables
Cluster 1
(N=80)
M (SD)
Cluster 2
(N=81)
M (SD)
Cluster 3
(N=45)
M (SD)
Statistics
Correct answer rate
-0.12 (0.80)
0.73 (0.52)
-1.10 (0.88)
F(2, 203) = 93.76***
Pre-test
-0.18 (0.94)
0.68 (0.67)
-0.91 (0.71)
F(2, 203) = 61.50***
Mean difficulty level
0.17 (0.97)
0.42 (0.60)
-1.07 (0.87)
F(2, 203) = 50.79***
Number of items students
completed
0.85 (0.77)
-0.28 (0.52)
-1.02 (0.75)
F(2, 203) = 120.97***
Number of knowledge points
(topics) covered
0.63 (0.59)
0.05 (0.74)
-1.22 (0.87)
F(2, 203) = 95.48***
Mean duration of the items
completed
-0.77 (0.63)
0.72 (0.79)
0.06 (0.88)
F(2, 203) = 79.23***
Mean duration differences of the
items answered correctly
-0.66 (0.58)
0.57 (0.83)
0.13 (1.18)
F(2, 203) = 43.82***
Mean duration differences of the
items answered incorrectly
-0.71 (0.52)
0.73 (0.92)
-0.05 (0.86)
F(2, 203) = 70.80***
Note. *** indicates p < .0001
CSEDU 2019 - 11th International Conference on Computer Supported Education
82

Cluster 2 included high-performing students
indicated by high pre-test scores, high correct answer
rate, and completing items with a high difficulty
level. These students also had high average duration
for items completed, high mean duration differences
of the items answered correctly, and high mean
duration differences of the items answered incorrectly
(see variable descriptions in Table 1). Interestingly,
among the three clusters, students in this cluster had
a medium number of items completed and medium
knowledge points covered.
Cluster 1 included medium-performing students
indicated by medium pre-test scores, medium correct
answer rate, and completing medium-difficulty-level
items. These students had low duration of the items
completed, low mean duration differences of the
items answered correctly, and low mean duration
differences of the items answered incorrectly. They
had a high number of items completed and knowledge
points covered.
Cluster 3 included low-performing students
indicated by low pre-test scores, low correct answer
rate, and completing low-difficulty-level items.
These students had medium duration of items
completed, medium mean duration differences of the
items answered correctly, and medium mean duration
differences of the items answered incorrectly. They
had a low number of items completed and knowledge
points covered.
4.3 Association between Clustering and
Post-test
We examined whether students in each of the three
clusters had different gains, measured by the score
improvement from the pre-test to the post-test. No
significant difference was found between the three
clusters on score gain, F(2, 203) = 0.44, p = .64,
R2 = .004.
5 CONCLUSION AND
SIGNIFICANCE
The current study showed that three clusters best
captured the variability in students’ performance and
interaction with Yixue. No single characteristic stood
out as distinguishing students in each cluster. Clusters
strongly corelated with students’ gain scores. We
propose some explanations for these findings below,
but acknowledge that more research is needed to
complete our understanding.
5.1 Student Behaviour
The study showed three different sets of students
learning using the adaptive system. Such information
can be very useful for system designers as well as
researchers. In some cases, the student characteristics
that clustered students together were surprising. For
instance, high-performing students spent more time
on items compared to students in the other two
clusters. This might seem to contradict prior research
which found that high-performing students spend less
time on items (e.g., Bouchet et al., 2013; Mettler et
al., 2011). However, the pedagogical approach of
Yixue’s “learning by doing,” where teaching is
embedded within problems, might suggest an
explanation. First, these students were working on the
most difficult problems. They appeared to take their
time answering question correctly. These high-
performing students are spending time both “doing”
the difficult questions and time learning from
embedded supports. Further data on the time students
spend on learning is being collected for future work.
This unique “learning by doing” approach in the
adaptive system is worth further investigation.
5.2 Adaptive Learning System
We found evidence that the Yixue learning system
can adapt to student learning needs. For instance, high
performing students were assigned and completed
high-difficulty-level items, which is a direct
indication of the adaptability of the system. Also, all
students benefited from using Yixue. There was no
significant relationship between belonging in a
cluster and gain scores. This means that Yixue can
help students at all levels to learn equally well. By
contrast, in regular classrooms, disadvantaged
students may struggle with the pace of the lessons,
resulting in smaller gains compared to advanced
students. These findings are in accordance with prior
research which demonstrated the effectiveness of
adaptive learning systems in the U.S. (Pane et al.,
2017).
Future work could address some limitations of
this study based on available data about students’
behaviours. We could learn more about students by
analysing information about the time spent on
instructional videos or the number of times students
watched instructional videos. We are currently
investigating what additional system data can be
captured and used in future research.
Overall, these results contribute to the
understanding of one of the first adaptive learning
system developed in China. They also provide a
Learning from an Adaptive Learning System: Student Profiling among Middle School Students
83

preliminary understanding of how Chinese students
behave when they interact with such systems.
Whether the differences we found relate to cultural
differences is also an area for further research.
REFERENCES
Ayres, P., 2006. Impact of reducing intrinsic cognitive load
on learning in a mathematical domain. Applied
Cognitive Psychology, 20, pp.287–298.
Azevedo, R. and Bernard, R.M., 1995. A meta-analysis of
the effects of feedback in computer-based instruction.
Journal of Educational Computing Research, 13,
pp.111–127.
Bouchet, F., Harley, J., Trevors, G. and Azevedo, R., 2013.
Clustering and profiling students according to their
interactions with an intelligent tutoring system
fostering self-regulated learning. JEDM | Journal of
Educational Data Mining, 5, pp.104–146.
Caliński, T. and Harabasz, J., 1974. A dendrite method for
cluster analysis. Communications in Statistics-theory
and Methods, 3, pp.1–27.
Center for Education Policy Research, Harvard University.
2019. Dreambox Learning Achievement Growth: Key
Findings. Available from cepr.harvard.edu/dreambox-
learning-achievement-growth.
Dutt, A., Ismail, M.A. and Herawan, T., 2017. A systematic
review on educational data mining. IEEE Access, 5,
pp.15991–16005.
Feng, M., Cui, W. and Wang, S. Adaptive Learning Goes
to China. International Conference on Artificial
Intelligence in Education, 2018, June. Springer, Cham.
Flores, R., Ari, F., Inan, F.A. and Arslan-Ari, I., 2012. The
impact of adapting content for students with individual
differences. Journal of Educational Technology &
Society, 15, pp.251–261.
Hattie, J. and Timperley, H., 2007. The power of feedback.
Review of Educational Research, 77, pp.81–112.
Jansen, B.R.J., Louwerse, J., Straatemeier, M., Van der
Ven, S.H.G., Klinkenberg, S. and Van der Maas, H.L.J.,
2013. The influence of experiencing success in math on
math anxiety, perceived math competence, and math
performance. Learning and Individual Differences, 24,
pp.190–197.
Jones, A. 2018. Interpreting Knewton’s 2017 Student
Mastery Results [online]. Available at:
https://www.knewtonalta.com/mastery/interpreting-
knewtons-2017-student-mastery-results/ [Accessed 22
July 2018].
Li, H., Cui, W., Xu, Z., Zhu, Z. and Feng, M. Yixue
Adaptive Learning System and Its Promise On
Improving Student Learning. International Conference
on Artificial Intelligence in Education, 2017 Porto,
Portugal.
Lin, H.-Y., Tseng, S.-S., Weng, J.-F. and Su, J.-M., 2009.
The Behavior of Tutoring Systems. Design and
Implementation of an Object Oriented Learning
Activity System, 12, pp.248–265.
Lykourentzou, I., Giannoukos, I., Mpardis, G.,
Nikolopoulos, V. and Loumos, V., n.d., Early and
dynamic student achievement prediction in e-learning
courses using neural networks. Journal of the American
Society for Information Science and Technology, 60,
pp.372–380.
Mettler, E., Massey, C.M. and Kellman, P.J. Improving
adaptive learning technology through the use of
response times. In: Carlson, L., Hoelscher, C. and
Shipley, T., eds. Expanding the space of cognitive
science: Proceedings of the 33rd Annual Conference of
the Cognitive Science Society, 2011 Austin. Cognitive
Science Society.
Pane, J.F., Steiner, E.D., Baird, M.D., Hamilton, L.S. and
Pane, J.D. 2017. How does personalized learning affect
student achievement? Santa Monica: RAND
Corporation.
Shute, V., 2011. Stealth assessment in computer-based
games to support learning. 2011. Computer games and
instruction. Information Age Publishing. pp.503–523.
Sonwalkar, N., 2008. Adaptive individualization: the next
generation of online education. On the horizon, 16,
pp.44–47.
U.S. Department of Education 2018. What Works
Clearinghouse
TM
standards handbook (Version 4.0).
Princeton: What Works Clearinghouse
TM
.
VanLehn, K., 2011. The relative effectiveness of human
tutoring, intelligent tutoring systems, and other tutoring
systems. Educational Psychologist, 46, pp.197–221.
Vellido, A., Castro, F. and Nebot, À., 2010. Clustering
educational data. In: Romero, C., Ventura, S.,
Pechenizkiy, M. and Baker, R. S. J. d. (eds.) 2010.
Handbook of educational data mining. pp.75–92.
CSEDU 2019 - 11th International Conference on Computer Supported Education
84
