
Rough Logs: A Data Reduction Approach for Log Files
Michael Meinig
1
, Peter Tr
¨
oger
2
and Christoph Meinel
1
1
Hasso-Plattner-Institute (HPI), University of Potsdam, 14482 Potsdam, Germany
2
Beuth University of Applied Science, 13353 Berlin, Germany
Keywords: Log Files, Anomaly Detection, Rough Sets, Uncertainty, Security.
Abstract:
Modern scalable information systems produce a constant stream of log records to describe their activities and
current state. This data is increasingly used for online anomaly analysis, so that dependability problems such
as security incidents can be detected while the system is running. Due to the constant scaling of many such
systems, the amount of processed log data is a significant aspect to be considered in the choice of any anomaly
detection approach. We therefore present a new idea for log data reduction called ‘rough logs’. It utilizes
rough set theory for reducing the number of attributes being collected in log data for representing events in the
system. We tested the approach in a large case study - the experiments showed that data reduction possibilities
proposed by our approach remain valid even when the log information is modified due to anomalies happening
in the system.
1 INTRODUCTION
In an increasingly complex modern information tech-
nology (IT) landscape, more and more systems get
connected for new or improved functionality and ef-
ficiency. This unavoidable trend makes online se-
curity supervision a first-class problem in all enter-
prise and governmental IT systems. With the ever-
increasing scale and complexity of these systems, it is
an established practice today to build automated secu-
rity defense mechanisms that operate autonomously
and constantly in the background. These mechanisms
monitor the system behavior, detect anomalies and
react accordingly with alarms or automated counter
measures.
Every anomaly detection mechanisms demands a
constant stream of system state informations to be an-
alyzed for suspicious characteristics. A common data
format for this kind information are log files, a textual
representation of relevant system events commonly
generate by server software and the operating system
itself. The amount of log data being collected in large
systems for these purposes is meanwhile a relevant
issue by itself.
This paper proposes a new method for reducing
the amount of log data needed for online analysis and
anomaly detection. We rely on an approach from un-
certainty theory called rough sets, which allows us to
shrink log data by removing roughly redundant at-
tributes in log file entries. The removable attributes
are identified by an one-time analysis of existing log
data, which finds logical relationships between the
system attributes recorded in the system protocol. At-
tributes that roughly express each other are then col-
lapsed to one representative attribute. The result are
‘rough’ logs that describe the system behavior in a
more uncertain, but still representative way. We tested
our approach with a 10GB real world data set and
found the reduction approach to be robust, meaning
that the choice for removed details remains reason-
able even when security anomalies modify the nature
of the original data.
The structure of this paper is as follows. Section
1 described the problem and the basic idea of the ar-
ticle. Section 2 will now present related work, espe-
cially with respect to the chosen uncertainty theory. In
Section 3 we sketch the procedure applied to log data
in the rough logs method. This is followed by Section
4, which shows the result of our case study. Section
5 discusses specifically the stability of the chosen ap-
proach. The paper concludes with a short summary
and a look into the future in Section 6.
2 RELATED WORK
The detection of anomalies refers to the problem of
finding patterns in data that do not match the expected
Meinig, M., Tröger, P. and Meinel, C.
Rough Logs: A Data Reduction Approach for Log Files.
DOI: 10.5220/0007735102950302
In Proceedings of the 21st International Conference on Enterprise Information Systems (ICEIS 2019), pages 295-302
ISBN: 978-989-758-372-8
Copyright
c
2019 by SCITEPRESS – Science and Technology Publications, Lda. All rights reserved
295

behavior. The data to be examined can be differenti-
ated into sequence data (e.g. time-series data, protein
sequences and genome sequences), spatial data (ve-
hicular traffic data or ecological data), and graph data.
There are also different types of anomalies: point
anomalies, context anomalies, and collective anoma-
lies (Chandola et al., 2009).
The finding of outliers or anomalies in data was
already statistically investigated in the 19th cen-
tury (Edgeworth, 1887). Over the years, various
anomaly detection techniques (classification based,
nearest neighbor-based, clustering-based, statistical,
information theoretic and spectral) have been devel-
oped in several research areas, such as intrusion de-
tection, fraud detection, medical anomaly detection,
industrial damage detection, image processing, tex-
tual anomaly detection, and sensor networks) (Chan-
dola et al., 2009).
The utilization of log files for detecting anoma-
lies in IT systems has been examined in several fields,
especially in high-performance computing with their
ten-thousands of nodes (Oliner and Stearley, 2007).
These attempts include the consideration of mes-
sage timing (Liang et al., 2005), data mining ap-
proaches (Ma and Hellerstein, 2002; Stearley, 2004;
Vaarandi, 2004; Oliner et al., 2008), pattern learning
concepts (Hellerstein et al., 2002) or graph-based ap-
proaches (Salfner and Tr
¨
oger, 2012).
To reduce and analyze massive amounts of system
log files, there are different known methods such as
pattern discovery (Hellerstein et al., 2002), data min-
ing (Stearley, 2004), (Vaarandi, 2004), (Yamanishi
and Maruyama, 2005), clustering (Vaarandi, 2003),
support vector machines (Bose and van der Aalst,
2013), (Fronza et al., 2013), decision tree learning
(Reidemeister et al., 2011) or normalization (Cheng
et al., 2015), (Jaeger et al., 2015), (Sapegin et al.,
2013).
2.1 Rough Sets
Our approach for the generation of uncertain logs re-
lies on the larger research field of imperfect knowl-
edge. It is being studied by various sciences.
Philosophers, physicians, logicians, mathematicians
and computer scientists use according mathematical
theories, such as the well-known fuzzy set theory
(Zadeh, 1965) or the Dempster-Shafer theory (Shafer,
1976) for expressing uncertain knowledge.
Our chosen approach was invented by Pawlak
et al. (Pawlak, 1982) and is meanwhile applied in
different domains, such as the prediction of aircraft
component failures (Pena et al., 1999). Unlike with
other theories, no additional or preliminary informa-
tion about data is needed in the rough set theory, such
as probabilities, likelihood assignments or possibility
declarations (Pawlak, 2004).
The starting point for rough sets is the classical
mathematical idea of sets and elements. In standard
school math, each element is part of a set or not. The
research about imperfect knowledge now relaxes this
idea and defines the notion of partial membership of
an element to a set. This is very helpful when dealing
with vague concepts such as human language (‘more
or less a member’) or medical symptoms.
The rough set theory represents any information
set as decision table. The columns represent the at-
tributes (a ∈ A) of the system that can be examined,
the rows are different instances (i ∈ I) of attribute val-
uations that occurred in the system.
Each attribute is either a condition attribute or a
decision attribute. A simple example would be a set
of medical symptoms treated as condition attribute,
while the illness is seen as single decision attribute.
With imperfect knowledge, it may happen that differ-
ent or even contradictory symptoms lead to the same
illness for a set of instances resp. patients. It may also
happen that the same symptoms stand for different ill-
nesses in different rows.
A decision attribute depends entirely on a set of
condition attributes if all decision attribute values are
uniquely described by all condition attribute values.
If only part of the decision attributes can be described
by the condition attributes, the dependency is incom-
plete.
Instances that have the same peculiarities are con-
sidered indiscernible and form equivalence classes
called elementary sets. Through the identification of
elementary sets, information sets can be reduced be-
fore further analysis. This is a time- and memory-
intense algorithmic approach that is not applicable for
log file reduction.
Some instances (rows) in the decision table may
lead to the same value in the decision attribute. This
is called a concept X, f.e. a particular illness. The
lower approximation of X is a subset of instances
which certainly describes the creation of target deci-
sion attribute values. The upper approximation of X
is a subset that describes all possibilities for reaching
the target decision attribute values.
The difference between lower and upper approx-
imation is the boundary region. An empty boundary
region shows that the rough information set is crisp,
meaning that there is no uncertainty in the decision
table for the given decision attributes and that the in-
formation set is exact. In all other cases, the set is
called coarse or rough, and the lower and upper ap-
proximation are unequal (see Figure 1).
ICEIS 2019 - 21st International Conference on Enterprise Information Systems
296
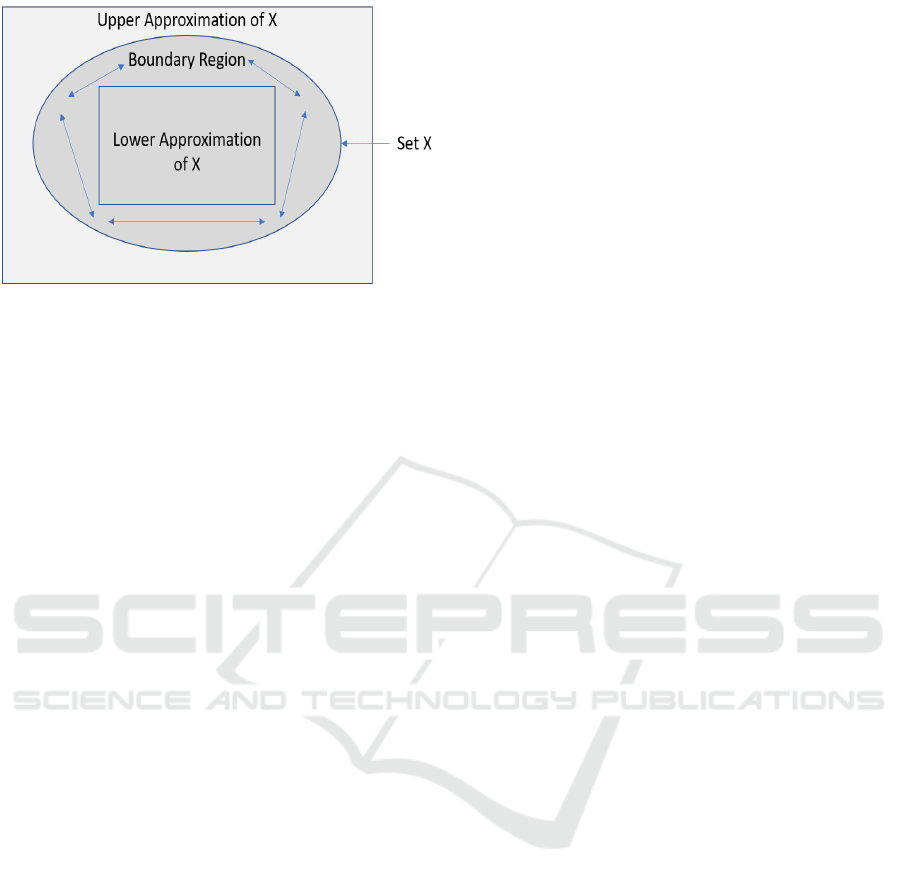
Figure 1: Rough Set.
For a given rough set, it is possible to calculate
the degree of dependency of decision attributes on a
set of condition attributes. This analysis again relies
on the knowledge about lower and upper approxima-
tions. The dependency value, between 0 and 1, de-
scribes the fraction of decision attribute values that
can be properly classified by the condition attribute
values. An attribute dependency of 1 shows that each
decision attribute value is uniquely derivable from
condition attribute values. This particular concept is
the foundation for our rough logs approach.
3 APPROACH
Our approach relies on the idea of treating system log
files as decision table in the sense of the rough set the-
ory. We therefore assume that the different common
attributes in log files, such as timestamps or severity,
have some kind of vague correlation to each other.
One simple example are the log entries for a mail
server that periodically sends a newsletter to a set
of recipients. The contacted target mail servers, the
originating email address and maybe even the time
of sending will surely correlate roughly to each other.
There will be no crisp relationship, since the list of re-
cipients or the time of sending may vary slightly, but
an intentionally imprecise view on the log data may
reveal some truly given connections.
Assuming that some of the attributes are ‘close
enough’ to each other, it can now be decided to re-
move such roughly redundant attributes from the log
data. The motivation for such a data reduction may
be sophisticated anomaly detection techniques, such
as machine learning. The important aspect here is that
our rough logs idea must not be tailored for the kind
of data, since it operates on the symbols that make
up the attribute values only. It is therefore possible
to analyze a given set of log files from any kind of
system for weak attribute dependencies, and remove
redundant information before further processing with
a system-specific anomaly prediction technique.
The approach works as follows:
• Find candidates a ∈ A for condition and decision
attribute combinations, based on the data seman-
tics
• Remove rows with incomplete attribute data
• Perform discretization of continuous values, so
that symbols can be derived
• Determine the lower and upper rough set approx-
imation for each a
• Determine the attribute dependency for each a
• Remove attributes with high dependencies
When the system under investigation has some
regular or even cyclic behavior, it should be possi-
ble to find candidates a with high dependency values
that remains stable over a given investigation period.
For such candidates, it can then be decided to remove
parts of the attributes from the log information set, so
that the amount of data to be used for anomaly detec-
tion becomes significantly smaller.
4 CASE STUDY
We tested the approach with a 10GB data set of log
files from a real-world server network operating in
a security-critical governmental environment. The
servers exchange data internally and maintain proto-
cols of their activity for identifying security incidents.
The protocols span a time period of 11 months and
contain 195.923.988 log entries.
Each entry provides the same set of attributes:
Date, time, sender host, receiver host, type of mes-
sage transfer (action) and message size.
The rough set analysis was performed with the
RoughSets package for System-R, with a custom par-
allelization strategy for reducing the overall run time
of the experiments from days to hours.
4.1 Attribute Dependencies
In a first step, we defined the candidates a ∈ A for
condition and decision attribute combinations in our
use case scenario.
The date and time column can be seen together
as timestamp uniquely identifying each single log en-
try. It is possible to include a timestamp as condi-
tion attribute in candidate tuples. This would allow
to identify time-dependent decision attributes. We
faced, however, the practical problem that 10GB of
Rough Logs: A Data Reduction Approach for Log Files
297

log data are simply too much for any of the exist-
ing rough set analysis implementations. We there-
fore decided to remove the timestamp columns from
the rough set analysis in our case study. Instead, this
information was used to split the log data in chunks
per investigated hour. For each hour in the overall 11
months, we computed the attribute dependencies for
all chosen candidates and were therefore able to see if
the attribute dependencies change over time.
The remaining attributes were sender, receiver, ac-
tion, and size. Based on discussions with the respon-
sible administrators about the system semantics, we
came up with the following candidates for condition
attributes and their dependant decision attribute:
• C 1: action ⇒ receiver
• C 2: sender ⇒ action
• C 3: sender ⇒ receiver
• C 4: action, receiver ⇒ sender
• C 5: sender, action ⇒ receiver
• C 6: sender, receiver ⇒ action
• C 7: sender ⇒ size
• C 8: sender, receiver ⇒ size
• C 9: sender, receiver, action ⇒ size
• C 10: receiver ⇒ size
It must be noted here that this list of investigated
attribute combinations is rather arbitrary, and mainly
reasoned by the computational complexity of rough
set analysis in practice. Given a small enough log set
and enough computational power, it might be com-
pletely feasible to analyze all possible attribute com-
binations, including the ones with multiple decision
attributes, for their attribute dependencies over time.
For all candidates a that included the size attribute,
a conversion of each numerical value to a symbolic
one was needed. This was realized by applying fuzzy
rough set theory for these attribute combinations.
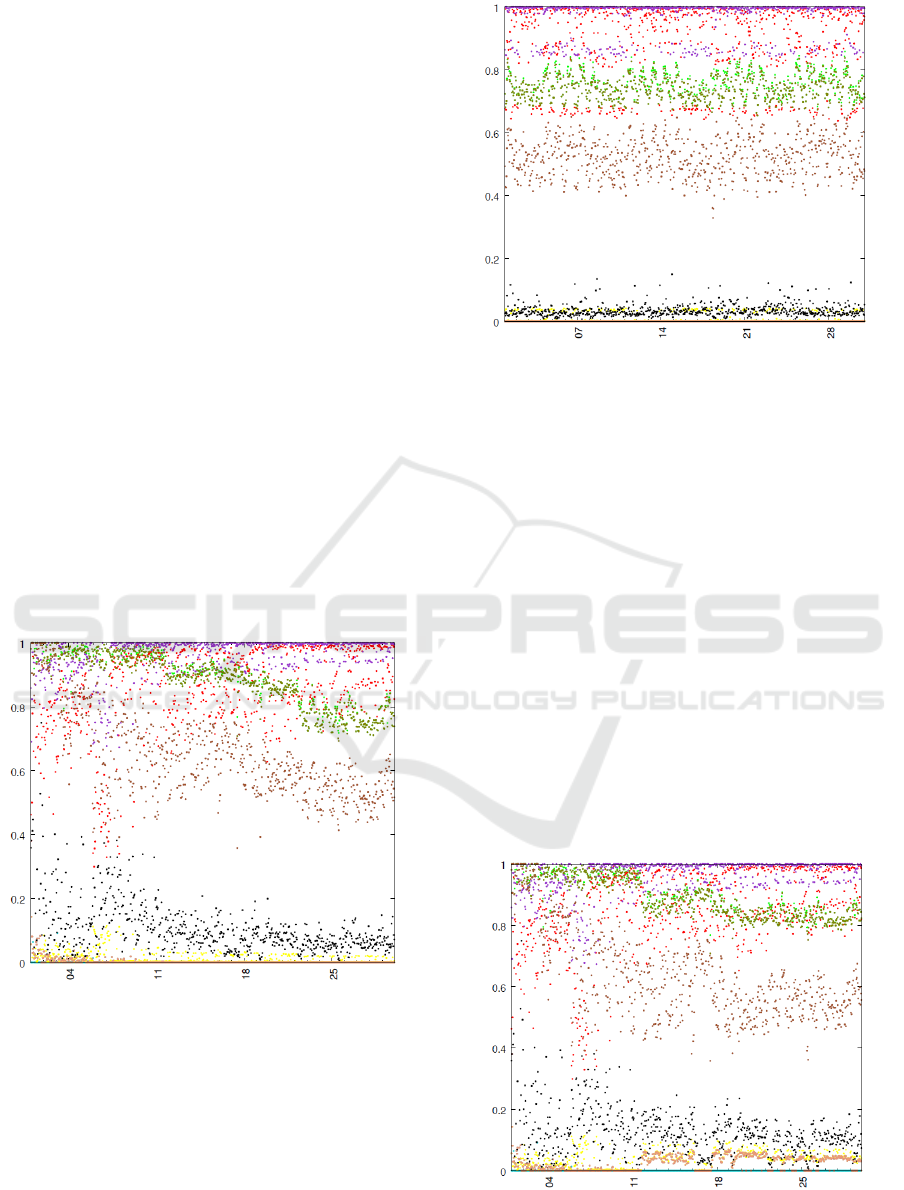
In Figure 2, the dependency values for the differ-
ent attribute combination candidates C1 to C10 are
shown over time.
The numerical results show that for C1, C3, C4,
C5 and C7, nearly no attribute dependency is given,
so they are not removable from the data set. These
are the point clouds in the lower region of Figure 2.
For C10, a medium attribute dependency is given
over time. The mean of the dependence is 0.621, with
a standard deviation of 0.078. In such cases, it de-
pends on the pressure for data reduction if such a de-
pendency value is high enough, for example for re-
moving the receiver information from all the log data.
For the use case study data, we were also able
to identify some high attribute dependencies with the
Figure 2: Attribute dependencies over time.
combinations C2, C6, C8 and C9. In the picture, these
dependencies are plotted in the upper part.
The largest dependencies over time are given for
C6. These have a mean of 0.975 and a standard devi-
ation of 0.043.
For C2, the mean is 0.890 and the standard de-
viation is 0.104. This combination of attributes also
shows a large scatter, the smallest value is 0.299 and
the largest value is 0.998.
The third largest dependency is C9. The mean of
this combination is 0.860 and the standard deviation
is 0.038. The dependency is very constant over the
entire period, only in February, it is a little higher.
Here, the mean is 0.908 and the standard deviation is
0.052.
The investigation of attribute dependencies and
their transitive relationship over the complete year
lead to the conclusion that the combination of sending
and receiving machine is a very good indicator for the
nature of a data transfer, especially with respect to the
kind and amount of data being transfered. It would be
therefore reasonable to leave the size and the action
information out of the log data, since the combina-
tion of sender and receiver information roughly rep-
resents the same amount of information. An anomaly
detection mechanism could focus on these attributes
in combination, while leaving out other parts for im-
proving its own performance.
5 STABILITY WITH ANOMALIES
Given that the original motivation for our work was
the data reduction for online anomaly detection, it be-
comes an interesting question if attribute dependen-
cies change when the log data starts to contain indica-
tions for such a case.
ICEIS 2019 - 21st International Conference on Enterprise Information Systems
298
We created three anomaly (or fault) injection sce-
narios. All three scenarios are coming from real-
world security threats for the system being investi-
gated:
• New message transfers between known sender
and receiver hosts
• New sender or receiver hosts
• Changes in the transfered data amount for existing
connections
We investigated two months, February and April,
with exactly the same analysis approach as above,
but with modified log files that contain the respective
anomaly.
In the first scenario, some data transfers are dupli-
cated by an attacker to collect that data on a compro-
mised single host in the system.
In a first version of this scenario, all outgo-
ing data from one particular host (with arbitrary re-
ceiver) is additionally transfered to a compromised,
but known, second host. With this modification, a to-
tal of 271.576 new log entries were generated.
In the second version of the duplication scenario,
the outgoing data is only copied to the compromised
host when it is intended for a particular receiver. This
modification produced 170.140 new log entries.
Figure 3: Duplication scenario, version 1, February.
The result of the first scenario was that for our use
case data set, the dependencies change either not at
all or only slightly, as shown in Figure 3 and Figure
4. Notable changes are described in Table 1.
In February, the same attribute dependency fluctu-
ations are given as shown in Figure 2 for the unmodi-
fied log data. The dependencies with version 2 of the
duplication scenario are higher that with version 1,
which can be reasoned by the lower amount of addi-
tional connections being created. The overall attribute
Figure 4: Duplication scenario, version 1, April.
dependency picture does not change significantly be-
cause of this kind of anomaly, so any data reduction
decision based on attribute dependencies would still
be feasible.
In the second scenario, we simulated a completely
new node in the system as anomaly. We have selected
a single but frequently used connection between two
machines, and introduced a man-in-the-middle node
that intercepts all the traffic. In total, this modification
replaced 206,332 log entries with two new entries.
It must be noted here that the presence of mali-
cious new nodes in log files might not be realistic in
all practical systems. One could assume here that
the investigated log files are coming from Layer 7
switches, which would indeed report new intermedi-
ate nodes as part of their logging activities.
The result of this scenario are nearly the same as in
the first one. The dependencies change either a little
bit or not at all. Figure 5 and Figure 6 visualize the
results, notable changes are given in Table 2.
Figure 5: New node scenario, February.
The modification had even less effect on the de-
Rough Logs: A Data Reduction Approach for Log Files
299
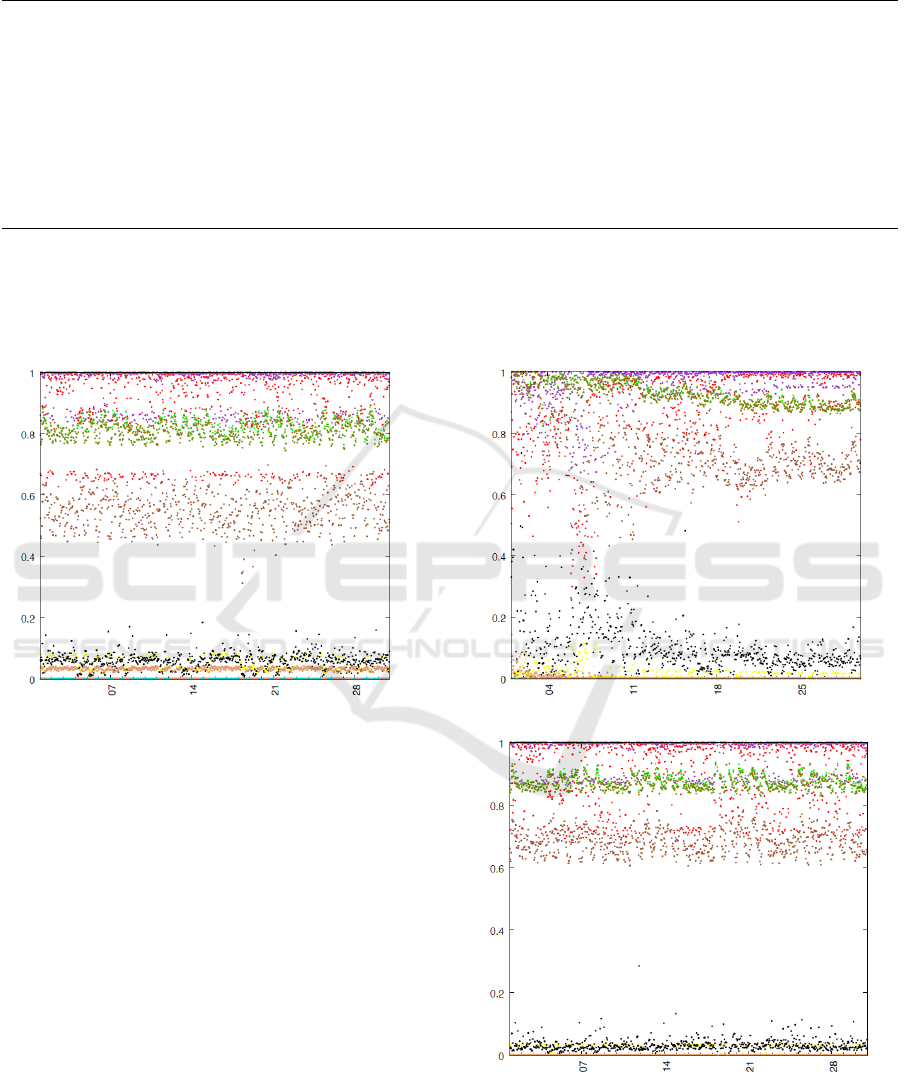
Table 1: Average attribute dependency in the duplication scenario.
Time Span from, target ⇒ size from, target, action ⇒ size target ⇒ size
Full year, unmodified 0,855 0,860 0,621
February, unmodified 0,904 0,908 0,666
February, variant 1 0,881 0,884 0,647
February, variant 2 0,889 0,892 0,654
April, unmodified 0,830 0,835 0,596
April, variant 1 0,741 0,746 0,521
April, variant 2 0,771 0,775 0,547
Table 2: Average attribute dependency in the new node scenario.
Time Span from, target ⇒ size from, target, action ⇒ size target ⇒ size
Full year, unmodified 0,855 0,860 0,621
February, unmodified 0,904 0,908 0,666
February, modified 0,888 0,891 0,631
April, unmodified 0,830 0,835 0,596
April, modified 0,808 0,813 0,550
Figure 6: New node scenario, April.
pendencies than anomaly scenario 1.
In the third scenario, we have changed the amount
of transfered data for existing data connections at ir-
regular intervals. This is intended to simulate some
piggyback attack, where a malicious intruder smug-
gles data out of the system by using existing data con-
nections.
To emulate this scenario, we generated modified
log data by randomly changing the amount of data
being transferred, by a factor between 1.5 and 5.0, for
five chosen combinations of sender and receiver hosts.
This lead to the modification of 496.444 log entries.
The result of this scenario is that with increas-
ing message sizes, the dependencies that incorporate
a size attribute become slightly higher than the ones
from the original data. This can be seen in Figure 7
and Figure 8. The dependencies originally located in
the lower areas rose a little, the medium dependen-
cies increased more significantly. Notable changes
are also given in Table 3.
Figure 7: Data size scenario, February.
Figure 8: Data size scenario, April.
Scenario 3 showed that changes in the message
size had an impact on the attribute dependency, but
only to an extend that did not impact the separation
between high, middle, and low dependency attribute
ICEIS 2019 - 21st International Conference on Enterprise Information Systems
300

Table 3: Average attribute dependency in the data size scenario.
Time Span from, target ⇒ size from, target, action ⇒ size target ⇒ size
Full year 0,855 0,860 0,621
February original 0,904 0,908 0,666
February modified 0,928 0,930 0,725
April original 0,830 0,835 0,596
April modified 0,869 0,872 0,683
combinations. We therefore conclude that for all three
investigated anomaly scenarios, a choice for attribute
removal based on the rough set analysis would have
not interfered with anomalies being given in the sys-
tem.
6 CONCLUSION AND FUTURE
WORK
We present rough logs, a concept for reducing log data
(factor 1 : 10, 000) used by large scale anomaly detec-
tion facilities. Our exhaustive tests with a real-world
data set showed that the proposed method gives a sta-
ble indication about which attribute in log data are
most likely to be redundant. This even holds when
the data starts to contain signs of a system anomaly.
Given this stability, it seems to be save to remove
attributes from the high dependency class in online
anomaly detection approaches, since they provide no
benefit for the representation of system behavior.
The advantage of the proposed method lays in its
generality. Due to the sound theoretical foundation,
it can be applied to any kind of system event proto-
col that boils down to attributes and their symbolic
values. The semantics of the system are only rele-
vant once, for choosing candidate attribute combina-
tions to be tested for their dependency. After that, the
whole approach is data-agnostic.
The experimental results are most likely to change
when the amount and kind of original log data
changes. It would be therefore interesting to perform
the same kind of use case study with other sets of log
data.
Depending on the nature of the data, it may also be
possible to use the rough logs idea as direct anomaly
detection approach. The underlying assumption here
would be that attribute dependencies may change sig-
nificantly when the system anomaly is impacting the
log data strong enough. In this case, it would be pos-
sible to treat a change in attribute dependencies as
warning sign for structural problems in the system,
maybe due to security or availability incidents. We
plan to investigate this possibility in our future work,
by investigating more anomaly scenarios and differ-
ent log data sets.
REFERENCES
Bose, R. P. J. C. and van der Aalst, W. M. P. (2013). Dis-
covering signature patterns from event logs. In IEEE
Symposium on Computational Intelligence and Data
Mining, CIDM 2013, Singapore, 16-19 April, 2013,
pages 111–118.
Chandola, V., Banerjee, A., and Kumar, V. (2009).
Anomaly detection: A survey. ACM Comput. Surv.,
41(3):15:1–15:58.
Cheng, F., Sapegin, A., Gawron, M., and Meinel, C. (2015).
Analyzing boundary device logs on the in-memory
platform. In 17th IEEE International Conference on
High Performance Computing and Communications,
HPCC 2015, 7th IEEE International Symposium on
Cyberspace Safety and Security, CSS 2015, and 12th
IEEE International Conference on Embedded Soft-
ware and Systems, ICESS 2015, New York, NY, USA,
August 24-26, 2015, pages 1367–1372. IEEE.
Edgeworth, F. (1887). Xli. on discordant observations. The
London, Edinburgh, and Dublin Philosophical Maga-
zine and Journal of Science, 23(143):364–375.
Fronza, I., Sillitti, A., Succi, G., Terho, M., and Vlasenko,
J. (2013). Failure prediction based on log files using
random indexing and support vector machines. Jour-
nal of Systems and Software, 86(1):2–11.
Hellerstein, J. L., Ma, S., and Perng, C. (2002). Discov-
ering actionable patterns in event data. IBM Systems
Journal, 41(3):475–493.
Jaeger, D., Azodi, A., Cheng, F., and Meinel, C.
(2015). Normalizing security events with a hierar-
chical knowledge base. In WISTP, volume 9311 of
Lecture Notes in Computer Science, pages 237–248.
Springer.
Liang, Y., Zhang, Y., Sivasubramaniam, A., Sahoo, R. K.,
Moreira, J., and Gupta, M. (2005). Filtering fail-
ure logs for a bluegene/l prototype. In 2005 Inter-
national Conference on Dependable Systems and Net-
works (DSN’05), pages 476–485.
Ma, S. and Hellerstein, J. L. (2002). Mining Partially Pe-
riodic Patterns With Unknown Periods From Event
Stream. In Chen, D. and Cheng, X., editors, Pat-
tern Recognition and String Matching, pages 353–
377. Springer US, Boston, MA.
Oliner, A. and Stearley, J. (2007). What Supercomputers
Say: A Study of Five System Logs. In IEEE Proceed-
ings of International Conference on Dependable Sys-
Rough Logs: A Data Reduction Approach for Log Files
301

tems and Networks (DSN’07), pages 575–584. IEEE
Computer Society.
Oliner, A. J., Aiken, A., and Stearley, J. (2008). Alert De-
tection in System Logs. In Eighth IEEE International
Conference on Data Mining, pages 959–964.
Pawlak, Z. (1982). Rough sets. International Journal of
Parallel Programming, 11(5):341–356.
Pawlak, Z. (2004). Some issues on rough sets. Springer,
pages 1–58.
Pena, J. M., L
´
etourneau, S., and Famili, F. (1999). Appli-
cation of Rough Sets Algorithms to Prediction of Air-
craft Component Failure. In Advances in Intelligent
Data Analysis: Third International Symposium (IDA-
99), volume 1642 of LNCS. Springer Verlag, Amster-
dam, The Netherlands.
Reidemeister, T., Jiang, M., and Ward, P. A. S. (2011). Min-
ing unstructured log files for recurrent fault diagnosis.
In Proceedings of the 12th IFIP/IEEE International
Symposium on Integrated Network Management, IM
2011, Dublin, Ireland, 23-27 May 2011, pages 377–
384. IEEE.
Salfner, F. and Tr
¨
oger, P. (2012). Predicting Cloud Failures
Based on Anomaly Signal Spreading. In 42nd Annual
IEEE/IFIP International Conference on Dependable
Systems and Networks, Boston.
Sapegin, A., Jaeger, D., Azodi, A., Gawron, M., Cheng, F.,
and Meinel, C. (2013). Hierarchical object log format
for normalisation of security events. In IAS, pages 25–
30. IEEE.
Shafer, G. (1976). A Mathematical Theory of Evidence.
Princeton University Press.
Stearley, J. (2004). Towards informatic analysis of syslogs.
In 2004 IEEE International Conference on Cluster
Computing (CLUSTER 2004), September 20-23 2004,
San Diego, California, USA, pages 309–318.
Vaarandi, R. (2003). A data clustering algorithm for mining
patterns from event logs. In in IEEE IPOM’03 Pro-
ceedings, pages 119–126. IEEE.
Vaarandi, R. (2004). A breadth-first algorithm for min-
ing frequent patterns from event logs. In Intelligence
in Communication Systems, IFIP International Con-
ference, INTELLCOMM 2004, Bangkok, Thailand,
November 23-26, 2004, Proceedings, pages 293–308.
Yamanishi, K. and Maruyama, Y. (2005). Dynamic sys-
log mining for network failure monitoring. In Pro-
ceedings of the Eleventh ACM SIGKDD International
Conference on Knowledge Discovery in Data Min-
ing, KDD ’05, pages 499–508, New York, NY, USA.
ACM.
Zadeh, L. A. (1965). Fuzzy sets. Information and Control,
8(3):338–353.
ICEIS 2019 - 21st International Conference on Enterprise Information Systems
302
