
An Evaluation Model for Dynamic Motivational Analysis
Aluizio Haendchen Filho
1,2
, Simone Sartori
2
, Hércules Antônio do Prado
3
, Edilson Ferneda
3
and Paulo Ivo Koehntopp
4
1
Laboratory of Applied Intelligence, University of the Itajaí Valley (UNIVALI), Rua Uruguay, 458, Itajaí, Brazil
2
University Center of Brusque (UNIFEBE), Brusque, Brazil
3
Catholic University of Brasilia (UCB), Brasilia, Brazil
4
Catarinense Association of Educational Foundations (ACAFE), Florianópolis, Brazil
pauloivo@uol.com.br
Keywords: Dynamic Motivational Analysis, Herzberg Theory, Decision-making, Human Resources, Sentiment Analysis.
Abstract: In the past decades, a significant number of researches have sought to determine which factors make a worker
satisfied and productive. Currently, there are intensive efforts to develop efficient systems for motivational
analysis and performance evaluation. Current approaches of measuring motivation are very focused on
questionnaires and periodic interviews. These periods are most often greater than 6 months, and in most cases
performed annually. With today's communication dynamics, employees can be influenced at any time by
external factors of market supply and demand, as well as communications with peers and colleagues in the
device mesh. It is becoming increasingly important to obtain real-time information to take preventive or
corrective measures in a timely manner. This paper proposes a framework for real-time motivational analysis
using artificial intelligence techniques in order to evaluate employee’ motivation at work. The motivation is
evaluated from different groups of indicators: a static and periodic group (interviews and questionnaires), and
two other dynamic groups that collect information in real time. With the results generated by the system, it is
possible to make important decisions, such as understanding the emotional interactions among employees,
improving working conditions, identifying indicators of dissatisfaction and lack of motivation, encouraging
promotions, salary adjustments and other situations.
1 INTRODUCTION
Organizational motivation is a continuous field of
research, given its professional, technical and
personal relevance. There are several criteria that
influence the motivation of employees, including
relations with the leader, working conditions, safety,
personal life, recognition, professional growth,
salary, and benefits. In order to evaluate such criteria,
it is necessary and appropriate to provide a
heterogeneous structure adapted to different
motivational dimensions.
In the past decades, a significant number of
researches have sought to determine which factors
make a worker satisfied and productive, as opposed
to those factors that lead to dissatisfaction and poor
performance (Tay and Diener, 2011; Matei and
Abrudan, 2016; Alharthi et al., 2017 ). The two most
prominent authors in this subject are Frederick
Herzberg and Abraham Maslow. Maslow published
the hierarchy of needs (Maslow, 1943), while
Herzberg developed the theory of the two factors -
hygienic and motivational (Herzberg, 1971).
Motivation is the best potential source of increased
productivity. Thus, employee capabilities will be best
used, leading to job satisfaction and improved
productivity.
Efforts have been made to identify motivational
factors or sentiments based on the support of
Artificial Intelligence (AI) techniques (Toy, 2014,
Medhat, Hassan and Korashy, 2014, Chumkamon,
Masato and Hayashi, 2015), but they are not enough
to provide effective solutions to this matter.
Developers of AI systems turn to the capability of
researchers in achieving goals, performing tasks or
solving problems. This is perhaps more meaningful
than the motivational aspects of the systems (Kelley
and Waser, 2018).
Current approaches of measuring motivation are
very focused on questionnaires and periodic
446
Filho, A., Sartori, S., Antônio do Prado, H., Ferneda, E. and Koehntopp, P.
An Evaluation Model for Dynamic Motivational Analysis.
DOI: 10.5220/0007744304460453
In Proceedings of the 21st International Conference on Enterprise Information Systems (ICEIS 2019), pages 446-453
ISBN: 978-989-758-372-8
Copyright
c
2019 by SCITEPRESS – Science and Technology Publications, Lda. All rights reserved

interviews. These periods are most often greater than
6 months, and in most cases performed annually.
With today's communication dynamics, employees
can be influenced at any time by external factors of
market supply and demand, as well as
communications with peers and colleagues in the
device mesh. It is becoming increasingly important to
obtain real-time information to take preventive or
corrective measures in a timely manner. On the other
hand, interview responses and questionnaires do not
always faithfully reflect the degree of satisfaction or
dissatisfaction of employees, who often prefer not to
expose their real sentiments.
This paper proposes a conceptual framework for
real-time motivational analysis using artificial
intelligence techniques in order to evaluate
employee’ motivation at work. The motivation is
evaluated from different groups of indicators: a static
and periodic group (interviews and questionnaires),
and two other dynamic groups that collect
information in real time.
2 RELATED WORKS
We reviewed the literature related motivational
analysis using artificial intelligence techniques,
especially the analysis of sentiments and natural
language processing. We found four scientific articles
which deserve to be highlighted.
The first one presented by Tay and Diner (2011)
analyses a sample from 123 countries. It evaluates the
correlation between the fulfilment of necessities
(Maslow, Deci and Ryan, Ryff and Keyes theories)
and subjective well-being, including life assessment
of positive and negative sentiments. Within the
various cultures studied, using statistical analysis and
regression techniques, they found that the attendance
of the psychosocial needs is adherent to the
conditions of the country. On the other hand,
fulfilment of basic and security needs is not
associated with the conditions of the country.
The second article described by Akdemir and
Arslan (2013) focused to measure of teacher
motivation. For this, they constructed a set of 51
attributes based on the motivational and hygienic
factors of Herzberg. These attributes were evaluated
using a five-point scale (none, small, moderate, very,
and completely). In addition, as a pilot test, the scale
was applied to 150 teachers from different areas of
Zonguldak Province, Turkey. In order to evaluate the
data, the authors used factorial analysis, correlation
tests, and data normalization. The results indicated a
reliable and valid motivational scale that can be used
to measure teacher motivation in four dimensions:
communication, professional growth, institutional
progress and expectations.
In the study published by Medhat, Hassan and
Korashy (2014), the objective was to provide an
overview on algorithms and applications used for the
analysis of sentiments. These was described in 54
recently published articles (2010 to 2013) on this
subject. The authors emphasize that the sentiment
classification algorithms and features selection
techniques are still research fields to be explored. On
the other hand, Naive Bayes and Support Vector
Machines are Machine Learning approach algorithms
most frequently used to solve problems related to
sentiment classification. The main source is the
lexicon WordNet which is available in several
languages besides English.
In the Ravi and Ravi (2015) paper, the authors
worked on opinion mining in 160 papers published
between 2002 and 2015. They used approaches and
applications commonly required for the analysis of
sentiments. The research is organized based on sub-
tasks to be performed, machine learning and natural
language processing techniques. In the literature
review carried out by the authors, seven dimensions
were analysed: subjective classification, sentiment
classification, measurement review utility, lexical
creation, opinion word and aspect of product
extraction, opinion spam detection and several
opinion mining applications. In addition, the
identified approaches involved lexical-based machine
learning, hybrid approaches, ontologies-based
approaches and non-ontologies (considered for
lexical creation and feature extraction).
Considering the above, it was noticed that the
studies analysed aspects related to motivational
analysis from artificial intelligence techniques,
especially analysis of sentiments and natural
language (Akdemir and Arslan 2013, Ravi and Ravi
2015). However, it should be noted that the study by
Ravi and Ravi (2015) deals with a bibliographic
review, whereas the study by Akdemir and Arslan
(2013) uses an approach to analyse the motivation of
teachers in the academic context.
3 PROPOSED APPROACH
In this study we sought to analyse motivation in the
business context. Our approach considers, besides the
commonly used questionnaires, different sources to
obtain information related to motivation of the
employees.
An Evaluation Model for Dynamic Motivational Analysis
447

In order to obtain the indicators of motivation, the
main source was Herzberg's two-factor theory and a
brief description of the indicators used in the theory.
Next, we present the data sources used to input the
quantitative and qualitative values of the indicators.
These data sources include the traditional 360-degree
evaluation questionnaires, data obtained from the
Human Resources transactional systems, external
information about the job market, and the main data
sources accessed to obtain the information to perform
the sentiment analysis.
3.1 Herzberg's Two-factor Theory
Indicators
As previously cited, this theory postulates that there
are two groups of factors: hygienic factors and
motivational factors. The first group (extrinsic) is
formed by external elements capable of influencing
people's dissatisfaction but does not guarantee
satisfaction. The second group (intrinsic) elevates the
self-image about the capacity for achievement, thus
promoting motivation.
Absence of hygienic factors creates
dissatisfaction, but their presence will not necessarily
create satisfaction. On the other hand, absence of
motivator factors does not imply dissatisfaction, but
their presence will create satisfaction (Shen and Yu,
2009). Therefore, the two-factor theory considers that
the presence of motivation factors will lead to
satisfaction, while hygienic factors should avoid
dissatisfaction.
A summary of each of the motivation indicators
described by Herzberg (Ruthankoon 2003, apud
Haruna 2013, p.5), is as follows:
Achievement. An example of positive
achievement might be of an employee who
completes a task or project before the deadline and
receives high reviews, increasing his satisfaction.
However, if that same individual is unable to
finish the project in time or feels rushed and is
unable to do the job well, the satisfaction level
may decrease.
Recognition. When the employee receives the
acknowledgement, he deserves a complimentary
for a well-done job, and the satisfaction will
increase. If the employee’s work is overlooked or
criticized, it will have the opposite effect.
Work Itself. This involves the employee’s
perception of whether the work is too difficult or
challenging, too easy, boring or interesting.
Responsibility. Is the degree of freedom an
employee has to take his/her own decision and
implement his/her ideas. The more liberty he has
on that responsibility, the more inclined the
employee is to work harder on a project and
increase his satisfaction with the result.
Advancement. This refers to the expected or
unexpected possibility of promotion. An example
of negative advancement would be if an employee
did not receive an expected promotion.
Possibility of Growth. This includes the chance
one might have for advancement within the
company. This could also include the opportunity
to learn a new skill. This could have a negative
effect on the satisfaction the employee feels with
his job and position.
The following are the hygienic indicators, which
work in the same way with positive or negative
attributes. However, these factors can only have an
effect on dissatisfaction.
Company Policy or Administration. The
employee’s perception of whether the policies in
place are good, bad, fair or not, may change the
level of dissatisfaction.
Personal or Working Relationships. This
indicator refers to relationship of the employee
with his supervisors, his peers, as well as his
subordinates. The way someone feels about
interactions and discussions that take place within
the work environment can also affect satisfaction.
Salary. This factor is straightforward. Increase or
decrease in wages has a great impact on
satisfaction or dissatisfaction.
Personal Life. Although people try to separate
work from personal life, it is inevitable that one
will affect the other.
Feeling of Job Security. This is a significant
factor. The sense of job security in the company,
as well as a position within the organization is
very important regarding the level of satisfaction.
According to Lundberg et al. (2009), to achieve
employee’s motivation, managers must give
responsibilities to their employees and create
platforms for feedback.
3.2 Data Sources for Indicator
Quantification
The three main sources for obtaining data for the
quantification of indicators are: (i) 360º evaluation;
(ii) data sources of the human resources department;
and (iii) data collected from social networks and
communication channels.
ICEIS 2019 - 21st International Conference on Enterprise Information Systems
448
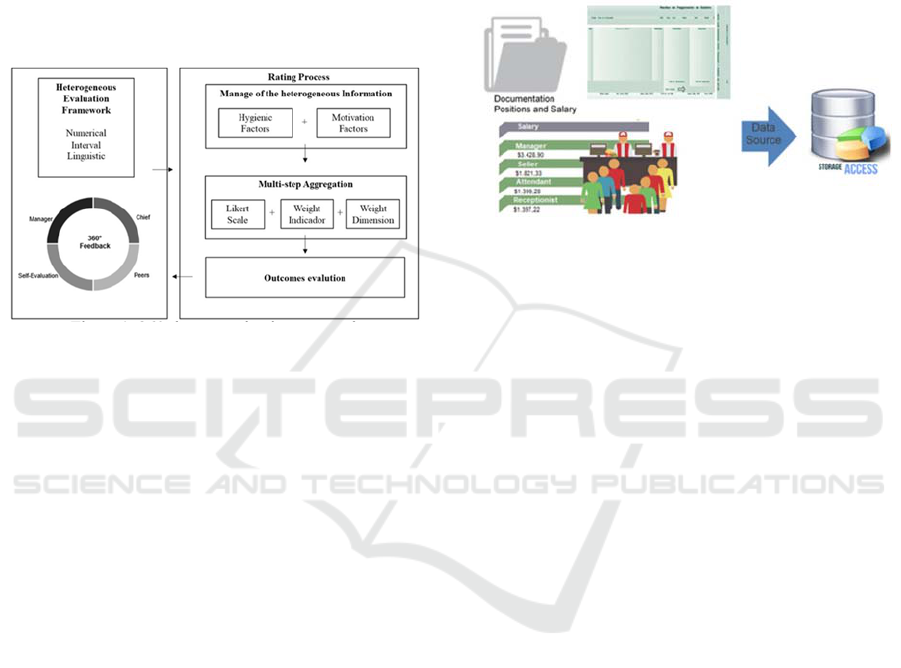
3.2.1 360-degree Evaluation
Modern evaluation systems include a more balanced
and holistic approach, conveying the performance of
everyone in the organization. This proposal provides
a flexible 360-degree evaluation framework where
executives, managers and employees (with peer
review) can express their judgments in different
domains. The results can be expressed linguistically,
numerically or in intervals. Figure 1 (adapted from
Espinilla et al. 2013) presents the proposed 360-
degree assessment.
Figure 1: 360-degree evaluation proposal.
Sources of information work with hygienic and
motivational factors, which together lead to the
aggregation of results. That is, the result of the
evaluation process occurs after the aggregation of the
indicators on a Likert scale, given the importance
attributed to the indicator and to the dimension.
Therefore, the evaluation considers the interaction
between the evaluated criteria, its relevance and the
importance of all of those involved in the process.
3.2.2 Human Resources ERPs
The main data to be obtained from the Human
Resources are the hygienic and motivational
indicators, which include the following: (i) Position;
(ii) Salary; (iii) Health / Insurance Plan; (iv) faults and
delays; (v) medical absence.
Such data can normally be obtained in ERP
systems. For the purpose of motivational analysis, the
ideal is to organize this data in specific files, so that
they can generate information about the hygienic and
motivational factors. Historical data from employees’
such as positions held over time, salary changes,
awards, faults and delays can be stored and updated
regularly, thus becoming a valuable source for
motivational analysis.
Figure 2 presents some complementary data, such
as information about salary paid in the market, based
on the Brazilian Occupation Code. In addition to this
data, other information can be obtained from the
controls of HR and external sources. As above
mentioned, ideally, this information should be
organized in a DataMart, where the load with
updating of the data is regularly done. The HR
Department can provide information about the
employee profile, salary history and attendance,
opportunities for promotion, policies and benefits,
among others.
Figure 2: Data sources from HR Department.
Existing methods range from machine learning
methods, exploiting patterns in vector representations
of text for lexicon-based methods. This is done taking
into account the semantic orientation of individual
words. These words are matched with a sentiment
lexicon, extracting their associated sentiment.
With this information it is possible to check the
history of positions held, salary increases, received
awards, attributed responsibilities during the career,
salary positioning in relation to job market, among
other indicators.
3.2.3 Analysis of Sentiments
In order to use analysis of sentiments, it is important
to identify the domain related to the text. For
example, to perform analysis of sentiments related to
indicators such as Company Policy and Management,
Relationship with the Chief, Work Conditions, and so
on, it is first necessary to identify the domain relates
to such indicators. This can be done using Latent
Semantic Analysis (LSA) techniques. In this way it is
possible to identify the domain and to carry out
analysis of sentiments, selecting the word sense with
the highest semantic similarity to the context.
The techniques are applied in two phases: pre-
processing and processing. In the first one, the
algorithm changes text words to lowercase and
performs removal of accents. In the second one,
stopwords removal techniques and lemmatization is
applied.
Figure 3 (adapted from Hogenboom et al., 2013)
shows a schematic view of the analysis of sentiments
An Evaluation Model for Dynamic Motivational Analysis
449
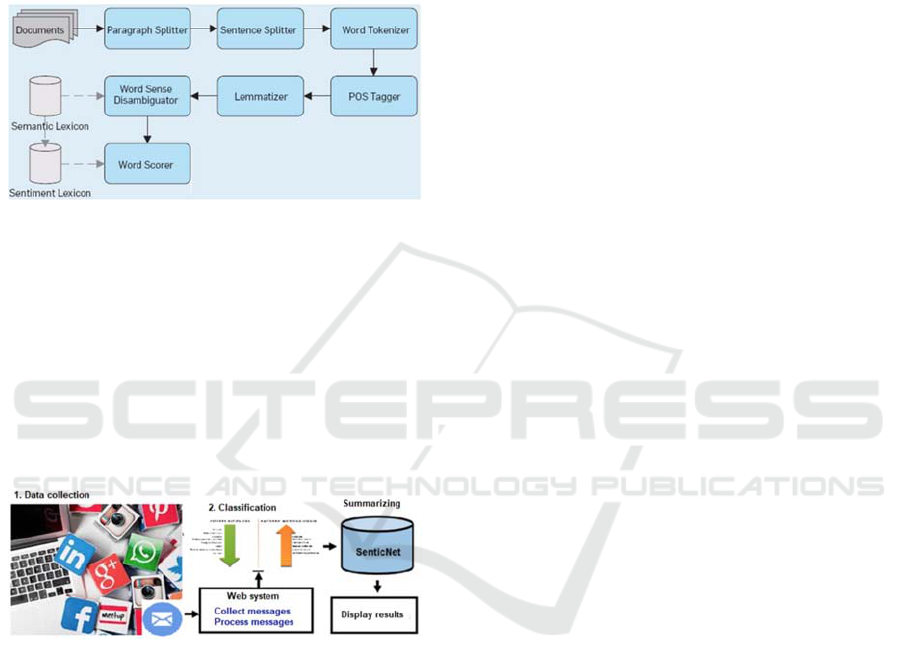
from input documents, and returns results based on
word scoring. The presented method first splits a
document into paragraphs, sentences, and words
using n-grams techniques. Then, for each sentence,
the Part-of-Speech (POS) and lemma of each word is
determined. In lemmatization, text words are reduced
to their radical, eliminating effects of verbal times in
sentiment interpretation, as well as gender and
number variations.
Figure 3: Schematic view of sentiments analysis.
The word sense is subsequently disambiguated using
an unsupervised algorithm. It iteratively selects the word
sense with the highest semantic similarity to the word’s
context. The sentiment of each word, associated with its
particular combination of POS, lemma, and word sense,
is then retrieved from a sentiment lexicon like
SentiWordNet.
Figure 4 presents analysis of sentiments, showing
part of data collection, classification, summary and
results.
Figure 4: Collect and process data for the analysis of
feelings.
This data can be collected from social networks
such as Twitter, LinkedIn, Facebook, Instagram (as
long as the data is public). Social networking sites are
considered a good source of information because
people freely share and discuss their opinions on a
given topic. Such information can be positive,
negative or neutral, as well as portraying happiness,
well-being, sadness, bipolarity, among other
motivational characteristics.
In order to obtain a good analysis, it is necessary
to use the sentence level or keywords, with the
purpose of classifying the domain of sentiment
expressed in each sentence.
4 EVALUATION MODEL
The objective of the proposed approach is to provide
information about the work as a whole in order to
obtain a balanced and holistic view of motivational
evaluation. For dynamic motivational analysis, we
create a framework composed by three dimensions:
i. 360-degree Evaluation. The enquiry will be
conducted through the use of questionnaires. The
objective of this process is to obtain an evaluation
of each employee in relation to the organization as
a whole.
ii. Human Resources. The results of the model will
indicate different dimensions of employees’
motivation with a direct influence on increasing
human resources performance.
iii. Sentiment Analysis. Data collected from social
networks and communication channels for
analysis of sentiments. Here, we want to analyze
sentiments related to indicators such as company
policy, relationship with the chief, work
conditions, and so on.
4.1 Indicators Evaluation
The evaluation of the indicators considers the Likert
scale of five points: (5) excellent, (4) good, (3)
neutral, (2) poor and, (1) bad. Thus, response to
higher levels corresponds to greater satisfaction with
the organization or the indicator, or even one area
compared to another. For each indicator, a weighting
factor can be used when assigning a given
quantitative value.
Some methods of weighting are derived from
statistical models such as factor analysis, data
development analysis and unobserved component
models (UCM). Budget allocation processes (BAP),
analytic hierarchy processes (AHP), and conjoint
analysis (CA) (OECD, 2008) are other methods.
Regardless of the method used, weight is an
essentially valuable judgment.
This research proposes the use of the linear
aggregation method, in which the value attributed to
the indicator by the Likert scale is multiplied by the
respective weight, thus obtaining the relative
importance of the indicator within the analysis set.
In addition to analysing indicators individually,
organizations can use statistical models such as
Principal Component Analysis (PCA) or Factor
Analysis. In this way, it is possible to group
individual indicators according to their degree of
correlation, and then proceed with correlation
analysis of indicators.
ICEIS 2019 - 21st International Conference on Enterprise Information Systems
450
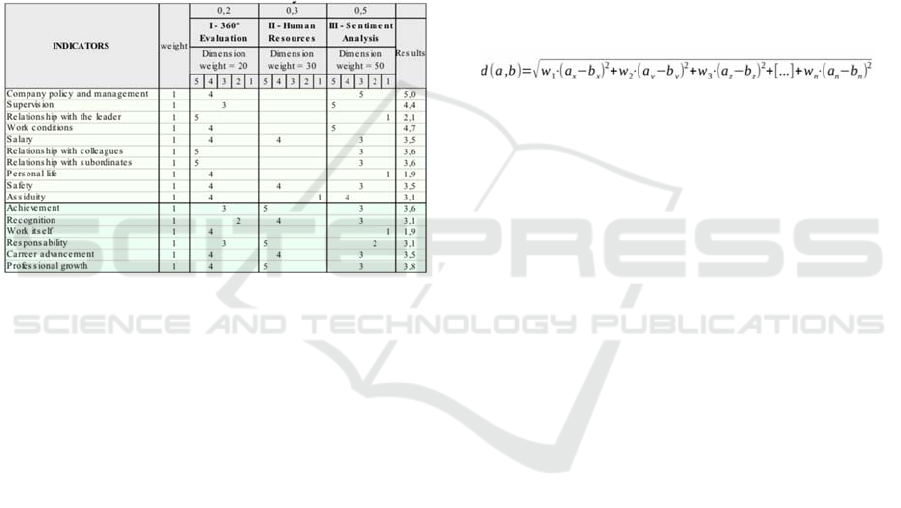
Table 1 shows the three-dimensional framework.
Data were considered to be fictitious of the evaluation
result for an employee. The approach uses a set of
indicators that are punctuated in a three-dimensional
framework, considering a dynamic system of
assigning vertical and horizontal weights. The table
identifies the two main categories of indicators,
according to Herzberg's Two Factor Theory.
Table lines show the indicators, which are scored
in each of the three dimensions according to the
Likert scale. The indicators that correspond to the
hygienic factors in Herzberg's theory are located in
the top of the table, while the motivational indicators
are at the bottom in darker tones.
Table 1: Three-dimensional matrix for dynamic evaluation.
In the example, weights can be assigned to the
indicators (column 3). Therefore, the calculation to
find the degree of motivation will depend on the
situation of the employee in relation to each indicator
plus its development in every dimension. In addition,
some indicators do not have data (supervision,
Relationship with the leader, colleagues and
subordinators, work itself, and so on), because these
data is not obtainable in the Human Resource
dimension. The last column shows the resultant score
after the calculation and weighting of the horizontal
and vertical weights.
The company can choose a weight of 1, 2 or 3 for
each indicator (in the example, a default value of 1 is
shown). The same can be used for the dimension’s
evaluation. For example, in the Dimension 360
degree a weight of 20 was assigned. The dimensions
Human Resources and Analysis of Sentiments
received weight 30 and 50, respectively.
The weights can be changed (that is, they are
variable) according the company`s external or
internal factors. External factors refer to the supply
and demand of labor, the economic context (inflation,
exchange rate, employment level, exports) and so on.
4.2 Clusters Identification
The results obtained in the evaluation of the
indicators will be used to identify clusters. Among
similarity metrics, Euclidean distance is one of the
most commonly used (Carvalho et al. 2006).
According to Moita Neto and Moita (1997), in cluster
analysis the similarity between two samples can be
expressed as a function of the distance between the
two points represented in n-dimensional space. The
most usual way of calculating the distance between
two points a and b in the n-dimensional space is
known as the Euclidean distance.
According to Kaufman and Rosseeuw (2009),
Euclidean distance is the most common metric and
can be combined with weights in the variables,
depending on the importance of each attribute in the
description of an object. The formula is as follows:
(1)
Where:
• d (a, b) = similarity metric between object "a" and
object "b", where the closest to 0, the more similar the
objects;
• w = weight of each attribute;
• ax = attribute value x, from object a, on the x-axis;
• bx = attribute value x, of object b, on the x-axis
In the problem proposed for this work, an
employee is a point on the n-dimensional Cartesian
plane, he/she is represented by: a = {x, y, z, ..., n},
that is, each plane (x, y, z, ..., n) represents an attribute
of the Herzberg factor (ex. Realization, Recognition).
The distance will always be calculated between two
employees, so that the closest to 0 score, the more
similar is the motivation degree among then.
5 RESULTS OVERWIEW
The graphical user interface applied to present the
results is based on the calculation and presentation of
clusters for an overview. It is possible to visualize the
motivational score of a employee, a department, or a
section, using drill-down techniques.
In the context of this work, clusters are formed by
employees who obtained similar indices, as shown in
Figure 5. The vertical axis represents the number of
employees, while the horizontal axis represents the
degree of motivation resulting from the matrix. The
points in the graphic represent the scores presented in
the Results column in Table 1.
An Evaluation Model for Dynamic Motivational Analysis
451
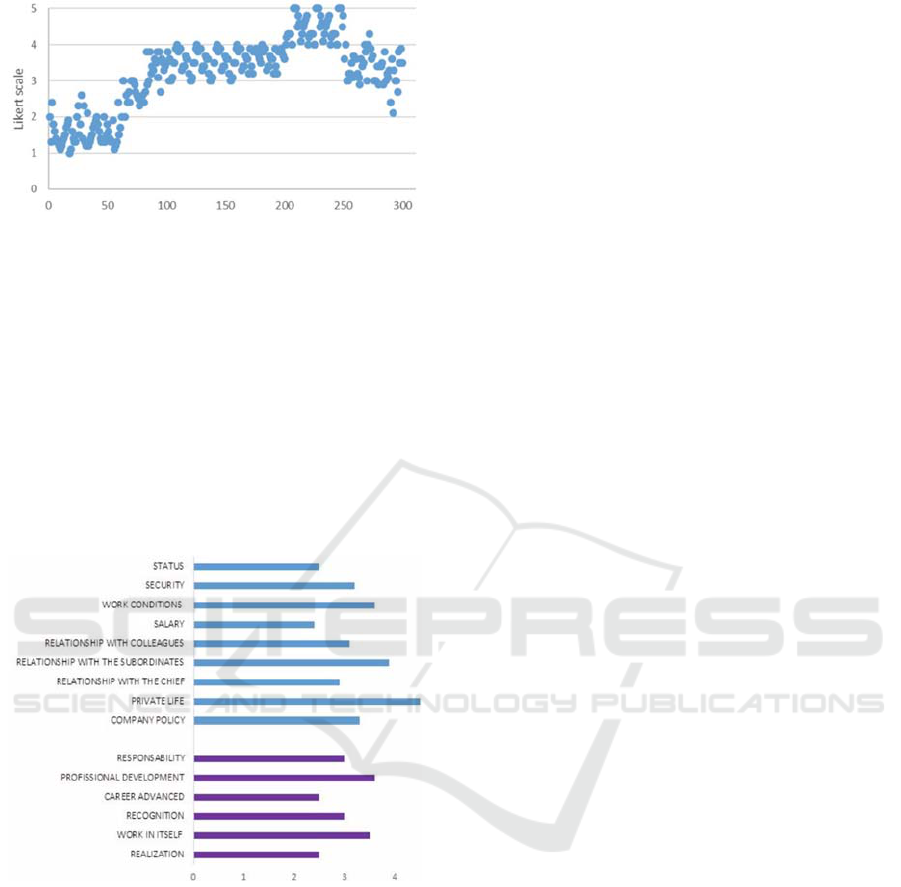
Figure 5: Presentation of results in clusters.
Each point presented in Figure 5 refers to the
degree of motivation of each employee. As can be
seen, about 25% of the employees are poorly
motivated (ranging from 1 to 2.9 on the Likert scale);
60% are motivated (ranging from 3 to 4 on the Likert
scale), and 15% are highly motivated (ranging from
4.1 to 5 on the Likert scale).
Figure 6 shows details of the drill-down
technique. The idea is that by clicking on a cluster or
point, a detailed representation of that point can be
visualized. In the same way, each representation can
offer the vision of the indicators of an employee.
Figure 6: Detailing an employee motivation indicator.
Important accentuate that results obtained
individually by employees can be consolidated by
section, department, area, rising in the hierarchy
using drill-up technique. Likewise, the indicators can
be viewed at the highest levels of the functional
hierarchy and go down the hierarchy to examine the
lower levels using the drill-down technique.
6 DISCUSSION AND
CONCLUSION
For decades, job motivation has been shaped under
static approaches, neglecting the dynamics of the job
market and the ability of employees to obtain
information. As a consequence, the collected
evaluations did not allow to gather the richness of the
information coming from several sources. Our
approach considers that there is a improvement of
motivational analysis when the evaluation system
works with a wide range of assessments from several
sources.
During observation phase and data gathering
work, it was verified that, in practice, the motivation
assessment was mostly based on questionnaires,
which occurred in long frequency periods, averaging
6 to 12 months. For the most part, they do not reflect
the current situation because in long times periods
many indicators can change. In fact, the majority of
indicators are constantly changing, either by internal
or external influences.
The great advantage of working with a dynamic
approach is the possibility of predicting situations that
may affect the motivation of an employee or a group,
and then take preventive measures. The analysis of
sentiments can disclose new characteristics of the
evaluation process, at any moment. In this way,
employees can be evaluated using several domains of
expression.
The presented approach allows evaluation of the
degree of employees’ motivation. It was developed in
conjunction with the HR team of a large company,
including researchers in the areas of Enterprise
Administration and Computing. Therefore, the main
contribution of this paper is the development of a
framework for dynamic assessment of employee’s
motivation, as opposed to current static approaches.
We could not find an approach with such
characteristics in literature, which makes the
approach innovative.
REFERENCES
Akdemir, E., Arslan, A., 2013. Development of motivation
scale for teachers. Procedia-Social and Behavioral
Sciences, 106, 860-864.
Alharthi, R., Guthier, B., Guertin, C., El Saddik, A., 2017.
A dataset for psychological human needs detection
from social networks. IEEE Access, 5, 9109-9117.
Carvalho, D. F., Santana A.C., Mendes F.A.T. 2006.
Análise de cluster da indústria de móveis de madeira do
ICEIS 2019 - 21st International Conference on Enterprise Information Systems
452

Pará. Novos Cadernos NAEA, Belém, v. 9, n. 2, p.25-
53, dez. 2006. ISSN 1516-6481.
Chumkamon, S., Masato, K., Hayashi, E., 2015. Facial
Expression of Social Interaction Based on Emotional
Motivation of Animal Robot. In Systems, Man, and
Cybernetics (SMC), IEEE International.
Espinilla, M., de Andrés, R., Martínez, F. J., Martínez, L.,
2013. A 360-degree performance appraisal model
dealing with heterogeneous information and dependent
criteria. Information Sciences, 222, 459-471
Haruna, M., 2013. An Empirical Analysis of Herzbergs
Two-Factor Theory. Nigerian Journal of Management
Technology & Development.
Herzberg, F., 1971. Work and the nature of man. New York:
World Publishing.
Hogenboom, A., Bal, D., Frasincar, F., Bal, M., de Jong, F.,
Kaymak, U., 2013. Exploiting emoticons in sentiment
analysis. In Proceedings of the 28th annual ACM
symposium on applied computing (pp. 703-710). ACM.
Kaufman, L., Rousseeuw, P. J., 2009. Finding groups in
data: an introduction to cluster analysis (Vol. 344). John
Wiley & Sons.
Kelley, D. J., Waser, M. R., 2018. Human-like Emotional
Responses in a Simplified Independent Core Observer
Model System. Procedia Computer Science, 123, 221–
227.
Lundberg, C., Gudmundson, A., Andersson, T. D., 2009.
Herzberg's Two-Factor Theory of work motivation
tested empirically on seasonal workers in hospitality
and tourism. Tourism management, 30(6), 890-899.
Matei, M. C., Abrudan, M. M., 2016. Adapting Herzberg's
Two Factor Theory to the Cultural Context of Romania.
Procedia-Social and Behavioral Sciences, 221, 95-104.
Maslow, A. H., 1963. A theory of human motivation.
Psychological review, 50(4), 370.
Medhat, W., Hassan, A., Korashy, H., 2014. Sentiment
analysis algorithms and applications: A survey. Ain
Shams Engineering Journal, 5(4), 1093-1113.
Moita Neto, J. M., Moita, G. C., 1998. Uma introdução à
análise exploratória de dados multivariados. Química
Nova, 21(4), 467-469. https://dx.doi.org/10.1590/
S0100-40421998000400016
Ravi, K., Ravi, V., 2015. A survey on opinion mining and
sentiment analysis: tasks, approaches and applications.
Knowledge-Based Systems, 89, 14-46.
Shen, C.-Y., Yu, K.-T., 2009. Enhancing the efficacy of
supplier selection decision-making on the initial stage
of new product development: A hybrid fuzzy approach
considering the strategic and operational factors
simultaneously. Expert Systems with Applications, v.
36, n. 8, p. 11271-11281.
Tay, L., Diener, E., 2011. Needs and subjective well-being
around the world. Journal of personality and social
psychology, 101(2), 354.
Toy, B. L., 2014. Applying behavior models in a system
architecture (Applying an engineering protocol
structure to AI). In Computational Intelligence for
Human-like Intelligence (CIHLI), IEEE.Ciência da
Computação) – Universidade Estadual do Ceará.
Centro de Ciência e Tecnologia.
An Evaluation Model for Dynamic Motivational Analysis
453
