
Design Process for Human-Data Interaction: Combining Guidelines with
Semio-participatory Techniques
Eliane Zambon Victorelli
1
, Julio Cesar dos Reis
1
, Antonio Alberto Souza Santos
2
and Denis Jos
´
e Schiozer
2
1
Institute of Computing, University of Campinas (UNICAMP), Campinas, Brazil
2
Center for Petroleum Studies, University of Campinas (UNICAMP), Campinas, Brazil
Keywords:
Human-Data Interaction, Design Approaches, Visual Analytics.
Abstract:
The complexity of analytically reasoning to extract and identify useful knowledge from large masses of data
requires that the design of visual analytics tools addresses challenges of facilitating human-data interaction
(HDI). Designing data visualisation based on guidelines is fast and low-cost, but does not favour the en-
gagement of people in the process. In this paper, we propose a design process to integrate design based on
guidelines with participatory design practices. We investigate, and when necessary, adapt existing practices
for each step of our design process. The process was evaluated on a design problem involving a visual an-
alytics tool supporting decisions related to the production strategy in oil reservoirs with the participation of
key stakeholders. The generated prototype was tested with adapted participatory evaluation practices. The
obtained results indicate participants’ satisfaction with the design practices used and detected the fulfilment of
users’ needs. The design process and the associated practices may serve as a basis for improving the HDI in
other contexts.
1 INTRODUCTION
The analysis of large amounts of data has become es-
sential for the success of organisations. This is a com-
plex task that often requires the judgement of domain
experts to make the best possible assessment of in-
complete and inconsistent information. The construc-
tion of tools for this purpose that facilitate human in-
teraction with the data is an important step in achiev-
ing the desired results.
Visual analysis (VA), the science of analytical
reasoning facilitated by interactive visual interfaces,
consists in interactive and iterative dialogue between
the human and the computer. The interactive analy-
sis process is a sequence of actions by the user and
responses by the computer motivated by analytical
questions (Thomas and Cook, 2005) (Turkay et al.,
2017). While several VA tools have been developed to
support exploration of large amounts of data, they do
not yet sufficiently support some complex exploratory
analysis scenarios. There is a shortage of support
environments where domain specialist and machine
work in harmonious interaction for data exploration
(Behrisch et al., 2018).
Several studies argue that designing visualisations
and VA tools based on guidelines is an important ap-
proach to help materializing the knowledge and expe-
rience gained by various experts in the field (Shnei-
derman, 1996); (Scapin and Bastien, 1997); (Freitas
et al., 2002); (Amar and Stasko, 2004); (Zuk and
Carpendale, 2006); (de Oliveira, 2017). However, in
our view, this approach alone does not allow people
to participate in the process of building the system.
Recently, the Human-Data Interaction (HDI) area
has investigated how people interact with data in a
manner analogous to the Human-Computer Interac-
tion (HCI) area in relation to people and comput-
ers (Holzinger, 2014); (Knight and Anderson, 2016).
HDI studies human manipulation, analysis and mean-
ing creation from voluminous, unstructured and com-
plex datasets (Elmqvist, 2011).
HDI literature have often addressed the broad con-
text of ensuring the privacy and management of data
ecosystems (Bach, 2018); the means for people to be-
come aware of the data and the implications of their
use and manipulation (Mortier et al., 2014); the cap-
ture of personal preferences (Dimara et al., 2018); and
the design of mechanisms to support presentation, in-
terpretation and editing by laypersons (Crabtree and
Mortier, 2015). Our analysis of the HDI literature
410
Victorelli, E., Reis, J., Santos, A. and Schiozer, D.
Design Process for Human-Data Interaction: Combining Guidelines with Semio-participatory Techniques.
DOI: 10.5220/0007744504100421
In Proceedings of the 21st International Conference on Enterprise Information Systems (ICEIS 2019), pages 410-421
ISBN: 978-989-758-372-8
Copyright
c
2019 by SCITEPRESS – Science and Technology Publications, Lda. All rights reserved

has indicated that further studies are required to ob-
tain approaches to capture at project time the user’s
needs in relation to the interactions and the context
in which the data will be produced and used (Green
et al., 2015); Also, we need to achieve user engage-
ment with data interaction solutions through partici-
pation in the design process (Locoro, 2015).
In this context, questions are raised about design
approaches. Can the adequate involvement of stake-
holders in the VA design process be valuable to im-
prove HDI? Is it feasible to combine the advantages
of designing visualisations and VA tools combining
guidelines and participatory approaches? In our view,
the non-engagement of stakeholders in design can re-
sult in a system produced from a single view, which
although may be correct, does not describe the reality
in a comprehensive way with the vision of all parties
potentially affected by its construction.
We claim that the option for the VA interaction
design approach based on guidelines should not nec-
essarily exclude the possibility of taking advantage of
the participation of people with different profiles. Our
approach to HDI investigates ways to enable in-depth
interactions with data analysis tools, highlighting the
importance of taking into account stakeholders’ con-
tributions, the entire data life cycle, and the ability to
proactively engage with data in a variety of ways.
In this paper, we propose a design process for HDI
in decisions supported by VA that combines the ad-
vantages of using participatory practices and guide-
lines. We consider that the novelty of our study is the
combination of the two approaches. The successful
realisation of such processes involves a number of el-
ements that need to work in coordination: (i) identify-
ing key stakeholders and ensuring effective participa-
tion during design and choice of solutions; ii) search
of a set of guidelines to consider as a starting point;
iii) selection of relevant guidelines adequate for the
context; iv) finding the best way to unravel, explain
and facilitate understanding of the chosen guidelines
to the various participants; v) definition of practices
and adequate flow for the conduction of design activi-
ties to ensure they harmoniously flow and produce the
desired results.
While developing and refining our approach for
design process, we were significantly informed by a
series of practices that we have carried out in UNISIM
at Center for Petroleum Studies (CEPETRO) that de-
velops methodologies and tools to support an inte-
grated decision analysis in the development and man-
agement of petroleum fields (Schiozer et al., 2019).
In this study, the design situation involving a VA tool
that supports analytical needs for optimisation of oil
production strategy provided the opportunity to con-
duct the necessary design workshops for evaluating
our proposal.
The methodology used includes the elicitation and
problem clarification meetings based on organisa-
tional semiotics artefacts (Liu, 2008). Storyboard-
ing and braindrawing techniques supported the design
stage. The results of the design were materialised in
a functional prototype and evaluated using conceived
practices: participatory HDI design guidelines evalu-
ation and adapted Thinking-aloud. The practices of
design and evaluation were performed in an iterative
way and a questionnaire was answered by involved
participants.
The key contributions of this investigation in-
clude: 1) the definition of a design process tailored for
HDI design describing the conceived steps to allow
future reuse and replication of the dynamics; and 2)
the conduction of a case study in a data intensive en-
vironment related to oil reservoir management where
the process was applied.
2 BACKGROUND AND RELATED
WORK
Subsection 2.1 presents the approach to semio-
participatory design; Subsection 2.2 introduces de-
sign guidelines and evaluation techniques; and Sub-
section 2.3 reports on a summary of related work.
2.1 Semio-participatory Design
Organisational semiotics helps to get the understand-
ing of the context in which the technical system is in-
serted and the main forces that direct or indirectly act
on the situations (Liu, 2008). It studies the effective
use of information in business context and assumes
that organised behaviour is effected through the com-
munication and interpretation of signs by people, in-
dividually and in groups. Organisational semiotics in-
vestigates the organisation at different levels of for-
malisation - informal, formal, and technical.
The field of participatory design spans a rich di-
versity of theories, practices, analyses and actions,
with the goal of working directly with users and other
stakeholders in the design of social systems that are
part of human work (Kuhn and Muller, 1993). This
approach considers that everyone involved in a design
situation is capable of contributing for it.
The semio-participatory approach to interactive
system design combines the concepts of organisa-
tional semiotics (Liu, 2008) and participatory design
(Kuhn and Muller, 1993). It includes shared knowl-
edge and mutual commitment to establish communi-
Design Process for Human-Data Interaction: Combining Guidelines with Semio-participatory Techniques
411

cation during the design process (Baranauskas et al.,
2013). Various artefacts are proposed to mediate
this communication and facilitate creative and collab-
orative design engagement into semio-participatory
workshops. Artefacts and dynamics are proposed
to facilitate the interaction and communication of
a group with diversified profile (Baranauskas et al.,
2013). The term semio-participatory techniques is
used to refer to the application of principles of par-
ticipatory design with the support of artefacts of or-
ganisational semiotics for conducting the workshops.
Semio-participatory workshops are the engine of
the model. It moves the design process through the
different levels of formalisation throughout the design
life cycle. In the beginning of the design process, the
conduction of specific participatory practices helps to
generate the artefacts called the stakeholder identifi-
cation diagram (Liu, 2008) and evaluation framework.
Stakeholder identification diagram is a layered
structure that facilitates the identification of the in-
volved parties (stakeholders) in a process of new
technology conception and introduction. Evaluation
framework supports the articulation of problems and
the initial search for solutions. It informs about
specific issues from stakeholders and ideas or solu-
tions envisaged that have potential impact in the de-
sign. The evaluation framework extends the stake-
holder identification diagram by considering for each
stakeholder issues and solutions to the problems. In
our proposal, semio-participatory artefacts is used to
guide workshops taking advantage of people’s partic-
ipation since conception and elicitation activities (cf.
Subsection 3.1).
2.2 Design Conception and Evaluation
Design specialists can compile recommendations ac-
quired in their experience in various projects, and pro-
vide designers with the ability to determine the con-
sequences of their design decisions. Design guide-
lines are recommendations a designer can follow to
enhance the interactive properties of the system (Dix
et al., 2004). One example of guideline is the in-
formation density guideline that suggests “to provide
only necessary and immediately usable data; do not
overload your views with irrelevant data” (Scapin and
Bastien, 1997). Design guidelines vary in their level
of abstraction, generality and authority.
In this article, we use the term guideline to talk
about design recommendation made by experts and
that can be used in the design of other systems in a
comprehensive way, without distinguishing the level
of generality, abstraction or authority. Guidelines are
used as an approach to bring specialists’ knowledge
to help the identification of points for redesign that
favour HDI. Our work combines some specific rec-
ommendations collected from HDI literature to a set
of guidelines brought from related areas. Our set of
heuristics includes, for example, those of Nielsen that
refer to general guidelines applicable to all user inter-
faces (Nielsen, 1994).
The evaluation of systems that make use of visual
representations is an extremely complex task. Differ-
ent from a common user interface, a VA system must
be evaluated not only in terms of the interface, but
also for the information that it manages. There are
several approaches for this kind of evaluation. Some
of them are based on expert evaluation whereas oth-
ers involve final users assessment. The VA evaluation
methodology can be subdivided: analytic evaluations
and empirical evaluations (Mazza, 2009).
The analytic type of evaluation is carried out by
experts who verify whether a certain system is com-
pliant with a series of heuristics or guidelines. Em-
pirical evaluation methods make use of functioning
prototypes of systems and involve the final users. In
our participatory approach, it is important to count
on stakeholders contribution in the evaluation stage.
Therefore, in addition to analytical assessments based
on guidelines, we conduct empirical assessments.
One of the usability test techniques known as
Thinking-aloud (Lewis, 1982) consists in asking users
to think aloud about what they are doing while using
the system. The expectation is that the thoughts show
how user interprets each interface item.
Another set of evaluation techniques relies on ask-
ing the user about the interface. Query techniques can
be useful in eliciting detail about user’s view of a sys-
tem. They can be explored in evaluation with the ad-
vantage of getting users’ viewpoint directly and may
reveal issues that have not been considered by design-
ers. Interviews and questionnaires are the main types
of this technique (Dix et al., 2004).
The techniques mentioned here are not enough to
support our study. Therefore, we propose adaptations
to the evaluation practices to engage stakeholders at
the same time that we aggregate the knowledge and
experience acquired by experts through the use of
guidelines.
2.3 Related Work
The incontestable alternatives to our proposal are
purely participatory processes or purely based on
guidelines, as discussed in Section 1. This Section
improves the literature analysis by discussing similar
study alternatives and their limitations for the appli-
cation in our context.
ICEIS 2019 - 21st International Conference on Enterprise Information Systems
412

Ceneda et al. (Ceneda et al., 2017) proposed a
process to favour interaction in the VA which seeks
solutions to support users during data analysis. Their
work concerns the user guidance aspects of a generic
visualisation environment to progress in their data
analysis. Their study does not focus in the interaction
design of VA tools.
The proposal for design data practices presented
by Churchill (Churchill, 2016) attempts to demystify
the “genius designer” whose instincts and intuition
lead to great design decisions. The work states the
need of taking a proactive and critical stance to de-
sign, develop, or evaluate products that incorporate
capture, storage and data analysis. It lists some prac-
tical things that can be done, but does not propose a
design process for tools that deal with data.
Leman et al. (Leman et al., 2013) studied typical
data visualisations that results from linear pipelines
that start by characterising data and end by displaying
the data. The proposal goal was to provide users with
natural means to adjust the displays to support good
HDI. This method supports a dynamic process for
defining visualisations in which users learn from visu-
alisations and the visualisations adjust to the expert’s
judgement. This proposal differs from ours mainly
because it is a method for the execution time and not
a process for design.
Buchdid et al. (Buchdid et al., 2014) described an
approach for design combining participatory practices
with Interactive Digital Television patterns using the
principles of organisational semiotics. Their context
dealt with a few patterns. It was possible to explain
all the patterns in advance and train the participants
on Interactive Digital Television patterns before be-
ginning the design workshops. Our proposal distin-
guishes itself from this mostly because participatory
guidelines evaluation was carried after the first pro-
totype generation as a way to incentive creative solu-
tions.
A review of Nielsen’s heuristic evaluation method
based on participatory concerns including users
(work-domain experts) as inspectors was proposed by
Muller et al. (Muller et al., 1998). They extended the
original Nielsen’s heuristic set with several process-
oriented heuristics. Their evaluation method can help
to guide iterative designs process. This technique is
similar to one of the practices proposed in our work,
but it is focused in a specific Nielsen’s heuristics set
extension and does not address the issue of HDI.
The online community was target of a study that
combined participatory methods for design and devel-
opment with heuristic evaluation applied iteratively
(Preece et al., 2004). First, a specific set of guidelines
was developed, extending the Nielsen’s heuristics and
adding a specific set of sociability heuristic. To re-
fine the set of sociability guidelines, it was turned
into a questionnaire and open questions that was it-
eratively tested with online communities. The study
of the feedback allowed the elaboration of new items
for the test and the refinement of the heuristics.
The studies conducted by Muller et al. (Muller
et al., 1998) and Preece et al. (Preece et al., 2004)
conceived practices of evaluation by guidelines com-
bined with participatory methods. However, these
studies did not involve VA and did not focus on HDI
nor propose a process. These facts highlight the inno-
vation of our proposal for design process which com-
bines participatory design and HDI guidelines.
3 INTEGRATING HDI
GUIDELINES AND
SEMIO-PARTICIPATORY
PRACTICES
This section presents our proposal for a new design
process for HDI that combines guidelines with semio-
participatory practices. Our proposed process in-
cludes several activities. Figure 1 presents the pro-
posed flow that drives the activities.
3.1 Problem Clarification Activities
Initially, it is necessary to identify the stakeholders,
understand their concepts, terms and values in the
design problem (Liu, 2008). Stakeholder identifica-
tion diagram is the supporting artefact for this stage
in semio-participatory workshops. It helps think-
ing beyond traditional participants and involving the
ones who may direct or indirectly influence or be in-
fluenced by the solution under design (Baranauskas
et al., 2013).
From the overview obtained with stakeholder
identification diagram, it is important to know the
problems and issues as well as the ideas and solutions
related to each stakeholder. They can have different
perspectives about the subject. The evaluation frame-
work is the artefact used to support this part of the
process (Baranauskas et al., 2013).
Several types of activities can be held to allow the
delimitation of scope for the design project. We pro-
pose to use the semio-participatory artefacts to under-
stand the subject during the elicitation activities. The
techniques can be presentations, group dynamics, in-
terviews, document analysis or others (cf. item A of
Figure 1).
Design Process for Human-Data Interaction: Combining Guidelines with Semio-participatory Techniques
413
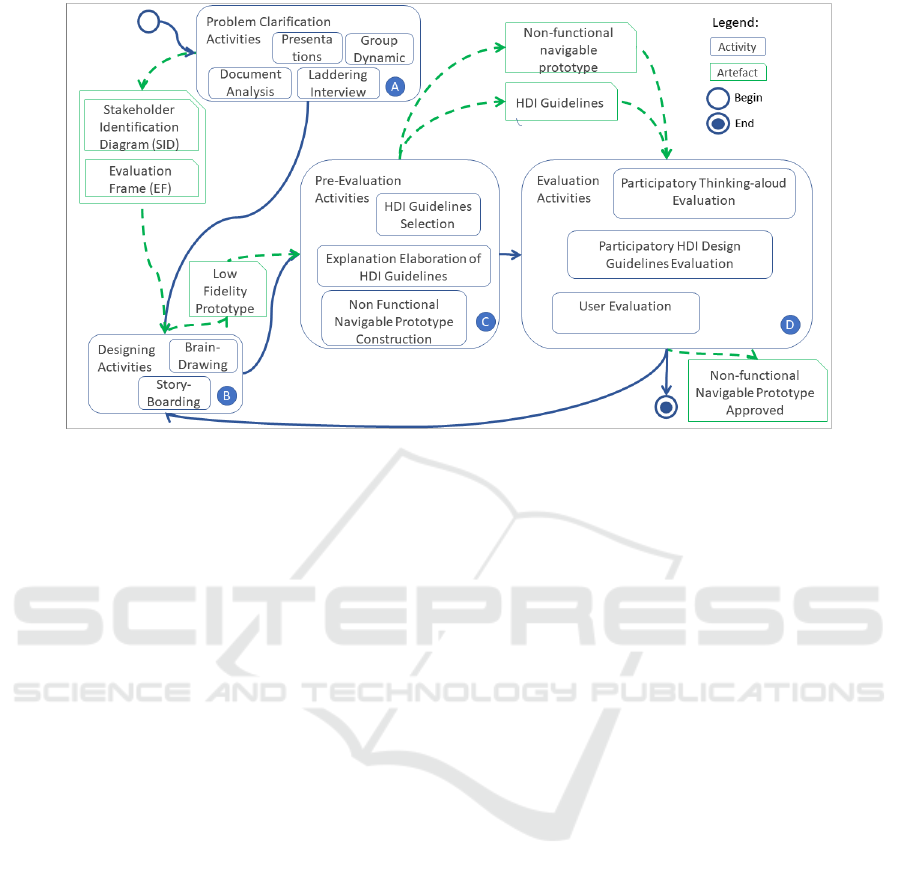
Figure 1: Process for design HDI combining guidelines with participatory design approaches.
In this context, Laddering interview, a special type
of interview approach that can be carried out with
users to understand the participants’ views and per-
sonal values is specially useful (Bourne and Jenkins,
2005). Discussion begins with concrete aspects and
evolves to more abstract level and the topic of conver-
sation evolves naturally.
3.2 Design Activities
In some situations the design involves a game of
forces, where some stakeholders may exert a dispro-
portionate influence on the project. In the participa-
tory design philosophy, this situation must be avoided
through mechanisms that seek to balance the forces.
Participants of all hierarchical levels should give their
contributions during participatory design workshops.
Techniques such as storyboarding and braindrawing
(cf. item B of Figure 1) facilitate the engagement.
Storyboarding. An interaction scenario must be
properly defined and tasks performed in the scope
of the activity should be well delineated. This helps
in the understanding of the scenario by all those in-
volved in the design. The functionality under design
and the various steps involved in it need to be well
described. Sometimes a verbal or written description
is enough. However, if the problem involves partic-
ipants with different profiles, it may be necessary to
adopt visual techniques to promote a complete under-
standing. In our approach, stakeholders might con-
tribute in the storyboarding creation.
A description based on storyboarding can help in
the pre-visualisation of a digital interface that might
support some task. It uses a sequence of stages where
each stage shows a moment in time, e.g., an interface
state. It visually tells a story. It is useful for partici-
pants to interpret how each interface proposal fits into
the design problem. After reaching a consensus about
the flow, the solution supporting each interface state
can be designed.
Braindrawing. It is a technique used to materialise
ideas and proposals into interface low-fidelity proto-
types for digital applications. In our process, each
interface state identified in the storyboard is the target
of a braindrawing section.
In this step, all participants are arranged in a cir-
cle. Each participant draws its initial idea for the in-
terface that would support the defined task using a
sheet of paper and pen. After a predetermined short
period of time, the drawing is passed to the next par-
ticipant who completes it. This step is repeated un-
til each participant received his/her original drawing
back. Then, each participant presents his proposal to
the others. The group must agree on a candidate solu-
tion to be adopted. The solution may involve common
elements of several proposals.
3.3 Pre-evaluation Activities
In our proposal, the group creates during design ac-
tivities a low fidelity prototype without design guide-
lines orientation. The guidelines are introduced in the
evaluation phase. The evaluation of the prototype re-
quires some preparation activities (cf. item C of Fig-
ure 1):
ICEIS 2019 - 21st International Conference on Enterprise Information Systems
414

Construction of a Non Functional Navigable Pro-
totype. It is important that the prototype be navigable
to facilitate the evaluation of HDI. Based on the low
fidelity prototypes and the accorded storyboarding, a
designer can propose a navigable prototype.
Selection of HDI Guidelines and Elaboration of
Explanation for HDI Guidelines. Designers should
define which sets of guidelines are relevant to be
used. Given the nature and complexity of the prob-
lem of facilitating the HDI for VA application, we
consider it is important to aggregate guidelines of
the VA, HCI and HDI area. We draw upon previ-
ous studies (de Oliveira, 2017) with a compiled set of
VA and HCI guidelines and heuristics (Shneiderman,
1996), (Scapin and Bastien, 1997), (Freitas et al.,
2002), (Amar and Stasko, 2004), (Zuk and Carpen-
dale, 2006). In this work, we call the set that re-
sulted from this junction as the initial set of HDI de-
sign guidelines. If there are any set of guidelines for
the application domain or standards used by the target
organisation, they should also be included.
Afterwards, the designers should select which
guidelines from the initial set are related to the scope
of the prototype and that matters in the context. One
way to facilitate the selection is grouping the guide-
lines by subject in clusters. One set could aggregate,
e.g.,, all guidelines related to the amount of informa-
tion showed to the user. It is then necessary to find
ways to unravel, explain and facilitate understanding
of those chosen guidelines to allow participants com-
prehending them and to decide on their use. Using
examples, even if they are from different contexts, are
a good way to explain the guidelines.
3.4 Evaluation Activities
The navigable prototype and the selected guidelines
support the evaluation activities and help decisions
to improve and refine the prototype. We propose a
participatory approach for the activities of evaluation
phase. All identified points in the evaluation phase
needs to be organised in a priority order to be treated
in a redesign cycle.
We need to verify to which extent users think the
prototype might help them accomplishing their tasks;
and how the prototype can be improved. For support
this stage, we propose two new participatory evalua-
tion practices: Participatory Thinking-aloud Evalua-
tion and Participatory HDI Design Guidelines Evalu-
ation. These new practices should be associated to an
User Evaluation (cf. item D of Figure 1).
Participatory Thinking-aloud Evaluation. Our
proposed dynamics was adapted from the original
Thinking-Aloud method defined in (Lewis, 1982) and
the adaptation presented in (Buchdid et al., 2014). A
participant is invited to interact with the navigable
prototype to complete an use case, conducting a pre-
defined task, previously explained to the group. In
our proposal, during the interaction, the whole group
is stimulated to report their thoughts and impressions
about the prototype. All participants in the workshop
speak aloud while one participant interacts with the
prototype. This activity allows knowing the impres-
sion that a prototype caused.
Participatory HDI Design Guidelines Evaluation.
We claim that the participants should, in the begin-
ning of the design process, propose alternatives freely
before worrying about guidelines. In this sense, they
do not stop thinking in creative ways to solve the
problem and are not skewed in attending a guideline.
Thus, in each round of the process the guidelines us-
age starts after the elaboration and consensus of the
design activities.
This activity should be leaded by a designer. For
each guideline, participants are introduced to the rec-
ommendation of design with an explanation and ex-
amples of applications, previously prepared.
After the explanation, participants should discuss
the application, the impacts as well the advantages
and disadvantages of adoption. They need to decide if
the guideline are going to be adopted. Finally, a sub-
set of the discussed guidelines potentially useful and
the associated ideas for redesign can be generated by
this activity.
We recommend to first carry out the Thinking-
aloud and then the HDI design guidelines evaluation
so participants have in mind the status of the proto-
type to relate it with the guidelines. Based on the is-
sues found during the participatory evaluation activi-
ties, participants elaborate a list of problems and sug-
gestions for improving the application in a redesign
phase.
At this point, the team has the opportunity to de-
cide if they are going to make a redesign activity to
adjust the prototype to issues identified. If the group
decision is to change the prototype, it may be neces-
sary to return to the storyboarding and braindrawing
activities. This cycle can be repeated more than once
until participants feel that the prototype design is ap-
propriate for their needs.
User Evaluation. When the design of the prototype is
mature, an user evaluation based in the Query Tech-
nique (Dix et al., 2004) with all participants is con-
ducted asking the participants about the results di-
rectly. It is applied by interview or questionnaire.
Design Process for Human-Data Interaction: Combining Guidelines with Semio-participatory Techniques
415

4 CASE STUDY
One challenge being addressed by UNISIM consists
in the investigation of technologies for determinis-
tic optimal production strategy selection in oil fields
(Schiozer et al., 2019). This process involves a lot of
efforts in analysis of voluminous data. SEPIA is a VA
software tool developed to facilitate this process.
One step for optimisation of the production strat-
egy requires the performance of many simulations,
with some variations among them. After some simu-
lations, it is necessary to make comparisons to verify
the differences that resulted from the changes made
from one simulation to another. SEPIA does not have
specific functionalities to support this scenario. In this
case study, we address how to allow the evolution of
SEPIA with HDI design for comparisons among dif-
ferent oil production strategies. Our proposed design
process was applied to this scenario.
The activities of this study were conducted from
June to December, 2018, and involved 2 Computer
Science researchers and 6-8 participants playing dif-
ferent roles at UNISIM One of the Computer Sci-
ence researcher played the role of designer through-
out the process. The application required 7 meetings
and workshops of 3 hours each on average. Thus,
the whole process was conducted in approximately 21
hours of meeting with 6 participants on average. In
addition, a similar effort was made to prepare the pre-
sentations and practices for each meeting. We present
the results for each step in the following.
4.1 Results of Design Problem
Clarification Activities
The process began with stakeholders identification
followed by issues and requirements elicitation.
Stakeholders, Values and Interest. There are many
stakeholders potentially involved with SEPIA tool
and they were detected by the stakeholder identifica-
tion diagram elaborated in the participatory practices.
The initial group of stakeholders was distributed in
the stakeholder identification diagram inner layers.
For example, “Developers” was inserted in the op-
eration layer of stakeholder identification diagram;
“Designers” was inserted between the operation and
contribution layers. UNISIM and the development
project manager figured in the contribution layer be-
cause they are responsible for the production of the
tool. In the source layer are the engineers and re-
searchers which are very important stakeholders be-
cause they are real users of SEPIA tool.
The presentation of the initial stakeholder diagram
helped the detection of others interested indirectly
connected with SEPIA. For example, in market layer
there is CMG
1
, a reservoir simulation software devel-
oper, and other tools vendors. In the community layer
we inserted the Brazilian regulation agency for the ac-
tivities that integrate the oil and natural gas and bio-
fuel industries in Brazil, the ANP
2
.
After this activity, the end users with the engineer-
ing and research profile began to participate in the
workshops. They participate very actively during the
clarification and design workshops.
Issues and Requirements. In the elicitation phase,
there were presentations related to underlying domain
concepts, so the designers and developers could begin
understanding the complex domain of strategies for
petroleum exploration. To deepen this understanding,
we conducted 4 individual interviews with an aver-
age duration of one and a half hour based in laddering
techniques with the SEPIA users.
The users were encouraged to speak about their
daily activities, their issues and problems and solu-
tions they see to the problems. The results of the
interviews revealed that one issue was the execution
of several attempts to optimise the strategies and the
comparison of the results. However, time, volume of
data and number of files involved in these attempts
turn difficult the comparisons among obtained results
from simulations. One user, e.g., made several sim-
ulations by slightly varying the position of a specific
well that was part of a particular production strategy.
She used bar chart views to compare strategy results
with the various well positions in relation to return of
investment and oil volume produced. The support for
the comparison between strategies was chosen as the
central requirement to be addressed in the first ver-
sion of the prototype and to validate the execution of
the process proposed in this article.
4.2 Results of Design Activities
The issues, problems, ideas and solutions identified
during design problem clarification activities were the
source for the design.
The Storyboarding. The first participatory design
activity was conducted in a meeting with the goal of
consolidating the needs reported by users in the inter-
views. They needed to agree on the scope for the next
activities.
A Storyboarding was conceived as a state transi-
tion diagram and illustrated with visual interface pro-
totypes to support the discussion of the execution flow
1
https://www.cmgl.ca/software
2
http://www.anp.gov.br
ICEIS 2019 - 21st International Conference on Enterprise Information Systems
416
of two actual use cases of comparisons. The flow pre-
sented by the storyboard had to be changed as the de-
sign activities were progressing. The technique was
very useful during all the process to build an agree-
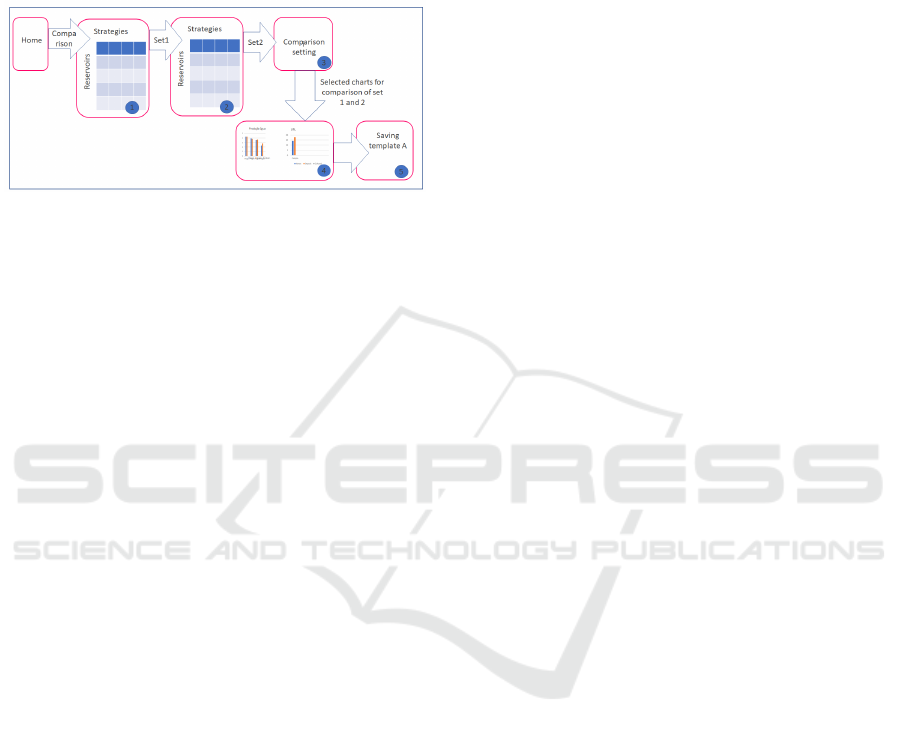
ment about the execution flow under discussion. Fig-
ure 2 shows the flow in the storyboard.
Figure 2: Storyboard showing the execution flow agreed in
participatory design activity.
Braindrawing. After getting consensus for the first
version of the storyboard, it was possible to iden-
tify the goal of each interface involved in the pro-
cess. Braindrawing sections were guided by the flow
and states defined in the Storyboarding practice. We
conducted one Braindrawing section for each relevant
state identified in the storyboard.
In the Braindrawing sections, each participant had
one minute to draw the screen for achieve the desired
goal following the steps explained in Subsection 3.2.
On average, the Braindrawings were elaborated by six
participants and the drawing phase took no more than
30 minutes. This procedure generated several alter-
natives ideas for each interface. Each idea was pre-
sented by who initially proposed the design solution.
After the team discussed the ideas, a consolidated in-
terface screen was defined. It took another 30 to 60
minutes. In general, the consolidated drawing joined
ideas from several participants.
4.3 Results of Pre-evaluation Activities
After the initial design and before the evaluation
phase, preparation activities were necessary to facil-
itate the work of the entire group. These activities
were performed by the designer.
Prototype Construction. The Braindrawing work-
shops results, low-fidelity paper prototypes, were
transformed into navigable medium-fidelity proto-
types. A navigable prototype was very useful during
the Thinking-aloud activities and helped to raise a lot
of issues, questions and suggestions.
The Guidelines Selection and Explanation. The
designer was responsible for selecting the guidelines
that were most related with the prototype scope and
for explaining the guidelines to the group. The previ-
ously compiled set on which we based was useful be-
cause it ranked the recomendations found in influen-
tial contributions in the VA and HCI areas by creating
clusters of guidelines (de Oliveira, 2017). The clus-
ters grouped the guidelines by subject and facilitated
the selection of the subset that matter to our scope.
We organised an additional cluster with HDI
guidelines found in literature. Examples of guidelines
found in HDI and used in this study are: i) “Consider
all stages of the data life-cycle and the relevant stake-
holders” (Hornung et al., 2015); ii) “Consider values
in the design and implementation of analytics con-
sidering how technologies can materialise values, and
their interpretive flexibility.” (Knight and Anderson,
2016); and iii) “Provide visual or textual indicators as-
pects of search like relevance, usability and quality on
the interface, backed up by automatically computed
metrics or user-generated reviews and annotations.”
(Koesten et al., 2017).
There are not any known set of guidelines for visu-
alisations in the oil production domain, to our knowl-
edge. In UNISIM there is a colour standard to dif-
ferentiate the representation of activities according to
the stage of the methodology in which it is executed.
One colour is used for activities related to reservoir
modelling and construction, another for reduction of
scenarios (data assimilation) a third colour represents
long-term production optimization (prediction) and a
four colour represents sort-term production optimiza-
tion activities for the future. Then, this specific guide-
lines was included in the set.
4.4 Results Evaluation Activities
The Participatory HDI Design Guidelines Evalu-
ation. This practice, facilitated by one designer, in-
volved all design workshop participants. The selected
guidelines were explained to the group so they can
decide whether changes suggested by the guidelines
could benefit the prototype. In general, each selected
guideline was explained and discussed at a time.
During the consolidation of the proposal for the
comparison visualisation interface (cf. item 4 of Fig-
ure 2), the participants liked an idea different from the
approach currently used in SEPIA. The participants
liked the new approach, but they were uncomfortable
with the paradigm shift at the first moment. It was
considered that the evaluation based on HDI guide-
lines could help to support the choice. In particular,
the following guidelines were discussed:
• “Shneiderman mantra”: overview first, zoom and
filter, than details on demand.
Design Process for Human-Data Interaction: Combining Guidelines with Semio-participatory Techniques
417

• “Information density” (Scapin and Bastien,
1997): provide only immediately usable data; do
not overload views with irrelevant data.
• “Filter the uninteresting” (Shneiderman, 1996):
allow users to control display content and quickly
focus on interests by eliminating unwanted items.
• Cycle of data (Hornung et al., 2015): “Consider
all stages of the data lifecycle”.
Currently in SEPIA, in situations similar to those
under design, all graphs of all the wells would be
generated and displayed at the same time giving an
overview of the data. However, it may overload the
user view with irrelevant data and make it difficult the
selection of view with data of the desired well. Con-
sidering the new approach designed, only one well
graphic would be shown in each frame with a wid-
get control to quickly focus on the interesting well
and eliminating others wells graphics. This approach
seems to reduce the information density, but elimi-
nates the overview of data that was familiar to users.
With the presentation of the guidelines, it was con-
sidered that the overview guaranteed by the more tra-
ditional approach did not bring relevant information
to the analysis at this moment. Considering all the
data life-cycle, the overview was necessary only at the
beginning of the process. In addition, users would not
like to have to undertake complex activities when the
complexity is not required by the task at hand. Sup-
ported by the analyses of the guidelines in the context
of the interface under discussion, participants were
able to approve the innovative design option more
comfortably.
Participatory Thinking-aloud Evaluation Activi-
ties. The Thinking-aloud process was undertake in
groups of five to six people. In the first section, only
the designer handled the prototype, because other par-
ticipants did not want to do it. In the second time, the
prototype was more familiar to them, and one of the
participants volunteered to navigate in the prototype.
All the participants deeply contributed, which
made the sections long. They lasted one and a half
hour on average. They were very productive to refine
the ideas for the redesign of the prototype.
Sometimes the expressed thoughts led to modifi-
cations with low impact like changing the location of
an interface component, e.g., the action buttons posi-
tions. But, it was also identified an opportunity of im-
provement concerning the interaction approach that
would demand a high impact change in the flow of
execution.
User Evaluation Activities Results. In the final stage
of the process, the participants were invited to answer
a questionnaire and one open question evaluating the
resulting prototype from previous activities.
The evaluation used a Likert scale from 0 to 3 in
which the respondents specified their level of agree-
ment with the adequacy of the generated prototype.
Notes 2 and 3 were considered positive. Five people
answered the questionnaire (all of them had partici-
pated in the design and evaluation activities).
The questions attempted to identify users’ assess-
ment of the prototype in general, and specifically re-
garding the adequacy of interfaces design, interac-
tion flow and meeting general users’ needs. Table 1
presents results for each question, where Aver. Grade
is the average grade for all respondents, %Positive
represents the percentage of grades greater than or
equal to 2 and %Max. Grade is the percentage of
grades equals to 3. The overall evaluation was con-
sidered positive for 100.0% of the participants and
66.7% of them rated at the maximum grade. The ade-
quacy of the execution flow was the only item that did
not get 100% of positive opinion. The adequacy of
consolidated design to meet the stakeholders’ needs
was rated with the highest grades.
4.5 Participants’ Assessment of the
Process
After the design and evaluation activities, all par-
ticipants were invited to evaluate the process used
through a questionnaire and open question. The scale
and the criteria to consider a positive opinion was the
same used for the prototype evaluation. Five partici-
pants answered the questionnaire.
Table 2 presents the obtained results. The process
overall evaluation was considered positive for 100.0%
of the participants and 33.3% rated them at maximum
grade. For the questions about specific issues regard-
ing the various activities of the process, the item with
the worst grade was about the time involved, having
only 40% of positive opinion and 0% of maximum
grade. The best aspect considered by the participants
was the adequacy of practices used for the objectives
with 100% of positive opinion and maximum grade.
5 DISCUSSION
We proposed to combine the advantages of using
guidelines and participatory practices in a design pro-
cess for HDI in decisions supported by the VA. The
participatory evaluation practices helped us to under-
stand if the generated prototype made sense for stake-
holders. We verified to what extent users think the
ICEIS 2019 - 21st International Conference on Enterprise Information Systems
418
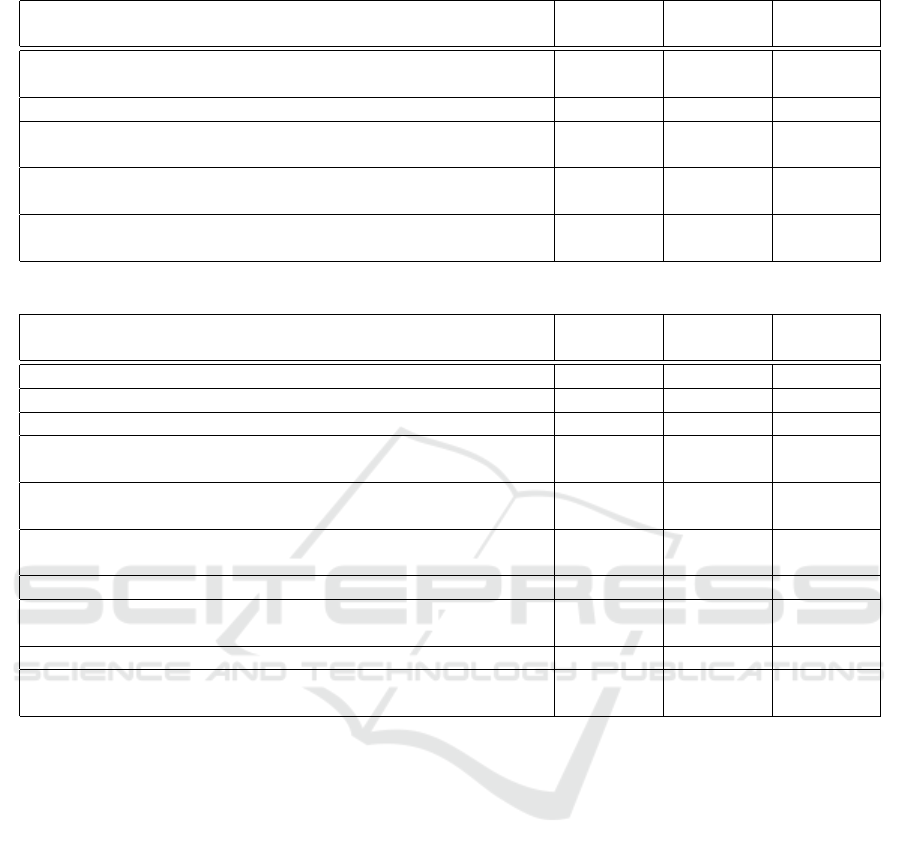
Table 1: Prototype Evaluation.
Question Aver.
Grade
%Positive % Max.
Grade
What is your overall evaluation of the results generated by the
workshops
2.5 100.0 66.7
Is the consolidated design suitable for the proposed screens? 2.5 100.0 66.7
Is the flow of the proposed interaction suitable for the compari-
son functionality?
2.5 75.0 66.7
Does the comparison functionality as prototyped suit your needs
as a user?
2.63 100.0 66.7
Does the comparison functionality as prototyped suit meet the
needs of the majority of users?
2.63 100.0 66.7
Table 2: Process Evaluation.
Question Aver.
Grade
%Positive % Max.
Grade
What is your overall evaluation of workshops you attended? 2.25 100.0 33.3
What is your opinion about the time involved in the workshops? 1.4 40.0 0.0
Did you feel comfortable expressing your opinions? 2.8 100.0 75.0
Were the practices used in the workshops adequate for the ob-
jectives?
3.0 100.0 100.0
Did the activities allow the reconciliation of different points of
view?
2.4 100.0 25.0
Did the meetings allow the creation of shared understanding of
the problem addressed?
2.2 80.0 25.0
Did braindraw’s activity help bring about new design solutions? 2.6 100.0 75.0
Was the navigable prototype useful for understanding the solu-
tions being discussed?
2.8 100.0 75.0
Was Thinking-aloud useful for prototype evaluation? 2.8 100.0 75.0
Was the presentation of design guidelines sufficient to under-
stand the recommendation?
2.0 80.0 25.0
prototype might help them and in what points the pro-
totype can be improved. The evaluation practices also
sought to understand relevant aspects about the suit-
ability of the process.
Our achieved results indicate that both the pro-
posed process and the product generated by it, the
prototype, had good acceptance. However, some
points of improvement were evidenced by users feed-
backs. Two main issues found were the duration of
the meetings and the guidelines understanding.
One of the challenges to ensuring the effective
participation of key stakeholders is the time and effort
required to participate during the process as a whole.
In our study case, many meetings were necessary for
understanding, delimiting the scope, design and ap-
prove the solution. The process proved to be some-
what onerous in relation to the number of meetings
and their duration. The time spent in meetings and
workshops, as detailed in Section 4, was perceived by
the participants as taking much time.
It was not feasible to ensure the participation of all
experts over a very long period of time. The strategy
used to minimise the effort required was to alternate
meetings with and without final users, or at a high
level with focus on the domain understanding and low
level with focus on practical aspects of the tool. Af-
ter the meetings with specific focus, we gathered all
stakeholders to hold a hands-on workshop.
The time involved in the activities should be con-
sidered to enable further applicability of the process.
Some participants suggested ways to speed up the
meeting with stricter control of the meeting agenda.
However, care must be taken that stricter control does
not inhibit the participation and creativity of all.
Regarding the moment of the guidelines applica-
tion, both the use of guidelines at design time and
at the time of evaluation have their advantages and
challenges. In the scenario of this investigation, if the
guidelines were used in the beginning of the design,
it would be difficult and time consuming to train the
participants in all the guidelines. On the other hand,
the guidelines-based evaluation conducted by design
Design Process for Human-Data Interaction: Combining Guidelines with Semio-participatory Techniques
419

experts would require a lot of effort to train them in
the application domain due to the complexity of the
subject. Teaching the design guidelines to the par-
ticipants was challenging, but the training of design
specialists on the subjects of oil production strategies
domain would be even harder.
Therefore, it would not be possible to include
several design specialists in the evaluation process.
We involved only two design specialists and priori-
tised the participation of users in the evaluation phase.
More specifically, we found that conducting a partici-
patory evaluation based on guidelines after the design
phase allowed the reduction of the number of relevant
guidelines that needed to be addressed in the training.
It proved to be advantageous in terms of training ef-
fort and the process was viable with good results.
This investigation demonstrated that the adequate
involvement of stakeholders in the VA design pro-
cess is valuable to improve HDI. In addition, our find-
ings revealed the feasibility of combining the advan-
tages of designing visualisations and VA tools based
on guidelines and participatory approaches.
As future steps, we plan to identify well-
delineated scopes that can be easily explained to de-
sign specialists and conducting a guideline evaluation
involving several design specialists. In addition, we
seek to investigate other ways to facilitate the under-
standing of the guidelines. We intend to combine ex-
amples from other contexts and examples adopted in
other visualisation tools for the same domain. After
discussing these examples, we can devise activities to
practice exercises with the use of guidelines in fake
problems.
The ease or difficulty to obtain consensus in the
decisions is an interesting point to consider in a par-
ticipatory process. In a context in which a single par-
ticipant suggested altering one proposal made individ-
ually by another, consensus probably would be not so
easy. But in this process, both the initial ideas and
the proposals for change in the prototype came from
several different participants and the ideas were dis-
cussed as soon as they arose. The acceptance of the
changes was facilitated and solutions were adopted in
consensus by the whole group.
Finally, during the participatory practices, the
constructive nature of the process allowed to observe
how shared understanding about the problem domain
was obtained, different viewpoints were conciliated,
different proposals were consolidated, and the appli-
cation was created. The discussions, , were very fruit-
ful and led to the materialisation of the proposed so-
lutions.
So we found that, although sometimes costly in
the design time, it is achievable to combine the advan-
tages of designing visualisations and VA tools based
on guidelines and of the participatory approaches. In
addition, stakeholder involvement in the VA design
process can help improve HDI. Advances in HDI de-
sign reduce the likelihood of rework after solution de-
velopment, thus offsetting the additional efforts made
with participatory practices.
6 CONCLUSION
The design of HDI-oriented software applications in-
volving the visualisation of huge volumes of data to
guide sensitive decisions is still a open research prob-
lem. This paper proposed a design process to improve
HDI in VA that combines the advantages of both data
visualisation guidelines and participatory practices.
We applied it in a case study for VA tool used in the
decision on the oil production strategy. Our obtained
results indicated users positive evaluation of the pro-
totype generated by the process. Participants demon-
strated satisfaction with the practices used and com-
fort to express their ideas. Our research findings re-
vealed that the combination of design approaches may
allow better decisions to be made through VA of volu-
minous data. Our proposal presents good potential for
applications in the design of VA solutions involving
HDI in domains of high complexity. In future work,
we plan to address open challenges involving the ex-
tension of the process to allow refining the guidelines
set from users’ answers to open questions. We plan to
investigate how to measure the HDI improvement in
addition to test the process in other HDI domains.
ACKNOWLEDGMENTS
We thank the support from Petrobras and Energi Sim-
ulation inside of the R&D of ANP. We appreciate the
involvement of the Research Group of Simulations
and Management of Petroleum Reservoirs (UNISIM-
UNICAMP) at CEPETRO and Institute of Computing
at UNICAMP.
REFERENCES
Amar, R. and Stasko, J. (2004). A Knowledge Task-Based
Framework for Design and Evaluation of Information
Visualizations. IEEE Symposium on Information Vi-
sualization, pages 143–149.
Bach, B. (2018). Ceci n’est pas la data: Towards a Notion of
Interaction Literacy for Data Visualization. In VisBIA
2018 - Workshop on Visual Interfaces for Big Data
Environments, pages 10–12.
ICEIS 2019 - 21st International Conference on Enterprise Information Systems
420

Baranauskas, M. C. C., Martins, M. C., and Valente, J. A.
(2013). Codesign Parte I. In Codesign de Redes Dig-
itais: Tecnologia e Educac¸
˜
ao a Servic¸o da Inclus
˜
ao
Social, pages 17410–17416. Penso Editora.
Behrisch, M., Streeb, D., Stoffel, F., Seebacher, D., Mate-
jek, B., Weber, S. H., Mittelstaedt, S., Pfister, H.,
and Keim, D. (2018). Commercial Visual Analytics
Systems-Advances in the Big Data Analytics Field.
IEEE Transactions on Visualization and Computer
Graphics, pages 1–20.
Bourne, H. and Jenkins, M. (2005). Eliciting Managers ’
Personal Values : An Adaptation of the Laddering In-
terview Method. Organizational Research Methods,
8(4):410–428.
Buchdid, S. B., Pereira, R., and Baranauskas, M. C. C.
(2014). Playing Cards and Drawing with Patterns
- Situated and Participatory Practices for Designing
iDTV Applications. Proceedings of the 16th Interna-
tional Conference on Enterprise Information Systems.
Ceneda, D., Gschwandtner, T., May, T., Miksch, S., Schulz,
H. J., Streit, M., and Tominski, C. (2017). Charac-
terizing Guidance in Visual Analytics. IEEE Trans-
actions on Visualization and Computer Graphics,
23(1):111–120.
Churchill, E. F. (2016). Designing data practices. Interac-
tions, 23(5):20–21.
Crabtree, A. and Mortier, R. (2015). Human data in-
teraction: historical lessons from social studies and
cscw. In ECSCW 2015: Proceedings of the 14th Eu-
ropean Conference on Computer Supported Cooper-
ative Work, 19-23 September 2015, Oslo, Norway,
pages 3–21. Springer.
de Oliveira, M. R. (2017). Adaptac¸
˜
ao da Avaliac¸
˜
ao
Heur
´
ıstica para Uso em Visualizac¸
˜
ao de Informac¸
˜
ao.
Master thesis, Universidade Estadual de Campinas.
Dimara, E., Bezerianos, A., and Dragicevic, P. (2018).
Conceptual and Methodological Issues in Evaluating
Multidimensional Visualizations for Decision Sup-
port. IEEE Transactions on Visualization and Com-
puter Graphics, 24(1):749–759.
Dix, A., Finlay, J., Abowd, G. D., and Beale, R. (2004).
Human-Computer Interaction. Pearson Prentice-Hall,
third edit edition.
Elmqvist, N. (2011). Embodied Human-Data Interaction.
ACM CHI 2011 Workshop “Embodied Interaction:
Theory and Practice in HCI, pages 104–107.
Freitas, C. M. D. S., Luzzardi, P. R. G., Cava, R. A.,
Winckler, M. A. A., Pimenta, M. S., and Nedel, L. P.
(2002). Evaluating Usability of Information Visual-
ization Techniques. Proceedings of 5th Symposium
on Human Factors in Computer Systems (IHC 2002),
pages 40–51.
Green, M. H., Davies, P., and Ng, I. C. L. (2015). Two
strands of servitization: A thematic analysis of tradi-
tional and customer co-created servitization and future
research directions. International Journal of Produc-
tion Economics.
Holzinger, A. (2014). Extravaganza tutorial on hot ideas
for interactive knowledge discovery and data mining
in biomedical informatics. Lecture Notes in Computer
Science, 8609 LNAI:502–515.
Hornung, H., Pereira, R., Baranauskas, M. C. C., and Liu,
K. (2015). Challenges for Human-Data Interaction –
A Semiotic Perspective. Springer International Pub-
lishing Switzerland, 9169:37–48.
Knight, S. and Anderson, T. D. (2016). Action-oriented,
accountable, and inter(active) learning analytics for
learners. CEUR Workshop Proceedings, 1596:47–51.
Koesten, L. M., Kacprzak, E., Tennison, J. F. A., and Sim-
perl, E. (2017). The Trials and Tribulations of Work-
ing with Structured Data. Proceedings of the 2017
CHI Conference on Human Factors in Computing Sys-
tems - CHI ’17, pages 1277–1289.
Kuhn, S. and Muller, M. (1993). Participatory Design.
Communications of the ACM.
Leman, S. C., House, L., Maiti, D., Endert, A., and North,
C. (2013). Visual to Parametric Interaction (V2PI).
PLoS ONE, 8(3).
Lewis, C. (1982). Using the ’thinking-aloud’ method in
cognitive interface design. Research Report RC9265,
IBM TJ Watson Research Center.
Liu, K. (2008). Semiotics In Information Systems Engineer-
ing. Cambridge University Press.
Locoro, A. (2015). A map is worth a thousand data:
Requirements in tertiary human-data interaction to
foster participation. CEUR Workshop Proceedings,
1641:39–44.
Mazza, R. (2009). Introduction to Information Visualiza-
tion. Springer Verlag.
Mortier, R., Haddadi, H., Henderson, T., McAuley, D., and
Crowcroft, J. (2014). Human-Data Interaction: The
Human Face of the Data-Driven Society. SSRN Elec-
tronic Journal.
Muller, M. J., Matheson, L., Page, C., and Gallup, R.
(1998). Participatory heuristic evaluation. Interac-
tions, 5(5):13–18.
Nielsen, J. (1994). Usability inspection methods. In Confer-
ence companion on Human factors in computing sys-
tems, pages 413–414. ACM.
Preece, J., Abras, C., and Krichmar, D. M. (2004). De-
signing and evaluating online communities: research
speaks to emerging practice. International Journal of
Web Based Communities, 1(1):2.
Scapin, D. L. and Bastien, J. M. (1997). Ergonomic cri-
teria for evaluating the ergonomic quality of interac-
tive systems. Behaviour and Information Technology,
16(4-5):220–231.
Schiozer, D. J., Santos, A. A. S., Santos, S., and Hohen-
dorff Filho, J. (2019). Model-Based Decision Anal-
ysis Applied to Petroleum Field Development and
Management. Oil & Gas Science and Technology –
Rev. IFP.
Shneiderman, B. (1996). “The Eyes Have It: A Task by. In
Proc., IEEE Symposium on Visual Languages.
Thomas, J. and Cook, K. (2005). Illuminating the path: The
research and development agenda for visual analytics.
IEEE Computer Society, page 184.
Turkay, C., Kaya, E., Balcisoy, S., and Hauser, H. (2017).
Designing Progressive and Interactive Analytics Pro-
cesses for High-Dimensional Data Analysis. IEEE
Transactions on Visualization and Computer Graph-
ics, 23(1):131–140.
Zuk, T. and Carpendale, S. (2006). Theoretical analysis of
uncertainty visualizations. In Proceedings of SPIE -
The International Society for Optical Engineering.
Design Process for Human-Data Interaction: Combining Guidelines with Semio-participatory Techniques
421
