
Algorithmization in a Computer Graphics Environment
Zuzana Homanova
1,2
and Tatiana Havlaskova
1,2
1
University of Ostrava, Frani Sramka 3, Ostrava, Czech republic
2
Department of Information and Communication Technologies in Education, Czech republic
Keywords: Algorithmization, Vector Graphics, Learning, Vector Software, ICT in Education.
Abstract: Today’s digital age makes it possible for people to communicate via video or images. Therefore, computer
graphics is part of the elementary school curriculum. The paper is aimed at updating computer science
education at Czech elementary schools; it shows how pupils could develop their computational thinking when
creating vector graphics based on basic geometric shapes such as a circle, ellipse, square, rectangle and others.
The following methods were chosen to present the proposed processes: verbal expression for an algorithm,
visual projection and a flowchart.
1 INTRODUCTION
Schools and school facilities are currently trying to
respond to dynamic changes related to the
development of digital technologies. Pupils need to
develop their computational thinking as it is
considered one of the key competencies.
The paper shows why it is important that pupils
develop algorithmic thinking processes, defines
algorithmic thinking and stresses its importance in
education.
The Strategy for Education Policy of the Czech
Republic Until 2020 (MŠMT, 2017) states that pupils
should be able to not only use modern technology, but
also understand it and even create it. One of the
projects that supports this notion is PRIM (Supporting
the Development of Computational Thinking,
imysleni.cz).
The paper is aimed at the basic method of creating
vector graphics through objects and its algorithmic
expression via words, visual projection and a
flowchart.
1.1 General Issues of Algorithmization
There are many everyday activities where one needs to
follow instructions or the sequence of steps to achieve
the correct result – the output state. Consider, for
instance, cooking following the recipe, assembling
furniture following the instructions, or activities a
person performs from the moment they wake up until
they have to leave for work. There are elements of
algorithmization and algorithmic thinking in all these
situations.
1.2 Algorithm, Algorithmic Thinking
How can algorithmization be defined? The term itself
dates back to the turn of the 8
th
century A.D. when
Arabia mathematician Abū ʻAbd Allāh Muhammad
ibn Mūsā al-Chwārizmī published two books on
solving linear and quadratic equations. Today, the last
part of his name – al-Chwārizmī – is known as
Algorismi, i.e. algorithm (Online Etymology
Dictionary, 2018).
Educational institutions should help pupils develop
algorithmic thinking as it is one of the key
competencies though which they can learn how to use
information and communication technology and
incorporate it into their everyday lives. The following
are the basic components of algorithmic thinking:
Functional decomposition (into smaller parts);
Use of data;
Term generalization;
Proceeding step by step;
…
Many authors are of the opinion that algorithmic
thinking is a cognitive process concept with a clearly
defined sequence of mental operations (with every
important one being described in detail or optimized)
and end result (Pervin, 2007).
However, there is another definition, which
describes algorithmic thinking as a set of mental
operations, actions, methods and strategies aimed at
466
Homanova, Z. and Havlaskova, T.
Algorithmization in a Computer Graphics Environment.
DOI: 10.5220/0007752704660473
In Proceedings of the 11th International Conference on Computer Supported Education (CSEDU 2019), pages 466-473
ISBN: 978-989-758-367-4
Copyright
c
2019 by SCITEPRESS – Science and Technology Publications, Lda. All rights reserved

completing a theoretical and practical task, with
algorithms being the result (Kopayev, 2018).
Different literatures define the terms algorithm and
algorithmic thinking in different ways. However, for
the purposes of this paper, the following definition is
accurate enough. It describes an algorithm as a specific
way of solving a problem with clearly defined
guidelines.
In the last two decades, many scholars have tried
to define the term algorithmic thinking, arguing that it
is the most important competence which pupils can
learn in school (Snyder, 2000).
In the broader context, algorithmic thinking is a set
of skills aimed at constructing and understanding an
algorithm:
Ability to analyze problems;
Ability to specify a problem;
Ability to find operations required to solve a
problem;
Ability to use basic operations to construct a
correct algorithm for a particular problem;
Ability to consider all problem variations (both
normal and specific);
Ability to make an algorithm more effective.
(Futschek, 2006).
Without algorithmic thinking, one cannot possibly
construct algorithms and processes for solving difficult
problems. Futschek (2018, p. 160) agrees with this
statement, arguing that algorithmic thinking is a highly
creative process. If one is to construct an algorithm,
they need to have mastered algorithmic thinking.
2 ALGORITHM PROPERTIES
An algorithm must have the following properties:
Determination – each step needs to be clearly
defined. There cannot be a situation where it is not
clear which steps will follow.
Generality – the created algorithm is applicable to
all problems of a similar nature, not only one type.
Resultativity – realization of a particular number of
steps leads to the correct result.
Finality – following the realization of individual
steps, each algorithm must end.
There are situations when one can reach the correct
result through various algorithms with different
numbers of steps, with the aforementioned number of
steps (i.e. the effectiveness of an algorithm) playing the
key role. The less steps an algorithm has, the shorter
the realization time will be (and the more effective the
algorithm will be) (Krček, Kreml, 1993; Pšenčíková,
2009). There are many ways to write an algorithm –
verbal description, graphic representation using a
flowchart and instruction sequence using images.
2.1 Verbal Description of an Algorithm
Verbal description of an algorithm helps us express
any activity realized in everyday situations.
Crossing a street with traffic lights:
1. Go right up to the traffic lights.
2. Is a red light on?
Yes – wait, go back to Point 2.
No – continue to Point 3.
3. Cross the street.
Even though it is evident that a number of (not
only) everyday activities could be expressed through a
verbal description of an algorithm, it could also lead to
inaccuracies caused by different formulations and/or
figures of speech. A natural language should be
replaced with a structured language, i.e. a natural
language bound by certain rules.
2.2 Algorithm Flowchart
Graphic representation of an algorithm through a
flowchart is often used. It uses pre-defined structures
and symbols which make the algorithm easier to
understand.
The following are the main flowchart symbols:
Figure 1: Symbol for the beginning and the end.
Figure 2: Symbol for an operation, instruction.
Figure 3: Symbol for a Condition, Decision.
A flowchart representing a verbal description of
crossing a street with traffic lights may have the
following form:
Algorithmization in a Computer Graphics Environment
467
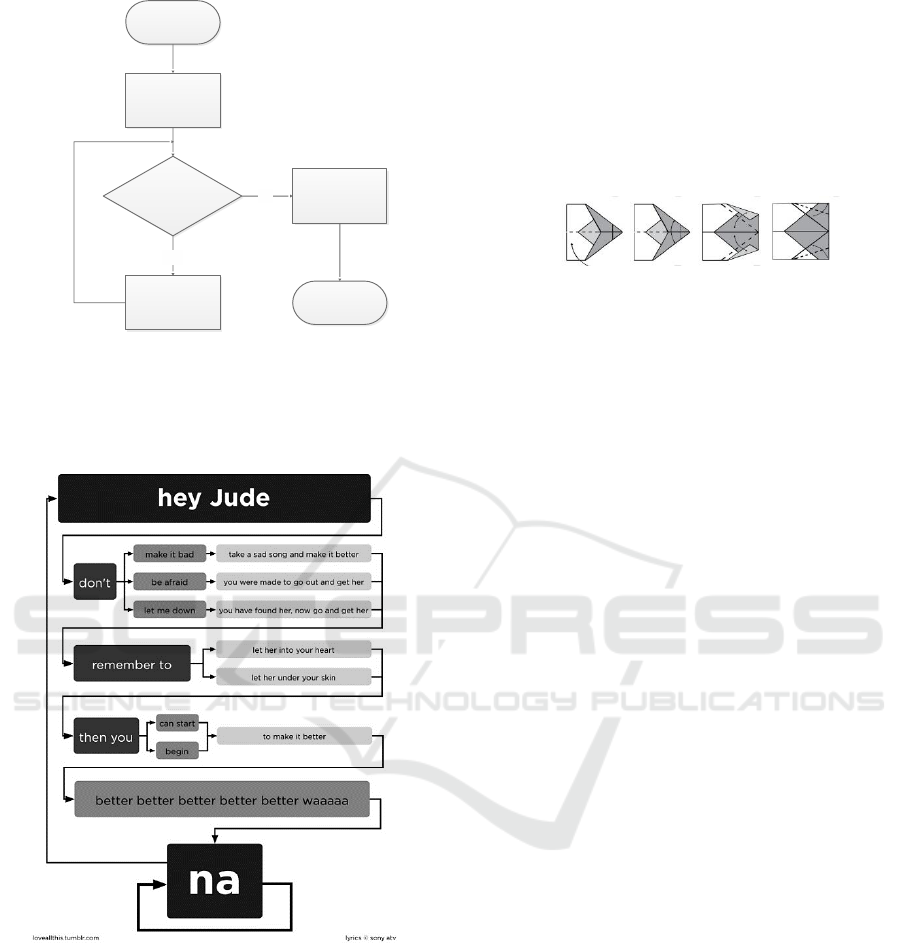
Figure 4: Crossing a street with traffic lights.
The following figure presents an interesting view
of how a flowchart could be used in the music
industry (Lessner, 2014):
Figure 5: The song “Hey Jude”.
Why is it better to use a graphic representation than a
verbal description of an algorithm?
We can see the entire structure of an algorithm, not
only its parts.
It enables us explore and understand the entire
process, helping us to see how it could be changed
or improved.
It allows us to discover redundant steps in the
creation process.
It makes communication easier when working in
a team. (Umenie kreativity, 2018).
2.3 Picture Instructions
The sequence of instructions can also be expressed
through various pictures, symbols or even
pictograms, helping to bring algorithmization to the
attention of a wider public (today, it is used almost
exclusively by experts, teachers and pupils of
computer science and other related fields).
Figure 6: Picture instructions (source: Keliwood.cz).
3 COMPUTER GRAPHICS
Computer graphics is dynamically developing.
Thanks to the widespread use of mobile technology
and graphic applications and software, graphics has
become ubiquitous in the lives of people of different
age groups. Not only cameras built into mobile
devices, but also mobile applications, web
applications, commercial and open source software,
creative filters, GIF images, graphic file databases,
shared galleries and other online tools help us
develop our creativity.
Computer graphics can be divided into:
Raster graphics,
Vector graphics.
Both vector and raster graphics have their unique
features such as the properties of graphic files and the
way they are used. One of the main differences is the
way in which a particular object is described
(Procházková et al., 2007). While raster graphics uses
pixels, vector graphics is based on Bézier curves and
mathematical shapes (circles, ellipses, polygons, etc.)
defined by mathematical equations. Both raster and
vector graphics can also be used at another graphic
level. Vector graphics is used for creating
illustrations, diagrams, promotional materials
(leaflets, business cards, and logotypes), etc. Vector
graphics is taught in elementary school (as part of the
subject "Informatics").
However, this division is not the only one. There
are approaches that define computer graphics as an
instrument for (Dannhoferová, 2012; Španěl, 2013):
Infographic image modeling,
Creating and modifying an infographic image,
Displaying an infographic image,
Interpreting an infographic image,
or according to the space dimension (2D graphics, 3D
graphics).
S
Come to the
traffic light
Is the red light on
the traffic light?
F
Wait
Yes
Go through the
transition
No
CSEDU 2019 - 11th International Conference on Computer Supported Education
468

3.1 Vector Graphics in Elementary
School Instruction
In schools, teachers can use a number of different (both
printed and electronic) sources when teaching
computer graphics – e.g. professional channels on
social networks, MOOC courses, shared forums,
clouds, portals aimed at experience exchange (e.g.
Adobe Education Exchange).
Vector graphics instruction helps pupils develop
imagination and creativity. The national curriculum
document – The Framework Educational Program for
Basic Education (MSMT, 2017) – places it under the
area of information processing and management.
Upper primary school pupils should be able to:
Work with text, graphic and table editors and use
appropriate applications,
Apply the basic esthetic and typographic rules for
working with text and image,
Work with information in accordance with
Intellectual Property Law,
Use information from different sources and
evaluate relations between facts,
Process and present information at the user level in
text, graphic and multimedia form.
Pupils are usually first introduced to vector software in
computer science class. Zoner Callisto and Inkscape
are the most popular free software used in Czech
elementary schools. The current version of Zoner
Callisto 5 Free is free of charge. The advantage of this
program is Czech location and technical support.
Inkscape is an open-source vector graphics editor, with
capabilities similar to Adobe Illustrator, CorelDraw,
etc. using the W3C standard Scalable Vector Graphics
file format.
3.2 Basic Terms: Vector Graphic File,
Curve, Path
A vector graphic file (or a graphic object) is a set of
individual graphic elements which create a graphic
image. A vector graphic file can be described as a set
of curves containing information about an object’s
shape (if it is a circle, square, rectangle, curve, etc.),
coordinates, color fill or contour thickness
(Procházková et al., 2007).
Curves are the basic building block of vector
graphics. They are defined by node points – there are
node control points (which indicate the shape of the
curve) and node anchor points (which provide
information about the beginning and the end of the
curve). Glitschka (2013, p. 22) defines a Bézier curve
as “a path which can be bent at either end using handles
sticking out of the node points at the path’s ends”.
Vector graphic images can be:
taken from other authors,
newly created.
Each graphic design is preceded by an idea. Lieng
(2017) argues that graphic designers often draw
inspiration from online sources, using selected parts of
such designs in their work. There are various online
databases that contain both free and paid computer
graphic images (e.g. freepik.com, deviantart.com,
stock.adobe.com, vecteezy.com, etc.), which can be
used in projects or in instruction. Since a vector image
can be downloaded from the Internet and then edited
in one of the many vector softwares (both commercial
and open source), pupils can learn how graphic objects
are created – learn about the layout of node control and
anchor points which determine path trajectory, of how
many points individual curves consist, etc.
In vector graphics, images can be created in a
variety of ways, i.e. there is no one correct solution.
3.3 Basic Tools in Vector Graphics
Instruction
In vector graphics instruction, pupils/pupils learn to
use graphic software. They learn the following:
Become familiar with the working environment,
Create and modify basic shapes and curves,
Set basic properties of graphic objects (contour,
filling),
Alignment and arrangement of graphic objects,
Transform objects (rotation, mirroring, etc.),
Work with text,
Hand drawing (a pen, a pencil).
The ability to use a computer and graphic software
(being able to use at least the basic tools) and knowing
the principles for creating vector graphics are the
prerequisites for doing so. In order to be able to create
a graphic object, one needs to know how to work with
graphic objects and what tools can be used when
working with curves.
The following are the basic tools used in vector
graphics instruction:
Selection tool,
Node point transformation tool,
Tool for creating basic geometric shapes,
Hand drawing tool (a pen, calligraphic pen, brush,
pencil, etc.).
The selection tool is the default tool of every
graphic editor. It allows the user to select, move, rotate
and change the size of objects. The node point
transformation tool enables the user to change:
The position of node points,
Properties of node points (e.g. a smooth or corner
Algorithmization in a Computer Graphics Environment
469
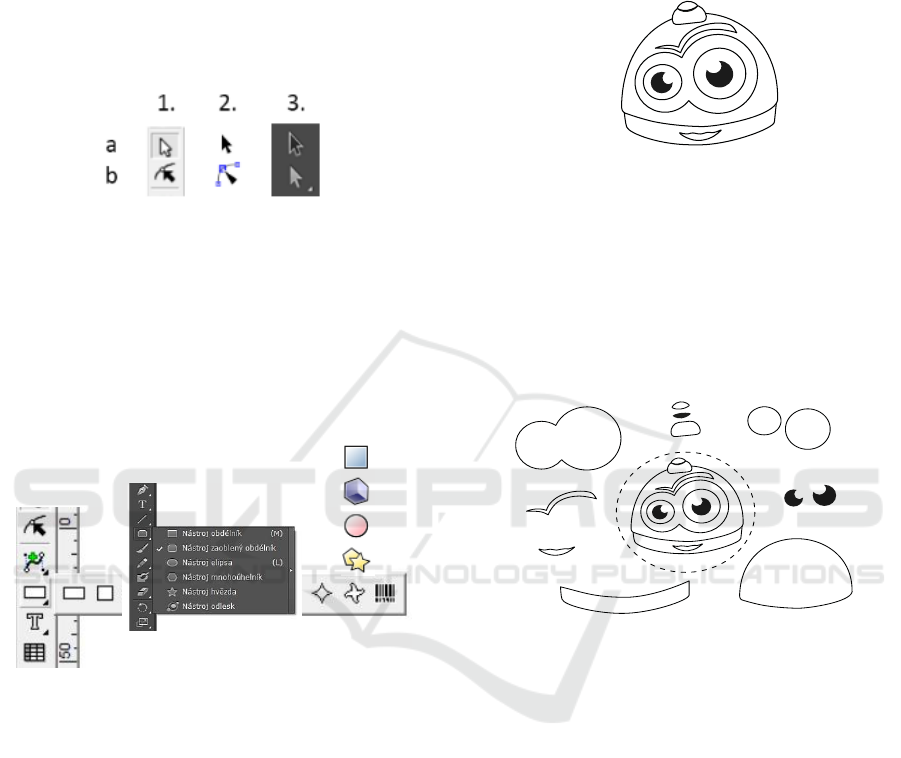
node point),
The number of node points in an object.
The node point transformation tool enables the
user to influence the final shape of an object or a curve.
Depending on the software, the node point
transformation tool has different names:
Object shaping (Zoner Callisto),
Curve editing at node level (Inkscape),
Direct selection tool (Adobe Illustrator),
Figure 7: (1a) Object Selection and Editing tool, (1b) Object
Shaping tool, Zoner Callisto; (2a) Select and transform
objects (2b) Edit path nodes or control handles, Inkscape;
(3a) Selection tool, (3b) Direct Selection tool, Adobe
Illustrator.
In this paper, we use the name “direct selection tool”.
The tool for creating basic geometric shapes allows
the user to create circles, ellipses, starfish, rectangles
and other polygons (see Figure 8).
Figure 8: Basic geometric shapes (Zoner Callisto 5/ Adobe
Illustrator/ Inkscape).
3.4 Algorithmization in Creating Vector
Graphics
The paper is aimed at an algorithmic expression of the
basic process of creating graphic objects through the
following:
Creating basic geometric shapes (rectangles,
circles, ellipses, polygons, etc.),
Modifying basic geometric shapes using logical
operations based on Boolean logic (mathematical
operations – amalgamation, division, difference,
penetration, etc.).
Modifying basic geometric shapes using a tool
for creating and modifying node points.
An example will show the creation of graphic objects
through:
Verbal description,
A flowchart,
Visual instruction.
The individual steps in creating a graphic object will
be demonstrated on the following picture of a robotic
toy.
Figure 9: Graphic object – robotic toy.
3.5 Working with Basic Geometric
Shapes
The proposed graphic file consists of graphic sub-
elements such as the robotic toy’s body, eyes,
eyebrows, etc., which together form the final image.
Generally speaking, every graphic sub-element is a
part of a complex problem (see Figure 10).
Figure 10: Graphic sub-elements as parts of a problem.
The pupil’s ability to interpret the basic shapes and
curves which constitute a particular graphic file has an
impact on their creativity, making it a prerequisite for
creating graphic objects. Therefore, this skill should be
developed. Considering time allocation and pupils’
age, it is natural that the time they spend with vector
graphics is limited. Nevertheless, the instruction needs
to be systematic. However, the difficulty of a graphic
object should be adequate to the pupil’s age. The
method of creating shapes can be used in vector
graphics instruction.
3.5.1 Creating Graphic Objects through the
Use of Basic Shapes
The basic and at the same time easiest way to create
graphic objects is using a tool for creating geometric
shapes which is part of every graphic editor. The
following picture shows the basic shape of circles (no
further changes are required).
CSEDU 2019 - 11th International Conference on Computer Supported Education
470
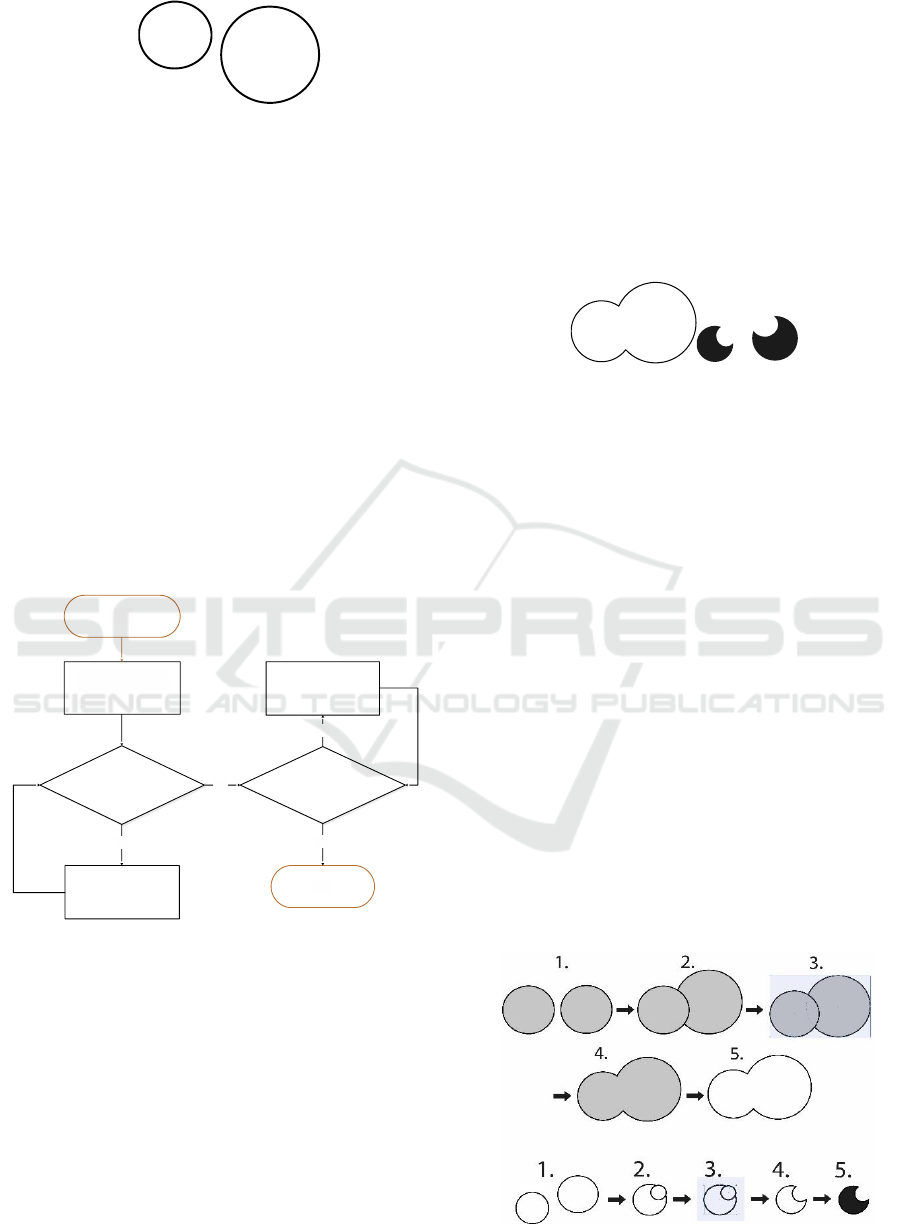
Figure 11: Basic shape of circles.
A verbal description of an algorithm for creating
graphic objects using a tool for creating basic shapes is
one of the ways of using algorithmization for
interpreting a process that leads to a solution:
1. Use the tool for creating basic shapes (in this case,
it is a tool for creating circles) to create the basic
shape of an object.
2. Does the shape of the correct size/ position/
proportion? (If not, activate the selection tool to
change the shape’s size and/or position and/or
proportion; If so, proceed to step 3)
3. Has the shape of well-defined contour and filling?
(If not, use the selection tool and define the contour
and filling of object, then repeat step 3).
The default assumption of each algorithm is a new
document (referred to as canvas), in which the situation
is drawn.
A flowchart does not require any conditions. It could
look as follows:
Figure 12: A flowchart – Case 1.
Since the algorithm is trivial, it would be
meaningless to express it through a visual instruction.
It would be more difficult to create an interestingly
shaped object (which could be accomplished by using
more elements to create a single object).
3.5.2 Creating Graphic Objects through
Mathematical Operations
Another way to create graphic objects is to use the
Pathfinder tool to create shapes that consist of two or
more objects through mathematical operations. Those
are:
Unification,
Difference,
Intersection,
Exclusion,
Division.
When solving a problem, graphic sub-elements
representing an image could be created this way. The
images are created by unifying (the left image) and
differentiating (the right image) two circles.
Figure 13: Object as compound shape.
The following verbal expression for an algorithm
can be used when creating graphic objects through
Boolean algebraic operations where node anchor
points do not need to be changed:
1. Use the tool for creating shapes to create the
required number of the object’s basic shapes.
2. Is the shape the correct size/ position/ proportion?
(If not, activate the selection tool and edit the size/
position or proportion of the object; if so, proceed
to step 3).
3. Apply the selection tool for multiple selection of all
objects.
4. Apply the specific logical mathematical operations
tool.
5. Is the shape of well-defined contour and filling? (If
not, activate the selection tool and define the
contour and filling the shape).
When drawing two or more homogenous objects
(e.g. circles), Step 1 can be generalized by using he
command “duplicate”.
The following set of images can be used to describe
the aforementioned process:
Figure 14: Compound shapes – Pathfinder.
Start
Activate the tool for
create a basic shape
and draw the shape.
End
Activate the selection
tool and edit the size/
position or proportion.
Does the shape
of the correct size/ position/
proportion?
Yes
Has the shape of
a well-defined color fill and
outline?
Activate the selection
tool and define the
color fill and outline.
Yes
No
No
Algorithmization in a Computer Graphics Environment
471
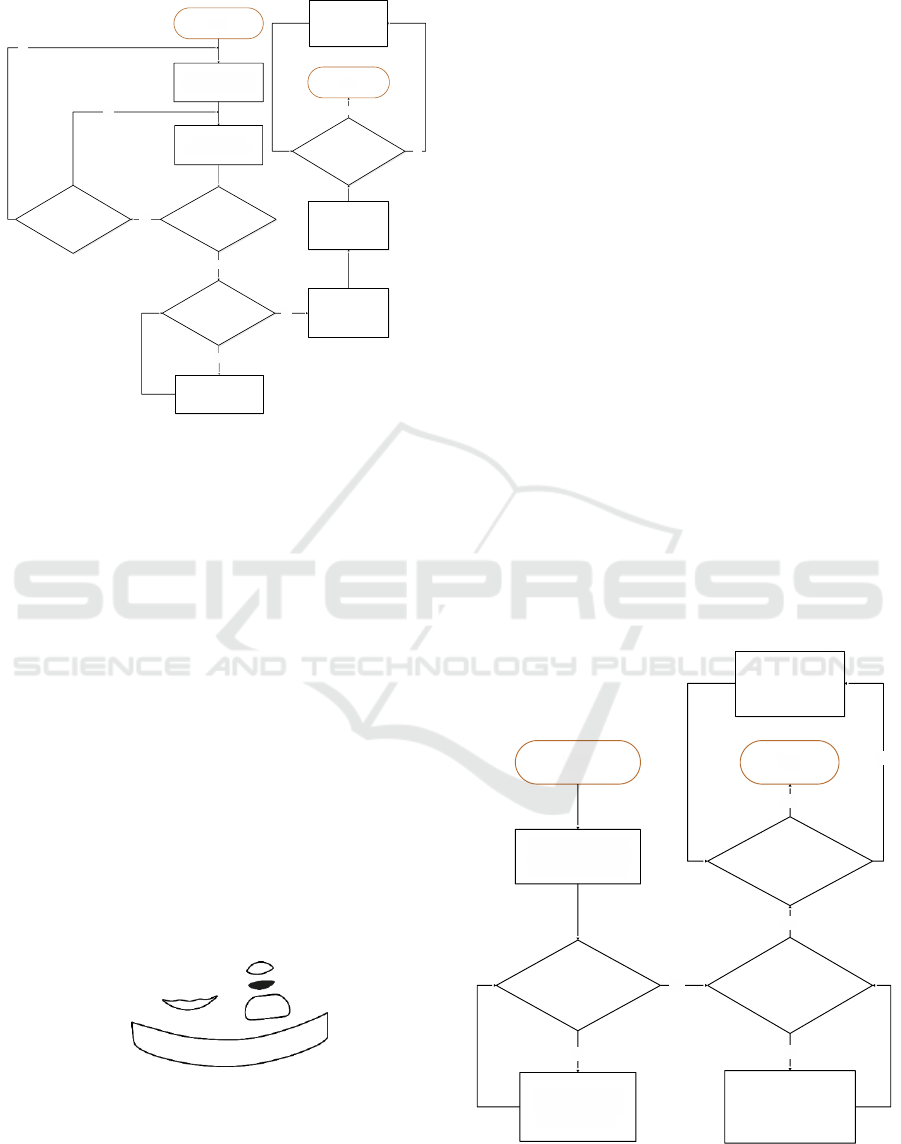
The flowchart may take the following form.
Figure 15: A flowchart – Case 2.
3.5.3 Creating Graphic Objects through the
Use of Tool for Creating and Modifying
Node Points
There is also a third way of creating graphic objects
where it is necessary to modify anchor points in the
path segment in order for the curve to have the required
shape. The Layout of anchor and control points affects
the resulting shape of the object. Using the Direct
Selection tool, we can modify the position of the nodes,
convert the smooth node to the anchor (and vice versa),
or change the number of nodal points that are in the
path of the object. Most graphics software has the
function of adding new or removing the original
anchor point as a separate feature (e.g. Adobe
Illustrator). Conversely, for example, Inkscape allows
you to insert a new node on the path where you double-
click the mouse. In order to simplify this process
generalize and call this an "Edit path nodes" using the
Direct Selection tool. For this case, consider these
shapes.
Figure 16: Object with modified anchor points.
This option includes sub-elements and therefore
requires experience in vector graphics on the user’s
part. The following is a flowchart describing the
aforementioned situation.
The creation of a graphic object can be described
by an algorithm (see Figure 17) for creating and
modifying the basic shape through a transformation of
anchor points:
1. Activate the required tool for create a shape and
draw a basic shape.
2. Does the shape have the desired shape? (If so,
proceed to step 3; if not, activate the Direct
Selection tool and edit path nodes, then repeat the
step 2).
3. Does the shape of the correct size/ position/
proportion? (If not, activate The Selection tool
and edit the size/ position or proportion of the
graphics object; if so, proceed to step 4).
4. Has the shape of well-defined color fill and
outline? (If not, activate the selection tool and
define the color fill and outline of object).
By dividing an illustration into graphic sub-
elements (sequential steps), the pupil learns of how
many shapes the final illustration will consist (see Fig.
18).
Naturally, sometimes a situation may occur when
one needs to combine all four methods. However, such
a situation would require experience beyond that of an
elementary school pupil.
This algorithm may show discrepancies, depending
on the software used. This case is designed for
Inkscape. The form of the flowchart could be the
following:
Figure 17: A flowchart – Case 3.
Start
Activate the tool for
create a basic shape.
The shape will be
the same as the previous
shape.
You need to draw
another basic shape?
Yes
Yes
Activate the selection
tool and edit the size/
position or proportion.
No
End
Draw the basic
shape of the object.
No
Does the sha pe
of the correct si ze/ position/
proportion?
No
Yes
Activate the
selection tool and
select all created
shapes.
Activate a tool
Pathfinder and
select a specific tool.
Has the shape of
a well-defined color fill and
outline?
Yes
Activate the
selection tool and
define the color fill
and outline.
No
Start
Activate the tool for
create a basic shape
and draw the shape.
Does the object have
the desired shape?
Yes
No
Activate the selection
tool and edit the size/
position or proportion.
Does the shape
of the correct size/ position/
proportion?
End
No
Activate the direct
selection tool and
edit path nodes.
Yes
Has the shape of
a well-defined color fill and
outline?
Activate the
selection tool and
define the color fill
and outline.
Yes
No
CSEDU 2019 - 11th International Conference on Computer Supported Education
472

Figure 18: Process of transforming objects by modifying
nodes.
ACKNOWLEDGEMENTS
This paper was supported by the Student Grant
Competition of the University of Ostrava. Project
Title: Using interactive learning objects to develop
problem-solving competencies.
4 CONCLUSION
The paper is aimed at algorithmic description of the
process of creating vector graphics through the method
of drawing geometric shapes. This method can be used
in elementary school instruction when pupils work
with predefined shapes such as circles, squares,
rectangles, polygons, etc.
The presented methods were algorithmically
described using a verbal algorithm, a flowchart and
visual instructions. Computer graphics instruction can
benefit from all these methods as they complement one
another. While a verbal description of an algorithm
provides information about the process and the tool,
visual instructions provide information about the
results of individual steps, i.e. they capture the process
of the transformation of the basic shape into the
required shape.
Even though elementary school pupils have no
previous experience with vector graphics, they should
be encouraged to develop their algorithmic thinking.
The pupil should be able to analyze a problem, divide
it into sub-problems and use their creative thinking to
find a solution. Moreover, they should further develop
their creative skills in the next stages of education.
REFERENCES
Being Fluent With Information Technology by the National
Research Council, 1999. National Academy Press.
Washington. Available at: https://www.uio.no/
studier/emner/matnat/ifi/INF3280/v12/undervisningsm
ateriale/BeingFluentWithIT.pdf
Dannhoferova, J., 2012. Velká kniha barev: kompletní
průvodce pro grafiky, fotografy a designéry. ISBN 978-
80-251-3785-7.
Dvořáková, Z., 2008. DTP a předtisková příprava:
kompletní průvodce od grafického návrhu po
profesionální tisk, Brno: Computer Press. ISBN 978-
80-2511881-8.
Futschek, G., 2006. Algorithmic Thinking: The Key for
Understanding Computer Science. In Informatics
Education – The Bridge between Using and
Understanding Computers. Lecture Notes in Computer
Science. Berlin, Heidelberg: Springer Berlin
Heidelberg, pp. 159-168.
Glitschka, V., 2013. Vector: basic training. Brno: Computer
Press. ISBN 978-80-251-4129-8.
Lessner, D., 2014. Informatika pro každého. [Online].
Available at: https://popelka.ms.mff.cuni.cz/~lessner/
mw/index.php/U%C4%8Debnice/Algoritmus/V%C3
%BDvojov%C3%A9_diagramy
Lieng, H., 2017. A probabilistic framework for component-
based vector graphics. Computer Graphics Forum
[online]. 36(7), 195-205. DOI10.1111/cgf.13285. ISSN
01677055.
Keliwood.cz, 2012. Paper swallow - instructions. In
Keliwood. Available at: https://www.keliwood.cz/akt
uality/papirova-vlastovka-navod.
Kopayev, V., O., 2018. Algorithm as a model of algorithmic
process. [Online]. Available at: http://www.ii.npu.
edu.ua/files/Zbirnik_KOSN/6/21.pdf
Krček, B., Kreml, P., 1993. Algoritmizace a programování
v jazyku Pascal. 1. vyd. Ostrava: VŠB – Technická
univerzita.
MŠMT: Rámcový vzdělávací program pro základního
vzdělávání, 2017. Prague.
Online Etymology Dictionary, 2018. Algorithm [online].
Lancaster. Available at: http://www.etym
online.com/index.php?term=algorithm
Pervin, Y., A., 2007. Encyclopedia of Computer Science
Teacher, 11.
Procházková, J., Vitásek, V. and D. Martišek, 2007.
Počítačová grafika a geometrie. Available at: http://
mathonline.fme.vutbr.cz/pg/flash/hlavniStranka.html
Pšenčíková, K., 2009. Algoritmizace. 2. vyd. Kralice na
Hané: Computer Media.
Snyder, L., 2000. Interview by Olsen, F.: Computer
Scientist Says all Students Should Learn to Think
’Algorithmically’. The Chronicle of Higher Education.
Available at: https://www.chronicle.com/article
/Computer-Scientist-Says-All/29778
Španěl, M., 2013. Základy počítačové grafiky. Brno.
Umenie kreativity, 2018. Čo je to vývojový diagram a ako
ho tvoriť [online]. Available at: https://www.
umeniekreativity.sk/vyvojovy-diagram/
Algorithmization in a Computer Graphics Environment
473
