
Quantifying Impacts of Connected and Autonomous Vehicles on
Traffic Operation using Micro-simulation in Dubai, UAE
Abdul Razak Alozi
a
and Khaled Hamad
b
Department of Civil and Environmental Engineering, University of Sharjah, Sharjah, U.A.E
Keywords: Connected and Autonomous Vehicles, Intelligent Transportation Systems, Traffic Operation,
Micro-simulation.
Abstract: Connected and Autonomous Vehicles (CAVs) will change the transportation system we know with their
substantial impacts on the level of safety, traffic operation, fuel consumption, air emissions among other
aspects. A large segment of the general public and decision makers are still sceptical of CAVs’ benefits and
impacts. This study aims at quantifying the impacts of CAVs on traffic operation using micro-simulation of
a 7-kilometer-freeway segment in Dubai, UAE. The simulation was run for different market penetration rates
(MPRs) ranging from 0% (no CAVs) up to 100% (all CAVs), in 10% increment. Additionally, multiple
scenarios under different traffic volumes were also modelled utilizing PTV VISSIM. To quantify the impacts
of CAVs, three performance measures were collected, namely the average delay, average speed, and total
travel time. The results showed that the highest impact of CAVs occurs in terms of delay, with a decreased
average delay of up to 86%. The other performance measures also show improvement, with 42% speed
increase and 25% travel time reduction. Moreover, CAVs show more significant changes at lower traffic
volume conditions (off-peak hour).
1 INTRODUCTION
As transportation engineering touches all kinds of
people and affects their everyday life, it requires an
extensive amount of research backing up the ever-
continuing development of this field. Both
researchers and engineers working in traffic-related
domains often get the opportunity to experience their
work first-hand and its implications for drivers,
commuters, or even pedestrians. Among the
developments that are coming relatively soon to our
roads are Connected and Autonomous Vehicles
(CAVs). The possible changes and impacts these
vehicles will have on people’s commute experiences
are countless.
Due to their significance and vital role in the lives
of the public, CAV impacts are expected to reach
numerous aspects. Some impacts will be directly
related to CAV technologies and applications like
safety, energy, and fuel consumption, while other
impacts will be a result of the side effects of the new
a
https://orcid.org/0000-0003-0694-1461
b
https://orcid.org/0000-0002-8110-1115
technology, like land use, public resilience, and other
social effects.
An essential element to study in the case of
connected vehicles is the transition period that will
span for a significant period of our future. In the
transition period, roads and networks will have to
accommodate both connected and conventional
vehicles with varying market shares. CAVs and
conventional vehicle interactions may lead to some
undesirable effects on their operation, limiting the
benefits of CAVs and even possibly affecting the
planners and decision-makers’ attitude towards
accepting CAVs.
Some commercial cars with autonomous features
already roam our streets and have been doing so since
1977 (Bertini et al., 2016) when first automated cars
followed a track of white striped lines on the road at
speeds of 20 mph. It is widely expected that CAVs
will be available on the mass market by 2022 to 2025
(Ye and Yamamoto, 2017).
The field of Intelligent Transportation Systems
(ITS) has become more popular in recent years. ITS
provide various users with real time information to
528
Alozi, A. and Hamad, K.
Quantifying Impacts of Connected and Autonomous Vehicles on Traffic Operation using Micro-simulation in Dubai, UAE.
DOI: 10.5220/0007753905280535
In Proceedings of the 5th International Conference on Vehicle Technology and Intelligent Transport Systems (VEHITS 2019), pages 528-535
ISBN: 978-989-758-374-2
Copyright
c
2019 by SCITEPRESS – Science and Technology Publications, Lda. All rights reserved

make safer and more intelligent decisions when using
the transport networks. They also implement
innovative services that are used in different modes
of transport management. In general, ITS have the
potential to improve safety, productivity, and
mobility of transportation performance which could
be achieved by traffic planners (Z. Yang and Pun-
Cheng, 2017).
Road vehicles have gradually become
technologically more advanced throughout the past
decades with a focus on advancing traffic operation
conditions vehicle safety and comfort. Although
vehicle automation has been on the horizon for just as
long, it is only since the turn of the century that it has
started to find its way into production vehicles
(Calvert et al., 2017).
With various levels of autonomous vehicle
technology from driver assist all the way to fully
automated driverless vehicles, the terminology used
to describe the automation applications must be clear.
For this purpose, the Society of Automotive
Engineers (SAE) sets out the taxonomy used when
discussing the levels of automation in their
international standard J3016 (Bradburn et al., 2017).
The findings will provide a comprehensive
understanding of road networks in the near future.
They will also serve as a strong basis for the vital
decisions that will be made to ensure the safest and
most beneficial methods of managing roads with
CAVs. Moreover, this study will cover a wide range
of CAV Market Penetration Rates (MPRs).
2 LITERATURE REVIEW
The literature provides different case studies and
simulation environments to analyze the impacts of
CAVs on traffic operation as well as other factors. As
the topic is relatively interesting to many researchers,
the amount of research into the topic is somewhat
extensive.
2.1 Traffic Operation Impacts
Research that studied the impacts on traffic
operations considered many performance measures.
Among these, Guler et al. (2014) studied the delay as
a performance measure and found that the increase in
MPR from 0% up to 60% has a significant impact on
reducing the average delay. This decrease in low
demand scenarios reaches up to 60%. After an MPR
of 60%, the rate of reduction decreases and the value
of information from connectivity technologies
diminishes (Ilgin Guler et al., 2014).
Shi and Prevedouros (2016) considered the effect
on Level of Service (LOS) and their findings
suggested that on a basic freeway segment the
autonomous vehicles improve LOS from D to C when
the MPR reaches 7%. The same case study shows that
the connected vehicles improve LOS from D to C
when the MPR reaches 3% (Shi and Prevedouros,
2016).
Moreover, the capacity difference was analyzed
by Ye and Yamamoto (2017) who found that the
capacity of the road increases as the CAV market
penetration rate increases in a shared road. However,
this increase is split between two phases, at MPRs
lower than 30%, the road capacity increases slightly.
After 30% MPR, the in-crease in capacity is largely
determined by the level of automation, with higher
levels of automation achieving higher capacity
increase (Ye and Yamamoto, 2017).
2.2 Other CAV Impacts
Different studies considered the impacts on different
aspects including the safety impact which was
considered by Yang et al. (2017) who discovered that
when the MPR reaches 25%, the risk of secondary
crashes can be reduced by up to 33% under high-
volume conditions. Additionally, if the traffic
volumes are high, risk of secondary crashes can be
reduced by about 10% at low MPR levels of around
5%. However, the benefit of CAVs would not be
notable under low-volume conditions (H. Yang et al.,
2017).
When considering the effect on greenhouse gas
emissions, Wadud et al. (2016) suggested that
automation might plausibly reduce road transport
GHG emissions and energy use by nearly half
depending on which effects come to dominate. In
addition, many potentials for energy reduction
benefits may be realized first under partial
automation, while the major energy downside risks
appear more likely at full automation (Wadud et al.,
2016).
The impacts of CAV technologies even reach land
use as Zhang et al. (2015) concluded the possibility to
eliminate 90% of parking demand for clients who
adopt the new systems, at a low MPR of 2%. Also,
different Shared Autonomous Vehicle (SAV)
operation strategies and client’s preferences may lead
to different spatial distribution of urban parking
demand (Zhang et al., 2015)
Quantifying Impacts of Connected and Autonomous Vehicles on Traffic Operation using Micro-simulation in Dubai, UAE
529

Figure 1: Study area.
3 METHODOLOGY
Towards achieving our objective, the following three
main steps were undertaken: (1) build the roadway
geometry and calibrate CAV modelling, (2) prepare
and test simulation scenarios; and (3) analyze traffic
operation parameters.
To quantify the impacts of CAVs, the most widely
used approach is micro-simulation, which provides a
commonly acceptable prediction tool that helps in
understanding the behavior of both CAVs and
conventional vehicles on roadway networks once
they become reality. Micro-simulation also reveals all
the possible outcomes of proposed scenarios and
approaches to implement the new technologies. The
latest version of PTV VISSIM (version 11) was
utilized to develop and run the simulations. This state-
of-the-art software provides the most advanced
virtual test bed to carry out and test the objectives of
this study.
3.1 Study Area
The chosen freeway segment shown in Figure 1 of
Sheikh Mohammad Bin Zayed road (E311) spans
seven kilometers of five lanes in each direction. This
roadway segment connects the two cities of Dubai
and Sharjah and experiences high traffic demand
compared to other freeways. It has three interchanges
of the following types: clover-leaf, fully directional,
and semi directional ramp with loops.
The geometry of the freeway segment was
modeled in PTV VISSIM spanning seven kilometers
shown in Figure 2 The model has reduced speed areas
at ramps and loops of the interchanges to reflect
human driving behaviour.
3.2 Model Development and
Calibration
For the purpose of this study, two levels of calibration
had to be followed: (1) calibrate the driver behaviour
to reflect local freeway conditions. (2) calibrate the
predicted behaviour of CAVs to ensure realistic
forecasting of their impacts.
Three sub-models control the simulation process
of the driver behavior in VISSIM: car-following
model, lane changing model, and lateral behavior
within a lane. The parameters of these model were
modified as well as conflict resolution behaviour.
The simulation results were compared with field
measurements to determine how close the simulation
model emulates field conditions. Two validation
measures of effectiveness were collected, namely the
delay and Level of Service (LOS) measurements and
two input values were finely tuned to reach accurate
performance of the model namely, the standstill
distance (CC0) and the headway (CC1).
VEHITS 2019 - 5th International Conference on Vehicle Technology and Intelligent Transport Systems
530

Figure 2: Freeway segment model in PTV VISSIM.
We used additional attributes in the driving
behavior dialog of PTV VISSIM to model the
predicted performance of CAVs. The car following
model in VISSIM is based on the continued research
of Wiedemann. In the 2018 version of PTV VISSIM,
the Wiedemann 99 model is utilized and it consists of
ten calibration parameters that have been modified to
reflect CAV behavior.
In addition, a few other parameters were activated
which do not fall under the car following main
parameters:
• Enforced absolute braking distance was activated
(a.k.a. brick wall distance), meaning vehicles
using this driving behavior will always make sure
that they could brake without a collision, if the
leading vehicle comes to an immediate stop (turns
into a brick wall). This condition applies also to
lane changes (for the vehicle itself on the new lane
and for the trailing vehicle on the new lane) and
to conflict areas (for the following vehicle on the
major road).
• The attribute to use implicit stochastics was
disabled; a vehicle using this driving behavior
does not use any internal stochastic variation that
is meant to model the imperfection of human
drivers.
• For all distributions which cannot be explicitly set
by the user, a median value was used instead of a
random value within a range to reflect consistency
of CAV behaviour as opposed to human drivers.
This affects the safety distance, the desired
acceleration, and uncertainty for braking
decisions.
3.3 Considerations and Assumptions
After calibrating the input values (mentioned in
section 3.2), the following assumptions of speed and
geometry were made:
• 5-lanes per direction for the main freeway
segment with operational speed of 120 km/h and
lane width of 3.6 m;
• 2-lanes per direction for the crossing arterial roads
with operational speed of 100 km/h and lane width
of 3.6 m;
• 2-lanes for the directional and semi-directional
left ramps with operational speed of 60 km/h and
lane width of 3.6m; and
• 1-lane for the loops and right ramps with lane
width of 3.6 m and speed of 40 km/h and 60 km/h,
respectively.
• Vehicle composition consists of 90% light
vehicles and 10% heavy vehicles.
For all other not mentioned parameters, we used PTV
VISSIM’s default values.
3.4 Scenario Formulation
Road users will not switch to CAVs all of a sudden,
instead they will start using them gradually as CAVs
become more desirable and reliable, and as the
standards and regulations become solid worldwide.
The period between first introduction of CAVs and
the time they become the main mode of transportation
is called the transition period in which traffic will be
a combination of conventional vehicles and CAVs,
passing through different market shares of CAVs of
market penetration rates (MPRs). For that reason, we
need to study the behavior and traffic flow during
Quantifying Impacts of Connected and Autonomous Vehicles on Traffic Operation using Micro-simulation in Dubai, UAE
531
each MPR. Some studies analyze low MPRs (0-25%)
because they investigate the early adoption conditions
(H. Yang et al., 2017), others use a wider range (0-
75%) (Z. Chen et al., 2016). The rest of the literature
in the field of CAV simulation use the full range of
MPR (0-100%) but with different increments
depending on their focus (Y. Chen et al., 2017;
Talebpour & Mahmassani, 2016; K. Yang et al.,
2016; Ye & Yamamoto, 2017).
In this study, we chose to cover the full range of
MPR from 0% to 100% CAVs with 10% increment.
This range was used to analyze traffic operation at
every stage. After calibrating the model, the eleven
scenarios of MPR were formulated.
Table 1: Traffic volume combinations.
Scenario ID
Major Road
LOS
Minor Road
LOS
1. BB LOS B LOS B
2. BD LOS B LOS D
3. BE LOS B LOS E
4. DB LOS D LOS B
5. DD LOS D LOS D
6. DE LOS D LOS E
7. EB LOS E LOS B
8. ED LOS E LOS D
9. EE LOS E LOS E
Furthermore, for each one of the MPR scenarios
different traffic volume conditions were studied. The
traffic volume effect was analyzed using traffic
condition combinations between the major freeway
and the minor intersecting roads. Based on three LOS
conditions: B, D, and E, the volume per lane was
determined, and then multiplied by the number of
lanes for each road. The following nine combinations
of LOS listed in Table 1 were used.
For each scenario multiple runs were used with
different seed numbers to eliminate randomness of
the model.
The total number of scenarios and number of
required runs for each one was determined as follows:
Scenarios = 11MPRs × 9volumecombinations
Scenarios = 99scenario
Runs = 99scenarios × 5runsperscenario
Runs = 495simulationruns
To extract the results, the average of the middle
three runs was considered for each scenario.
4 RESULTS AND DISCUSSION
The results of our analysis are summarized in three
performance measures: average delay, average speed,
and total travel time. The results for each measure
under the nine scenarios (from Table 1) are
summarized in a single chart which shows the MPR
on the x-axis and the percent change (increase or
reduction) in the performance measure computed
relative to the 0% MPR level.
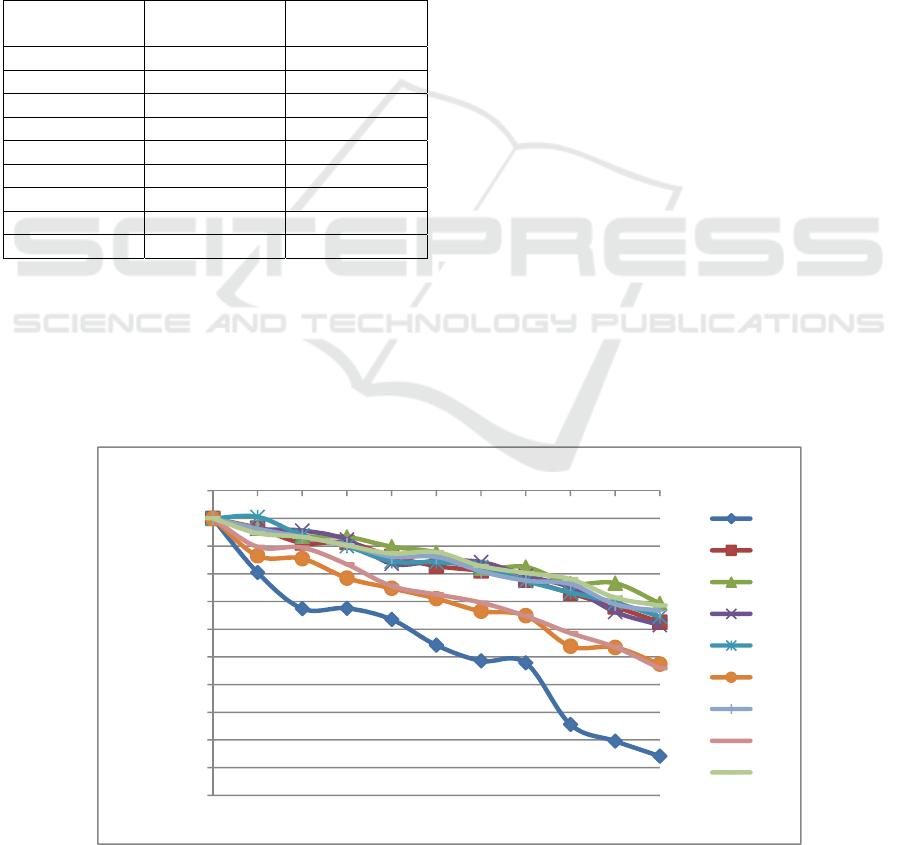
4.1 Average Delay Results
Figure 3 shows the results of the average delay for all
scenarios. It shows that the reduction in average delay
is substantial reaching up to 86% in the best case with
LOS B on both major and minor roads and 100%
MPR. In all traffic volume combinations, the highest
reductions in delay happen during initial stages of
Figure 3: Average delay results.
-100%
-90%
-80%
-70%
-60%
-50%
-40%
-30%
-20%
-10%
0%
10%
0% 10% 20% 30% 40% 50% 60% 70% 80% 90% 100%
% Reduction in Average Delay
CAV Market Penetration Rate
BB
DD
EE
BD
BE
DB
DE
EB
ED
VEHITS 2019 - 5th International Conference on Vehicle Technology and Intelligent Transport Systems
532
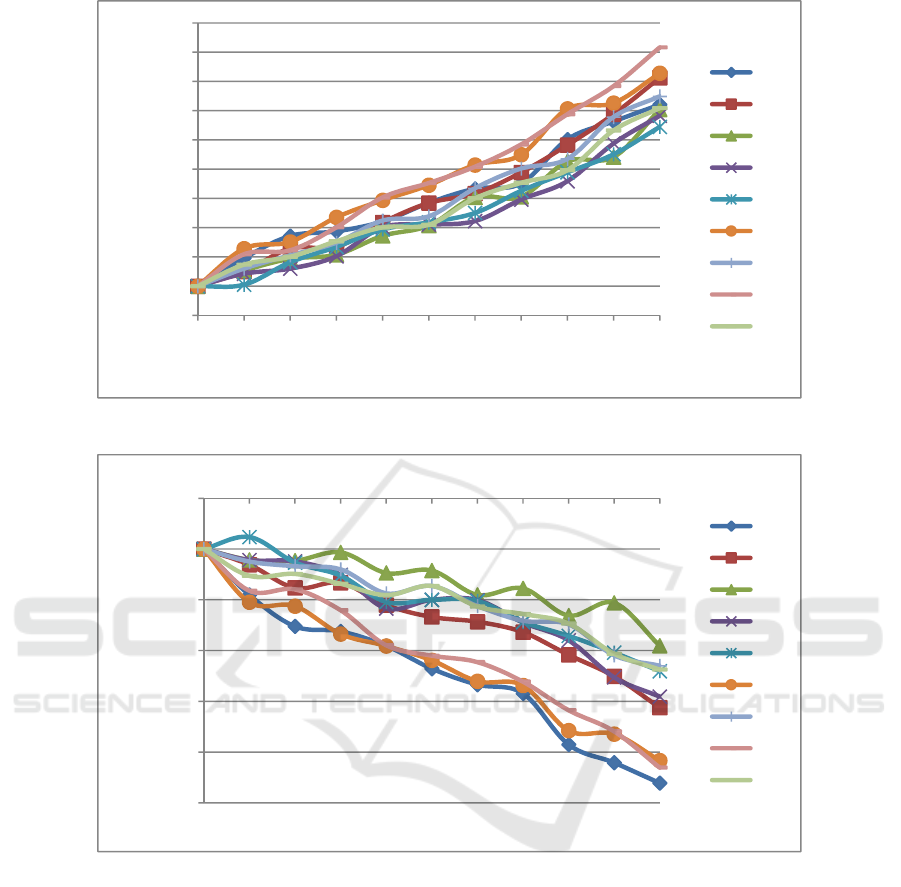
Figure 4: Average speed results.
Figure 5: Total travel time results.
CAV utilization (0% to 20% CAVs) and right before
full automation (70% to 80% CAVs). The bulk of the
transition period between 20% and 70% has lower
effects on average delays with a total of 17%
reduction in the best-case scenario.
It’s
also clear that the benefits of CAVs are mag-
nified in low traffic flow conditions (off-peak hour);
this is apparent with the biggest reductions in delay
happening at LOS B on the minor road and especially
in the case of highest LOS on both major and minor
roads.
4.2 Average Speed Results
Figure 4 shows the results of the average speed which
follow a clear trend of increase ranging from 25% to
40%. The highest impact reaches over 40% increase
in average speed with 100% MPR and LOS E on
major road and B on minor road. The overall trend is
clear, showing a steady rise in speed with the
automation takeover. The results of different traffic
volumes are somewhat similar; meaning that speed
increases in all conditions (peak hour and off-peak
hour).
The difference between the results of the two
performance measures: average delay and average
speed show that the delay is highly affected by the
traffic volume variation. Average delay results show
a huge decrease at higher MPRs under low traffic
volume conditions. This observation is not apparent
-5%
0%
5%
10%
15%
20%
25%
30%
35%
40%
45%
0% 10% 20% 30% 40% 50% 60% 70% 80% 90% 100%
% Increase in Average Speed
CAV Market Penetration Rate
BB
DD
EE
BD
BE
DB
DE
EB
ED
-25%
-20%
-15%
-10%
-5%
0%
5%
0% 10% 20% 30% 40% 50% 60% 70% 80% 90% 100%
% Reduction in Total Travel Time
CAV Market Penetration Rate
BB
DD
EE
BD
BE
DB
DE
EB
ED
Quantifying Impacts of Connected and Autonomous Vehicles on Traffic Operation using Micro-simulation in Dubai, UAE
533

in average speed results, where the difference is not
affected by different volume scenarios (except for a
slight variation).
4.3 Total Travel Time Results
Figure 5 shows the results of the total travel time. The
overall trend is a clear reduction in travel time with
the increase of CAV shares ranging from 10% to
24%. Moreover, the graph shows big variations
between different traffic flow conditions in terms of
total travel time. The benefit gets to almost 24%
reduction in total travel time for LOS B on both major
and minor roads at 100% MPR, this enforces the
outcome that CAV benefits become more significant
at low traffic volumes.
At high traffic volumes (LOS E on major road and
LOS E on minor road), the reduction in travel time
becomes turbulent. Although the overall trend is a
reduction of 10% in travel time, the results at lower
MPRs show sometimes a slight increase; this could
be a result of oversaturation of the network which
causes long queues filling the whole segment.
5 CONCLUSION
In this paper, the impacts of Connected and
Autonomous Vehicles (CAVs) were studied and
evaluated using micro-simulation. The driver
behavior, car following, and lane changing models
were modified to reflect the behavior of CAVs in the
widely-used simulation tool, i.e. PTV VISSIM. Three
performance measures were collected, namely the
average delay, average speed, and total travel time.
These measures were used to compare the traffic
operation under nine different traffic scenarios. Each
of these scenarios was evaluated for eleven market
penetration rates, ranging from 0% (no CAVs) to
100% (all CAVs). The results can be summarized as
follows:
• The highest benefit of CAVs is reduced average
delays reaching up to 86% reduction during off-
peak hour conditions.
• Average speed reduction is not affected by traffic
volume; as all volume conditions experience
somewhat the same change.
• Total travel time reflects the same effect of traffic
volume as the average delay (more benefit at
lower volumes). However, this effect is lower;
reaching up to 23% reduction.
• The highest benefits of CAVs are observed in two
stages; first stage at 0% to 20% MPR, and second
stage at 70% to 80% MPR.
• The benefits of CAVs are not realized at the same
rate as their market share increases. This is
probably due to the interactions between regular
vehicles and CAVs. These interactions cause
driver confusion in regular vehicles as well as
sudden and unnecessary breaking by CAVs in
some situations, like unexpected lane changes,
aggressive driving, or weaving movement.
• Overall, CAV technologies and their utilization
show more significant changes at lower traffic
volume conditions (off-peak hour). This point
matches the findings of similar studies in other
regions of the world.
These findings could help decision-makers to
understand the expected impacts of CAVs from a
traffic operation perspective and could help plan for
the adoption of these new vehicles in a way that
ensures the highest benefit and lowest risk before they
are introduced to the mass market.
The authors recommend further studies to expand
on the topic by including more performance measures
to evaluate the impacts of CAVs. Another possibility
is to investigate the effect of different strategies like
dedicated CAV lanes for example.
Change is coming to us whether we like it or not,
CAV technologies will affect all levels of society in
their daily commutes. Therefore, it is crucial to grasp
the limitations and different impacts of the vehicles
of the future.
ACKNOWLEDGEMENT
The authors would like to acknowledge the support of
the Emirates Islamic Bank in this research study.
REFERENCES
Bertini, R. L., Wang, H., Borkowitz, T. M., and Wong, D.
H. (2016). 2015 Automated Vehicle Literature Review
as Part of Preparing a Possible Oregon Road Map for
Connected Vehicle/Cooperative Systems Deployment
Scenarios.
Bradburn, J., Williams, D., Piechocki, R., and Hermans, K.
(2017). Connected & Autonomous Vehicles:
Introducing the Future of Mobility. Borden Ladner
Gervais, 573–593. https://doi.org/10.1126/science.
aal2546
VEHITS 2019 - 5th International Conference on Vehicle Technology and Intelligent Transport Systems
534

Calvert, S. C., Schakel, W. J., and Lint, J. W. C. Van.
(2017). Will Automated Vehicles Negatively Impact
Traffic Flow ?, 2017.
Chen, Y., Gonder, J., Young, S., and Wood, E. (2017).
Quantifying autonomous vehicles national fuel
consumption impacts: A data-rich approach.
Transportation Research Part A: Policy and Practice,
(xxxx). https://doi.org/10.1016/j.tra.2017.10.012
Chen, Z., He, F., Zhang, L., and Yin, Y. (2016). Optimal
deployment of autonomous vehicle lanes with
endogenous market penetration. Transportation
Research Part C: Emerging Technologies, 72(2016),
143–156. https://doi.org/10.1016/j.trc.2016.09.013
Ilgin Guler, S., Menendez, M., and Meier, L. (2014). Using
connected vehicle technology to improve the efficiency
of intersections. Transportation Research Part C:
Emerging Technologies, 46, 121–131.
https://doi.org/10.1016/j.trc.2014.05.008
Shi, L., and Prevedouros, P. (2016). Autonomous and
Connected Cars: HCM Estimates for Freeways with
Various Market Penetration Rates. Transportation
Research Procedia, 15, 389–402.
https://doi.org/10.1016/j.trpro.2016.06.033
Talebpour, A., and Mahmassani, H. S. (2016). Influence of
connected and autonomous vehicles on traffic flow
stability and throughput. Transportation Research Part
C: Emerging Technologies, 71, 143–163.
https://doi.org/10.1016/j.trc.2016.07.007
Wadud, Z., MacKenzie, D., and Leiby, P. (2016). Help or
hindrance? The travel, energy and carbon impacts of
highly automated vehicles. Transportation Research
Part A: Policy and Practice, 86, 1–18.
https://doi.org/10.1016/j.tra.2015.12.001
Yang, H., Wang, Z., and Xie, K. (2017). Impact of
connected vehicles on mitigating secondary crash risk.
International Journal of Transportation Science and
Technology, 6(3), 196–207. https://doi.org/10.1016/
j.ijtst.2017.07.007
Yang, K., Guler, S. I., and Menendez, M. (2016). Isolated
intersection control for various levels of vehicle
technology: Conventional, connected, and automated
vehicles. Transportation Research Part C: Emerging
Technologies, 72, 109–129. https://doi.org/10.1016/
j.trc.2016.08.009
Yang, Z., and Pun-Cheng, L. S. C. (2017). Vehicle
detection in intelligent transportation systems and its
applications under varying environments: A review.
Image and Vision Computing, 69, 143–154.
https://doi.org/10.1016/j.imavis.2017.09.008
Ye, L., and Yamamoto, T. (2017). Modeling connected and
autonomous vehicles in heterogeneous traffic flow.
Physica A: Statistical Mechanics and Its Applications,
490, 269–277. https://doi.org/10.1016/j.physa.2017.
08.015
Zhang, W., Guhathakurta, S., Fang, J., and Zhang, G.
(2015). Exploring the impact of shared autonomous
vehicles on urban parking demand: An agent-based
simulation approach. Sustainable Cities and Society,
19, 34–45. https://doi.org/10.1016/j.scs.2015.07.006.
Quantifying Impacts of Connected and Autonomous Vehicles on Traffic Operation using Micro-simulation in Dubai, UAE
535
