
How to Make Learning Visible through Technology: The eDia-Online
Diagnostic Assessment System
Gyöngyvér Molnár
1
and Benő Csapó
2
1
Department on Learning and Instruction, Research Group on Learning and Instruction, University of Szeged,
Petőfi S. sgt. 30-34., Szeged, Hungary
2
MTA-SZTE Research Group on the Development of Competencies, University of Szeged, Szeged, Hungary
Keywords: Technology-based Assessment, Diagnostic Assessment, Assessment for Learning, Item Banking.
Abstract: The aims of this paper are: to show how the use of technology and the power of regular feedback can support
personalized learning. The paper outlines a three-dimensional model of knowledge, which forms the
theoretical foundation of the eDia system, it summarizes how results from research on learning and instruction,
cognitive sciences and technology-based assessment can be integrated into a comprehensive online system,
and it shows how such assessment can be implemented and used in everyday school practice to make learning
visible, especially in the fields of mathematics, reading and science. The eDia system contains almost 20,000
innovative (multimedia-supported) tasks in the fields of mathematics, reading and science. A three-
dimensional approach distinguishes the content, application and reasoning aspects of learning. The sample
for the experimental study was drawn from first- to sixth-grade students (aged 7 to 12) in Hungarian primary
schools. There were 505 classes from 134 schools (N=10,737) in the sample. Results confirmed that
technology-based assessment can be used to make students’ learning visible in the three main domains of
schooling, independently of the grade measured. Item bank and scale-based assessment and detailed feedback
can be used to support learning in a school context.
1 INTRODUCTION
Like the regulation of any complex system, feedback
plays a crucial role in educational processes as well
(Hattie and Timperley, 2007). The idea of using
assessment and feedback to make learning visible was
introduced by John Hattie. He synthesized results
from more than 800 meta-analyses and concluded that
taking students’ diversity and teachers’ capacity into
account and providing students and teachers with
proper feedback represent a very difficult and
challenging task (Hattie, 2012). The present paper
introduces the theoretical foundations and
realisations of such a technology-based, learning-
centred and integrated (Pellegrino and Quellmalz,
2010) assessment system, which undertakes to make
learning visible by providing students and teachers
regular feedback in the fields of reading, mathematics
and science through technology from the beginning
of schooling to the end of the six years of primary
education. The system has been developed by the
Centre for Research on Learning and Instruction,
University of Szeged. The eDia system supports and
integrates all assessment steps, including theory-
based item development, test administration, data
analyses, and an easy-to-use and well-interpretable
feedback module.
In this paper, we introduce and empirically
validate the theoretical foundation of the eDia system,
a three-dimensional model of learning that
distinguishes the disciplinary, application and
reasoning aspects of knowledge. We summarize how
technology-based assessment (TBA) became
mainstream over traditional testing and how the main
issues in the field of assessment have changed in the
last few decades, thus opening new possibilities and
raising new research questions regarding assessment:
e.g. how TBA makes it possible to measure new,
complex constructs, which are impossible to measure
with traditional assessment techniques; how TBA can
support personalized learning; and how contextual
information can be used for a significantly better
understanding of the phenomenon under examination
or for providing more elaborated feedback for
teachers on their students’ cognitive development
beyond the simple test score.
122
Molnár, G. and Csapó, B.
How to Make Learning Visible through Technology: The eDia-Online Diagnostic Assessment System.
DOI: 10.5220/0007754101220131
In Proceedings of the 11th International Conference on Computer Supported Education (CSEDU 2019), pages 122-131
ISBN: 978-989-758-367-4
Copyright
c
2019 by SCITEPRESS – Science and Technology Publications, Lda. All rights reserved
2 THEORETICAL
FOUNDATIONS: A
THREE-DIMENSIONAL
MODEL OF LEARNING
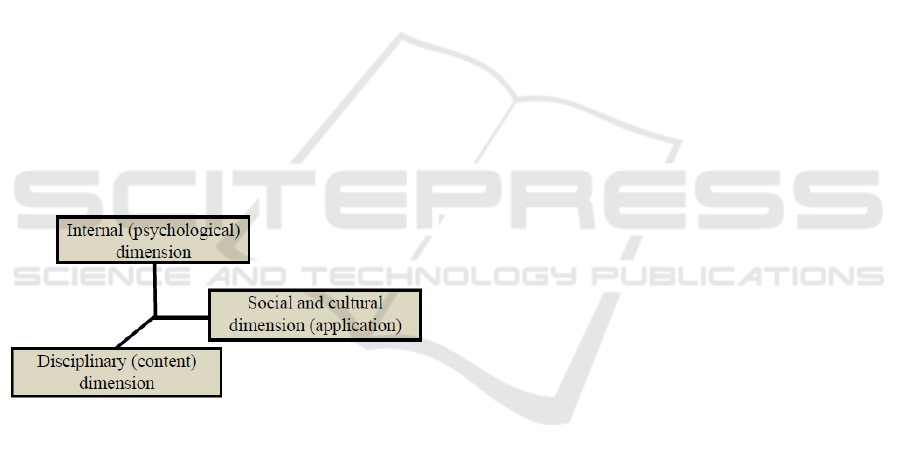
In the history of education, three goals, three main
approaches, have become clear from the very
beginning up to present-day schooling: (1) to educate
the intellect and cultivate general cognitive abilities;
(2) to increase the usability of knowledge acquired in
school outside the school context; and, finally, (3) to
teach content knowledge and elements of knowledge
accumulated within science to become familiar with
a given domain of culture (see Figure 1; Nunes and
Csapó, 2011). In past centuries, these goals have
competed with each other, a tendency which can also
be observed in the changing scope of large-scale
international assessment programmes. The first
prominent international assessment programme, the
Trends in International Mathematics and Science
Study (TIMSS), started in the 1970s. In its first
period, it dealt with the most commonly known
dimension of knowledge, curricular content, thus the
disciplinary dimension of knowledge. The major
source of this dimension is the content of the sciences,
which is part of school curricula.
Figure 1: The three-dimensional model of learning (based
on Molnár and Csapó, 2019).
Around the turn of the millennium, another
prominent large-scale assessment programme was
launched, the Programme for International Student
Assessment (PISA). It has been operated by the
OECD and shifted the focus of the most valuable
knowledge from the disciplinary to the application
dimension of knowledge by elaborating its
conception and defining the competencies students
need in a modern society.
There have been several attempts to assess the
third dimension of knowledge, which is reasoning, in
international large-scale assessment programmes. In
the TIMSS frameworks, reasoning is identified, and
there are tasks which assess this aspect of knowledge.
PISA took a major step when it integrated reasoning
into its assessment by choosing problem solving three
times (out of the seven data collection cycles until
2018) as a fourth, innovative domain.
In the approach on which the eDia is based, it is
assumed that the three aspects of learning described
above should be present at the same time in school
education. These goals should not compete for
teaching time, and they must not exclude each other;
they must reinforce and interact with each other.
Teaching only one of these dimensions of knowledge,
e.g. disciplinary content (which traditionally happens
in many education systems), is not satisfactory in
modern societies, where students are expected to
solve problems in unknown, novel situations, to
create new knowledge and to apply knowledge in a
broad variety of contexts (for a more elaborated
description of the model, see Csapó and Csépe, 2012,
for reading; Csapó and Szendrei, 2011, for
mathematics; and Csapó and Szabó, 2012, for
science).
3 TECHNOLOGY-BASED
ASSESSMENT: FROM
EFFICIENT TESTING TO
PERSONALIZED LEARNING
In past decades, educational assessment has been one
of the most dynamically developing areas in the field
of education. Traditional summative educational
assessment has focused on examining factual
knowledge and mostly neglects skills needed for life
in the 21st century. The development of information
and communication technology (ICT) has strongly re-
shaped society and given rise to new competence
needs (Redecker and Johannessen, 2013). To enhance
and foster these skills, new assessment was needed
which goes beyond testing factual knowledge and
provides meaningful and prompt feedback for both
learners and teachers. The realisation of this issue was
not possible with traditional assessment methods; a
qualitatively different kind of assessment was called
for. The OECD PISA assessments noted above have
had a major impact on this developmental process by
testing the preparedness of the participating countries
for TBA and adapting and testing new methods and
technologies in TBA.
The first step in this developmental process was
computer-based assessment (CBA) with first-
generation computer-based tests, thus migrating
items basically prepared for paper-and-pencil testing
to computer. Conventional static tests were
administered by computer with the advantages of
How to Make Learning Visible through Technology: The eDia-Online Diagnostic Assessment System
123

automated scoring and feedback (Molnár et al.,
2017). In the next stage of development, technology
was used, beyond providing automated feedback, to
change item formats and replicate complex, real-life
situations, using authentic tasks, interactions,
dynamism, virtual worlds, collaboration (second- and
third-generation computer-based tests; Pachler et al.,
2010; Molnár et al., 2017) to measure 21st-century
skills. Thus, the use of technology has strongly
improved the efficiency of testing procedures: it
accelerates data collection, supports real-time
automatic scoring, speeds up data processing, allows
immediate feedback, and revolutionizes the whole
process of assessment, including innovative task
presentation (for a detailed discussion of
technological issues, see Csapó, Lőrincz, and Molnár,
2012). In the 2010s, it was no longer debated; CBA
became mainstream over traditional testing.
It started a new direction in the development and
re-thinking of the purpose of assessment. Two new
questions arise: (1) how can we use assessment to
help teachers tailor education to individual students’
needs? And, thus, how can we use assessment for
personalized learning? And (2) how can information
gathered beyond the answer data (e.g. time on task
and repetition) be used and contribute to
understanding the phenomenon and learning process
under examination to provide more elaborated
guidance and feedback to learners and teachers
instead of using single indicators, such as a test score?
The development and scope of the eDia system,
which is in the focus of the paper, fits this issue and
the re-thinking of the assessment process. Among
other functions, the primary function of the system is
to provide regular diagnostic feedback for teachers on
their students’ development in the fields of reading,
mathematics and science from the beginning of
schooling to the end of the six years of primary
education and to allow significantly more realistic,
applications-oriented and authentic testing
environments to measure more complex skills and
abilities than are possible with traditional
assessments.
3.1 The eDia System
In its present form, the eDia online assessment system
is a technology-based, learning-centred and
integrated assessment system. It can be divided into
two parts: (1) the eDia platform, the software
developed for low-stakes TBA, using a large number
of items and optimized for large-scale assessment (up
to 60,000 students at exactly the same time); (2) the
item banks with tens of thousands of empirically
scaled items in the fields of reading, mathematics and
science.
The hardware infrastructure is based on a server
farm at the University of Szeged. The online
technology makes it possible for the eDia system not
only to be available in Hungary, but also to be used
for numerous assessment purposes in any country in
the world (for more detailed information, see Csapó
and Molnár, submitted).
The eDia system integrates and supports the
whole assessment process from item writing to well-
interpretable feedback. The easy-to-use item builder
module makes it possible to develop first-, second-
and third-generation tasks using any writing system.
(The eDia system has already been used to administer
tests in Chinese, Arabic and Russian, among other
languages.) Thus, the system can be used to measure
complex constructs requiring innovative item types,
new forms of stimuli, such as interactive, dynamically
changing elements (e.g. to measure problem solving
in the MicroDYN approach; Greiff et al., 2013;
Molnár and Csapó, 2018) or simulation-based items
(e.g. to measure ICT literacy; Tongori, 2018). A real
human–human scenario is also possible during data
collection (e.g. to measure collaborative problem
solving; Pásztor-Kovács et al., 2018). These complex,
mainly interactivity- and simulation-based item
formats have been used for research and assessments
beyond the diagnostic system, which is mainly based
on first- and second-generation computer-based
items, but the results will also be applied to diagnostic
assessments in the long term.
The item editing module of the system also
contains the scoring part of the tasks (a task can be
constructed of several items), which makes it possible
to employ different ways of scoring from very simple
task-level dichotomous scoring to very complicated
scoring methods, generally used by items with
multiple solutions (e.g. combinatorial tasks). This
scoring sub-module provides the information for the
automated feedback module of the system.
The eDia system is prepared for both automated
and human scoring as well. The automatic scoring
forms the basis for the immediate feedback provided
by the diagnostic assessments. Human scoring is
reserved for research purposes.
The test editing module of the system is
responsible for test editing, thus forming tests out of
the tasks in several ways. Tests can be constructed
with traditional methods (using fixed tests for
everybody in the assessment). They can also be
created out of different tests from previously fixed
booklets, thus eliminating the position effect and
optimizing anchoring within the tests (at the present
CSEDU 2019 - 11th International Conference on Computer Supported Education
124
stage of the system development, this function is used
for diagnostic assessments) or by using adaptive
testing algorithms and techniques to maximize the
amount of information extracted during testing by
minimizing the differences between test difficulty
level and students’ ability level.
The test delivery module for the software makes
it possible for tests administered in the eDia system
to be available on any device (e.g. desktop computer
and mobile tools) equipped with an internet browser.
The statistical analysis module for the system runs
the IRT-based scaling procedure of the items that
have already been administered and provides the
basis for the feedback used in the diagnostic
assessments. The computations are programmed
using the built-in modules of the open source ‘R’
statistical program. The databases for the diagnostic
assessments are large, comprising more than 250,000
rows and almost 80,000 columns so that it is
impossible to run analyses in a statistical program
outside the eDia system. The system has worked in
experimental mode since 2014, and the databases for
the diagnostic assessments contain the data for almost
70,000 students collected in a longitudinal form since
2014. Beyond the built-in statistical module, in the
case of non-diagnostic assessments, there is also the
possibility to export the data and run the analyses with
different statistical program packages, which are not
built into the system.
The feedback module of the system consists of
several layers for different types of feedback. In the
case of diagnostic assessments, all the tests and tasks
used can be scored automatically. Automatic scoring
makes immediate feedback possible; thus, in
diagnostic assessments, the system provides students
with immediate feedback on their achievement
immediately after the test has been completed. This
feedback is based mainly on percentages and
supported with visual feedback using 1 to 10 balloons
for the benefit of students in lower grades, where the
number of balloons is proportionate to achievement.
Teachers receive more elaborated feedback on
their students’ level of knowledge and skills than
simply achievement data. The teacher-level feedback
is IRT scale-based and norm referenced. The country-
level mean achievement in each domain and for each
grade is, by definition, set for 500 with a SD of 100.
The teacher-level feedback has two layers. One of
the layers contains mostly table-based feedback with
detailed information on students’ scale-based
achievement and a contextualized picture of the
whole class, as well as the mean achievement of other
members of the same age group in the entire school,
school district, region and country.
The second layer of feedback generates a .pdf
document for each student describing his or her
knowledge level both in numbers and web figures and
providing a detailed text-based description of his or
her knowledge and skill level in the different
dimensions of the three main domains.
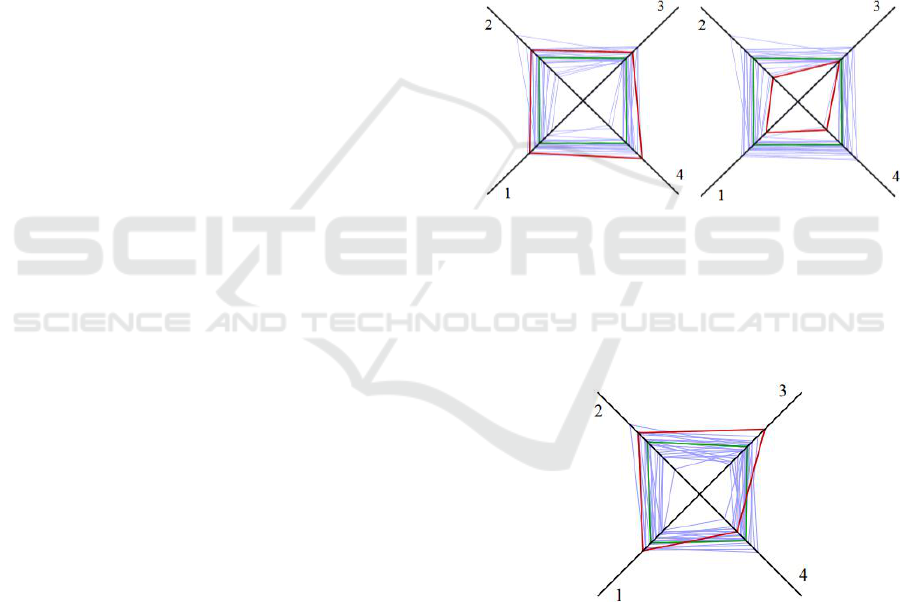
Figures 2 and 3 illustrate how the system
visualizes the norm reference-based student-level
feedback, the weakness and strength of the students
in the three domains and in the three dimensions of
knowledge within one of the domains. The web
figures do not contain exact numbers, but place the
IRT-scaled achievement in the context of different
reference data, such as achievement of other class
members and country-level mean achievement (see
e.g. Figures 2 and 3).
Figure 2: Visualization of the norm-referenced
developmental level of two students from the same class in
the three main domains of learning. (Numbers indicating
the different domains: 1: cumulative result; 2: mathematics;
3: reading; 4: science; thin blue lines: classmates’
achievement; green line: country-level mean achievement;
red line: students’ own achievement.).
Figure 3: Visualization of mathematics knowledge in the
three-dimensional approach. (Numbers indicating the
different dimensions: 1: cumulative result in the field of
mathematics; 2: knowledge level in the application
dimension; 3: level of content knowledge; 4: ability level in
the reasoning dimension; thin blue lines: classmates’
achievement; green line: country-level mean achievement;
red line: students’ own achievement.).
The numbers in Figure 2 indicate the different
domains (1: cumulative result; 2: mathematics; 3:
reading; 4: science), while numbers in Figure 3
How to Make Learning Visible through Technology: The eDia-Online Diagnostic Assessment System
125
represent the different dimensions of knowledge (1:
cumulative result in the field of mathematics; 2:
application dimension; 3: content knowledge; 4:
reasoning dimension). The lines in different colours
provide information on the students’ own
achievement (red line) and refers to this achievement
by visualizing classmates’ achievement (thin blue
lines) and the country-level mean achievement (green
line).
The second main component of the system, the
item bank, contains over 20,000 innovative
(multimedia-supported), empirically scaled tasks in
the fields of reading, mathematics and science. The
tasks are developed in the three-dimensional
approach of learning, distinguishing the disciplinary,
application and reasoning aspects of knowledge.
To sum up, the software is developed for low-
stakes TBA, using a large number of items and
optimized for large-scale assessments with automated
and detailed feedback. At present, it is used on a
regular basis in more than 1000 elementary schools
(approx. one-third of the primary schools in Hungary;
see Csapó and Molnár, 2017). In these schools, eDia
makes learning visible by providing students and
teachers regular feedback on their knowledge level in
the fields of reading, mathematics and science, among
other areas, based on the three-dimensional approach
in each domain.
4 THE IMPLEMENTATION OF
THE eDia SYSTEM IN
EVERYDAY SCHOOL
PRACTICE TO MAKE
LEARNING VISIBLE
4.1 Aims
In this study, we explore the possibilities of using
TBA in an educational context to make learning
visible. In the first part of the paper, we summarized
how results from research on learning and instruction,
cognitive sciences and TBA have been integrated into
a comprehensive online system, the eDia system, and
showed how the use of technology and the power of
feedback can support personalized learning. In the
empirical part of the paper, we aim: (1) to introduce
how the eDia system is used to make learning visible
in everyday school practice in the domains of reading,
mathematics and science in the three dimensions of
knowledge from the beginning of schooling to the end
of the six years of primary education; (2) to outline
the implementation of the three-dimensional model of
knowledge in the diagnostic assessment system; (3)
to test the relationship between disciplinary
knowledge, the applicability of school knowledge and
the reasoning aspect of knowledge, based on
students’ performance in all three main domains of
schooling; and (4) to test the appropriateness of the
item bank (especially of the more than 1500 items
involved in this study) of the eDia system.
4.2 Methods
4.2.1 Participants
The sample for the study was drawn from students in
Grades 1–6 (ages 7–12) in Hungarian primary schools
(N=10,896; see Table 1). School classes formed the
unit for the sampling procedure, 505 classes from 134
schools in different regions were involved in the
study, and thus students with a wide-ranging
distribution of background variables took part in the
data collection.
Table 1: The study sample.
Grade
Domain
Generally
R
M
S
1
722
720
496
1030
2
1049
1049
678
1351
3
1240
1287
852
1762
4
1580
1598
879
2148
5
1798
1941
1587
2476
6
1617
1535
1488
2129
Mean
8006
8130
5980
10896
Note: R: reading; M: mathematics; S: science.
The data collection happened within the confines
of the diagnostic assessments, using the eDia-system
in the elementary schools voluntary joint to the
partner schools of the eDia-system. The participation
in the study was also voluntary. The teachers had the
right to decide in which domain or domains to allow
their students to take the test; thus, not all students
completed the test in all three domains. The
proportion of boys and girls was about the same.
4.2.2 Instruments
The instruments for the implementation study were
based on the item bank developed for diagnostic
assessments. Almost 500 tasks were involved in the
study, meaning 543 items for reading, 604 items for
mathematics, and 492 items for science developed for
measuring first- to sixth-graders cognitive
development in the three dimensions of learning.
CSEDU 2019 - 11th International Conference on Computer Supported Education
126
One 45-minute test consisted of 50–55 items for
students in lower grades and 60–85 items for those in
higher grades. Each test contained tasks from the
three learning dimensions and for the vertical scaling
tasks, which were originally developed both for
students in lower and higher grades.
At the beginning of the tests, participants were
provided with instructions about the usage of the eDia
system, in which they can learn how to use the
program: (1) at the top of the screen, a yellow bar
indicates how far along they are in the test; (2) to
move on to the next task, they click on the “next”
button; (3) they click on the speaker if they want to
listen to the task instructions or other sounds included
in the task; and, finally, (4) after completing the last
task, they receive immediate feedback on their
achievement.
The test starts with warm-up tasks, differing
between students in lower and higher grades. At the
very beginning of the test, first- and second-graders
receive tasks which are suitable to practise
keyboarding and mouse skills.
Third- to sixth-graders receive tasks from the
chosen domain, which were originally developed for
students in lower grades (e.g. third-graders’ warm-up
tasks were originally developed for first- and second-
graders, and fourth-graders’ warm-up tasks were
developed for second- and third-graders).
Beyond the domain-specific warm-up tasks, the
much more difficult tasks administered at the very
end of the tests, typically developed for students in
higher grades, also support the possibility of vertical
scaling of the item bank (e.g. second-graders received
a few tasks, which were originally developed for
third-graders).
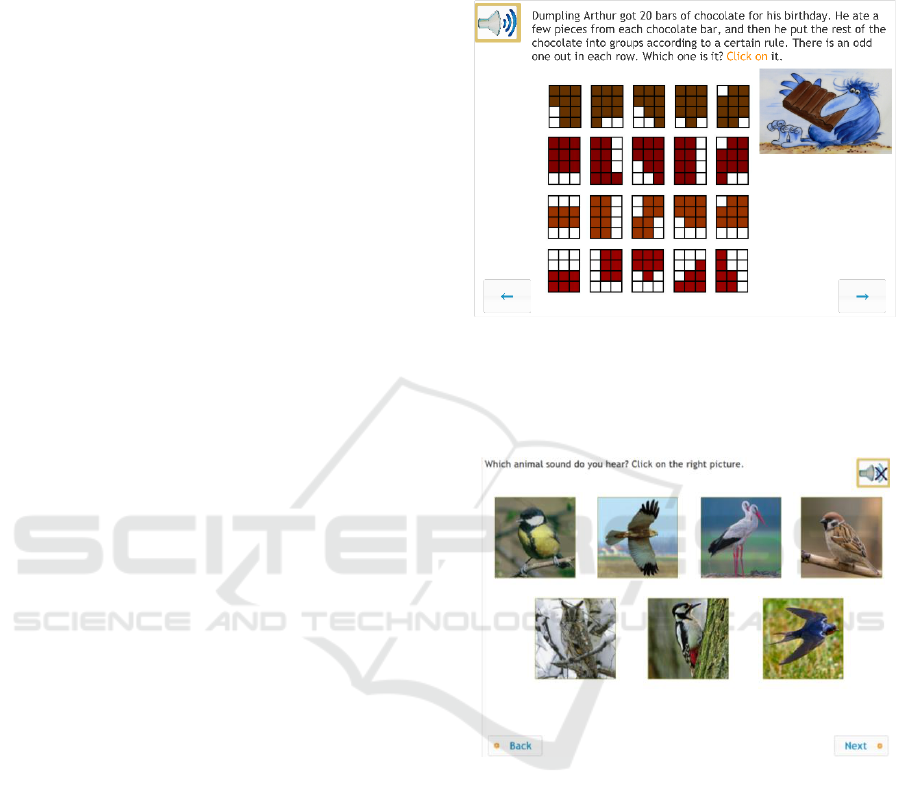
In the first three grades, instructions were
provided both in on-screen written form and with a
pre-recorded voice to prevent reading difficulties (see
Figure 4 – domain mathematics; dimension:
reasoning; Grade 1) and to increase the validity of the
results. Thus, students from Grades 1 to 3 (ages 6–9)
were asked to use headphones during the
administration of the tests to be able to listen to the
instructions and students in Grades 4–6 were also
asked to wear headphones to be able to listen to
multimedia elements in the test (see e.g. Figure 5 –
domain: science; dimension: application; Grade 6).
As the item pool developed for diagnostic
assessments involve first- and second-generation
computer-based tasks, students were expected to
work on their own. After listening to or reading the
instructions, they indicated their answers with the
mouse or keyboard (in the case of desktop computers,
which is the most common infrastructure in the
Hungarian educational system) or by directly
dragging, tapping or typing the elements in the tasks
with their fingers on tablets.
Figure 4: An example (domain: mathematics; dimension:
reasoning; Grade 1) of using TBA at the very beginning of
schooling to measure students’ mathematical reasoning
within the context of a familiar Hungarian cartoon (Molnár
and Csapó, 2019).
Figure 5: An example (domain: science; dimension:
application; Grade 6) of using TBA in an item format,
which it is not possible to realise with traditional
techniques.
4.2.3 Procedures
The assessment took place in the schools’ ICT labs
using the available school infrastructure (mostly
desktop computers) within the participating
Hungarian schools. The tests were delivered through
the eDia online platform. Students were previously
asked to wear headphones during test administration.
Each test lasted approximately 45 minutes, one
school lesson. The data were collected during regular
school hours. Testing sessions were supervised by
teachers, who had been thoroughly trained in test
administration. The system was open for a period of
How to Make Learning Visible through Technology: The eDia-Online Diagnostic Assessment System
127
six weeks, meaning teachers had the option to allow
their students to take the tests in this six-week period
of time.
Students entered the system with a specific
confidential assessment code. After entering the
system, they chose the domain (reading, mathematics
or science) of assessment, and the system selected a
test for the student randomly, out of the several tests
available in the same domain and on the same grade
level.
4.3 Results
The presentation of the results is organized according
to the aims (see section 4.1) of the empirical study.
First, we examine the preferences of the teachers in
the light of how the eDia system is used to make
learning visible in everyday school practice in the
domains of reading, mathematics and science from
the beginning of schooling to the end of the six years
of primary education. Second, as we see that TBA is
applicable to make students’ cognitive development
visible in the three main domains and that teachers are
open and willing to use technology-based diagnostic
assessment to receive well contextualized feedback
on their students’ achievement, we have a large-scale
database to validate the three-dimensional model of
learning in all three main domains of learning.
Finally, we examine whether the items and tasks used
in the diagnostic assessments are appropriate to the
ability level of the students.
4.3.1 Technology-based Assessment is
Applicable in an Educational Context
Results supported the notion that CBA can be carried
out even at the very beginning of schooling using the
school infrastructure without any modern touch
screen technology. Teachers and schools were
interested in TBA and in the feedback connected with
normative data on their students’ and classes’
cognitive development. In the voluntary data
collection, the most preferred domain was
mathematics (N=8,130), followed by reading
(N=8,006). Far fewer teachers in the field of science
decided to allow their students to take the diagnostic
tests in the field of science (N=5,980). This
proportion differed in Grade 2, where mathematics
and reading received the same attention, and in Grade
6, were more teachers were interested in their
students’ reading skills than maths teachers were in
their students’ maths knowledge.
Generally, about 40% of the school classes (41%
of the students; see Table 2) that took part in the
assessment preferred to collect information on their
students’ cognitive development in all three domains
in diagnostic assessments, thus 40% of the teachers
preferred to see their students’ development in all
three domains.
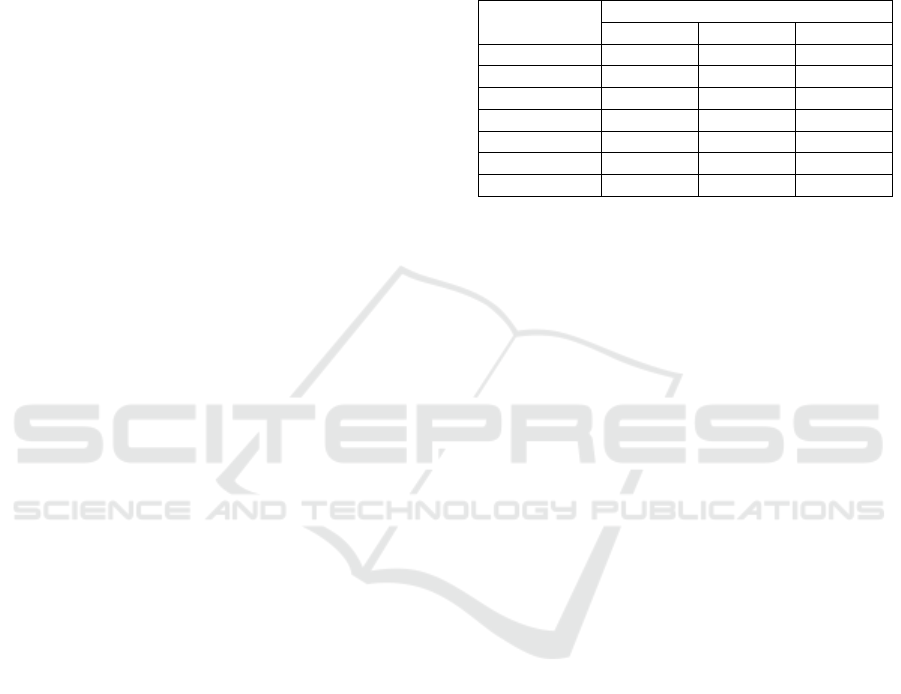
Table 2: The percentages of students who took the test in
one, two or all three domains in diagnostic assessments.
Grade
Number of domains
1
2
3
1
41.4
22.2
36.4
2
31.2
28.1
40.7
3
38.8
24.8
36.4
4
42.1
26.1
31.8
5
33.5
17.9
48.6
6
31.0
19.4
49.6
Mean
36.3
23.1
40.6
On average, 20% of the participating classes
completed tests in two out of the three areas, and 40%
of the classes took only one test. This percentage
changed by grade. Teachers of students in higher
grades were more open to allowing their students to
take tests from all three domains (almost 50%; see
Table 2).
4.3.2 Relationship between the Three
Dimensions of Learning
The bivariate correlations in the three dimensions of
reading, mathematics and science were medium high,
ranging from .422 to .630 (see Table 3), indicating
that the three dimensions are correlated constructs,
but not identical ones. On the sample level, the
relations between the three dimensions of learning
proved to be almost the same for reading and
mathematics (r_Reading=.56–.62; r_Math=.57–.61),
followed by science (r=.51–52). On the whole, the
strength of the relationship between the application
and content dimensions of reading (r=.630) and
mathematics (r=.613) proved to be the highest.
The grade-level analyses (see Table 4) explored
the differences in more detailed form and indicated
that the strength of the correlations are not fixed. The
correlation patterns differ between the different
cohorts.
The strengths of the correlation coefficients were
generally more homogeneous within grades than
across grades. The strongest correlations were
observable independently of the domain in Grades 5
and 6, followed by Grade 1.
CSEDU 2019 - 11th International Conference on Computer Supported Education
128
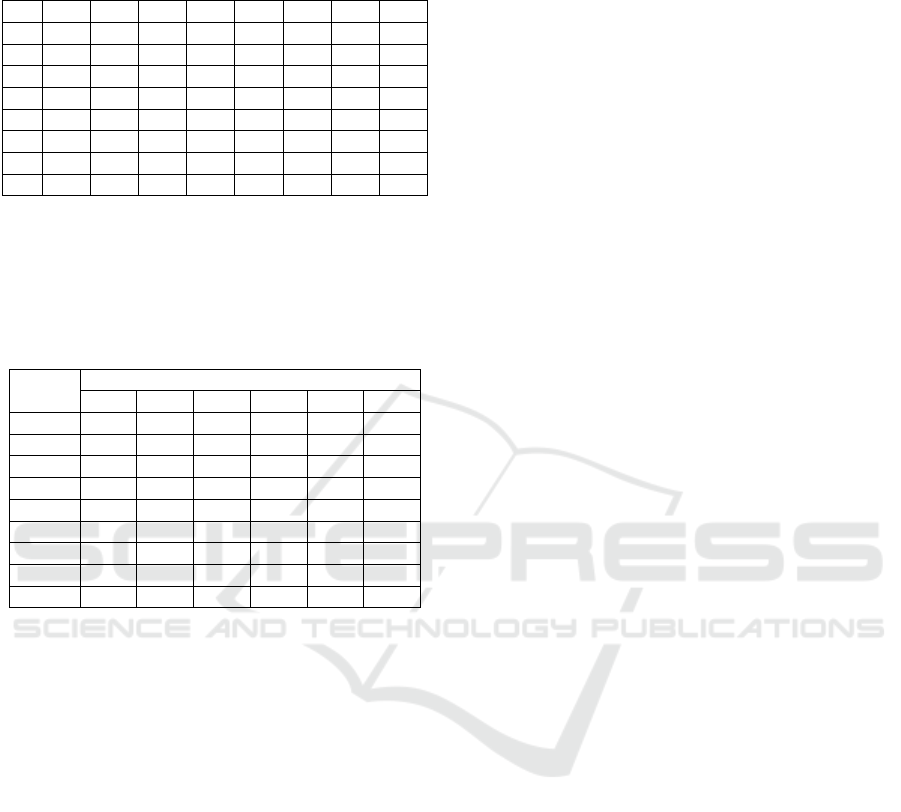
Table 3: Relations between results in the three dimensions
of learning in the fields of reading, mathematics and
science.
RA
RD
MR
MA
MD
SR
SA
SD
RR
.558
.586
.448
.499
.480
.437
.433
.422
RA
.630
.500
.522
.503
.448
.434
.447
RD
.504
.528
.516
.463
.469
.469
MR
.592
.570
.424
.404
.425
MA
.613
.456
.476
.467
MD
.441
.455
.453
SR
.507
.524
SA
.524
Note: First character (field): R: reading; M: mathematics;
S: science; Second character (dimension of learning): R:
reasoning; A: application, D: disciplinary.
Table 4: Grade-level relations between results in the three
dimensions of learning in the fields of reading, mathematics
and science.
Domains
Grade
1
2
3
4
5
6
RR-RA
.425
.517
.411
.464
.584
.574
RR-RD
.556
.601
.414
.487
.638
.575
RA-RD
.580
.597
.445
.542
.629
.627
MR-MA
.413
.529
.567
.529
.564
.534
MR-MD
.513
.536
.425
.485
.556
.515
MA-MD
.574
.526
.540
.514
.634
.553
SR-SA
.521
.331
.269
.423
.513
.574
SR-SD
.539
.414
.353
.460
.491
.563
SA-SD
.571
.412
.307
.411
.551
.564
Note: First character (field): R: reading; M: mathematics;
S: science; Second character (dimension of learning): R:
reasoning; A: application; D: disciplinary.
The behaviour of the relationships between the
application and disciplinary dimensions proved to be
the most stable across domains. In all three domains,
it was very high at the beginning of schooling, it
dropped in Grades 3 and 4, and, finally, it became
strong again in Grades 5 and 6. In the case of the
correlations between the reasoning and application
dimensions of learning, we observed a different
pattern. The strengths of the correlation coefficients
were lower at the beginning of schooling and became
stronger over time. Finally, the pattern of the
correlation coefficients between the reasoning and
disciplinary dimensions of learning proved to be
similar to what we found in the correlations between
the application and disciplinary dimensions of
learning. The strengths of the correlation coefficients
were higher at the beginning of schooling; they
dropped in Grades 3–4 and became strong again in
Grades 5–6.
To sum up, these correlations and correlation
patterns confirm that the three dimensions of learning
are strongly correlated, but not identical constructs.
The strength of the correlation between the same
dimensions of knowledge also depends on the grade
and domain being measured.
Thus, it was possible to distinguish the
disciplinary, application and psychological
dimensions of learning. Learning can be made visible
in all three dimensions of learning independently of
the domain being measured.
4.3.3 The eDia System Item Bank is
Appropriate to Make Learning Visible
in the Three Main Domains of
Learning
Rasch analyses were used to test the appropriateness
of the tasks regarding the difficulty level of the 1500
items from the eDia system item bank. The
item/person maps of abilities and difficulties show
how the distributions of students and items relate to
one another by locating both items and students on
the same continuum and on the same scale. The
distributions of person parameters (the ability
measure of students) are on the left side of the figures,
while the difficulty distributions of the items are on
the right.
More difficult items are positioned higher on the
scale than less difficult ones, just as students with a
higher ability level are positioned higher on the same
scale then students with a lower ability level. The
lowest values, meaning the easiest items and students
with the lowest ability level, are located at the bottom.
Students and items are located at the same level of the
continuum if the ability level of the student is equal
to the difficulty level of the item. This means that by
definition the student has a 50% chance of correctly
answering the item. The chance must be less than
50% if the ability level of the students is lower than
the difficulty level of the item and vice versa (Bond
and Fox, 2015).
Figures 6–8 show the item/person maps in the
domains of reading, mathematics and science. In all
three cases, the distribution of the items are in line
with the knowledge level of the students. Thus, the
item bank consists of very easy, very difficult and
average items as well; there are no difficulty gaps on
the line.
There are some noticeable differences in the
comparison of the item/person maps in the three main
domains of learning in the distribution of students’
abilities, in the distributions of item difficulties and in
how the distributions of item difficulties correspond
to the distributions of the students’ abilities. The
student-level distributions are more similar in the case
How to Make Learning Visible through Technology: The eDia-Online Diagnostic Assessment System
129
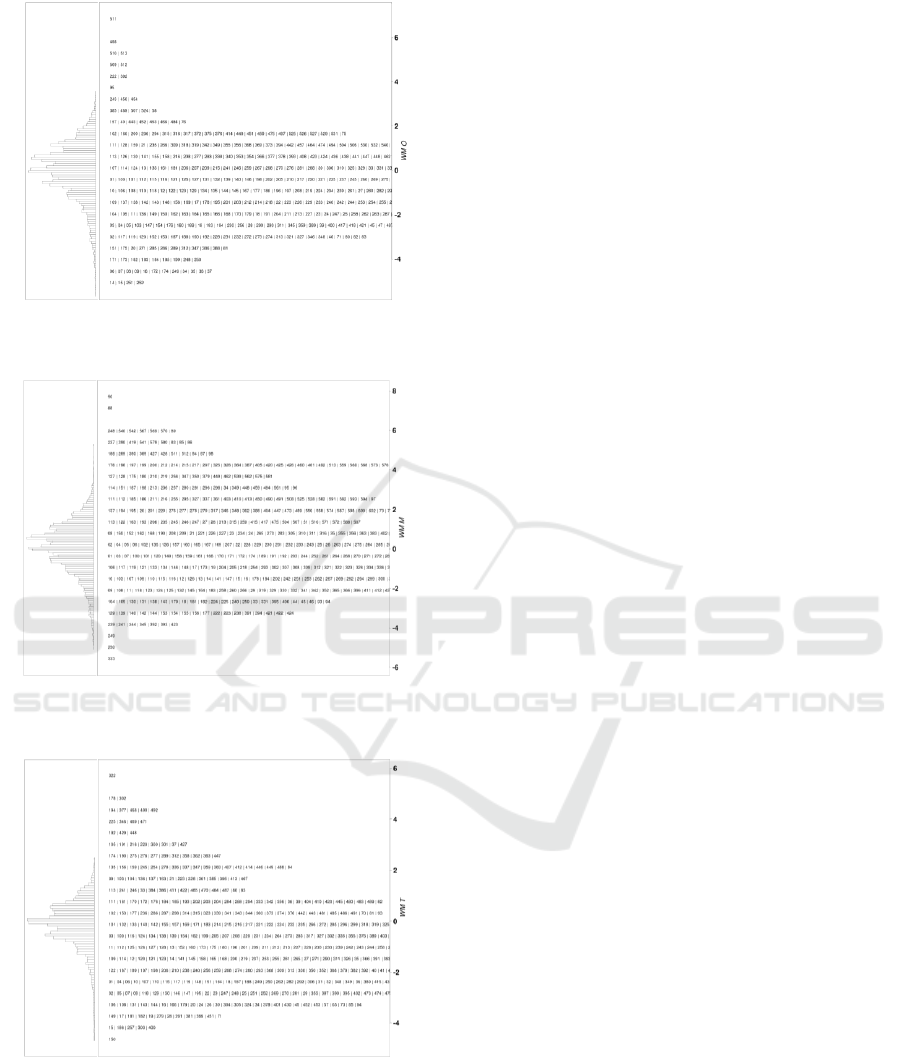
Figure 6: The item/person map of the diagnostic assessment
items used in the present study in the field of reading.
Figure 7: The item/person map of the diagnostic assessment
items used in the present study in the field of mathematics.
Figure 8: The item/person map of the diagnostic assessment
items used in the present study in the field of science.
of reading and science, and there are much higher
differences in the domain of mathematics. However,
there are easy items in the item banks for precise
assessments in all three domains; the number of easy
items seems to be relatively lower than the number of
difficult items, which seems to be higher than
required.
Generally, the 1500 items extracted from the eDia
system item bank are well structured and fit the
knowledge level of first- to sixth-graders in all three
main domains of learning. However, further study is
needed to test the behaviour of the whole item bank.
5 CONCLUSIONS
International large-scale assessments focus explicitly
on students’ achievement in several broad content
domains, but the implicit goal is to find ways and
even use assessment to make education more
effective. In the present paper, we have explored the
possibilities of using TBA in an educational context
to make learning visible. We introduced how research
results from the fields of learning and instruction,
cognitive sciences and TBA have been integrated into
an online diagnostic assessment system, the eDia
system, by the Research Group on Learning and
Instruction at the University of Szeged.
We have shown how the possibilities and
advantages (e.g. immediate feedback to both students
and teachers) of TBA can support a re-thinking of
assessment in the 21
st
century and how it can be used
to promote personalized learning. In the 21
st
century,
we need to solve problems on a daily basis by
combining, applying and creating new knowledge
from the knowledge we have acquired in and outside
school. In the present paper, we have empirically
confirmed the relevance of distinguishing the three
dimensions of learning, the application, reasoning
and disciplinary aspects of knowledge, which are
highly correlated, but different constructs. Beyond
confirming the applicability of the eDia system in an
educational context, we have shown with item/person
maps that the item bank for the eDia system is
appropriate to measure students’ cognitive
development in the first six years of schooling.
We can conclude that TBA can be used in an
educational context even at the very beginning of
schooling and that it is appropriate to make learning
visible at least in the three main domains of schooling
and the three different dimensions of learning.
In educational practice, implementation of the
eDia system paves the way for individualized,
personalized learning. It helps both students and
teachers to identify weaknesses and recognize and
develop the domains where it is most needed. It
supports a number of progressive initiatives, for
example, meeting the requirements of evidence-based
practice and data-based (assessment-based)
CSEDU 2019 - 11th International Conference on Computer Supported Education
130

instruction. As for research and theory-building, it
produces an immense amount of assessment data and
meta-data, providing materials for learning analytics
and data mining. A better understanding of how the
assessed domains and dimensions interact in
cognitive development aids further improvement in
the conditions for learning.
ACKNOWLEDGEMENTS
This study was funded by OTKA K115497, EFOP-
3.4.3-16-2016-00014 and EFOP 3.2.15 projects.
REFERENCES
Bond, T. G. and Fox, C. M. (2015). Applying the Rasch
Model. Fundamental Measurement in the Human
Sciences. Mahwah: Routledge.
Csapó, B. and Molnár, G. (submitted). Online Diagnostic
Assessment in Support of Personalized Learning: The
eDia System.
Csapó, B., and Csépe, V. (2012). Framework for diagnostic
assessment of reading. Budapest: Nemzeti
Tankönyvkiadó.
Csapó, B., and Molnár, G. (2017). Assessment-Based,
Personalized Learning in Primary Education. In J. C.
Spender, G. Schiuma, and T. Gavrilova (Eds.),
Knowledge Management in the 21st Century:
Resilience, Creativity and Co-creation. Proceedings of
12th edition of the IFKAD (pp. 283-292). St.
Petersburg: St. Petersburg University.
Csapó, B., and Szabó, G. (2012). Framework for diagnostic
assessment of science. Budapest: Nemzeti
Tankönyvkiadó.
Csapó, B., and Szendrei, M. (2011). Framework for
diagnostic assessment of mathematics. Budapest:
Nemzeti Tankönyvkiadó.
Csapó, B., Lörincz, A., and Molnár, G. (2012). Innovative
assessment technologies in educational games designed
for young students. In Assessment in Game-Based
Learning (pp. 235-254). Springer, New York, NY.
Greiff, S., Wüstenberg, S., Molnár, G., Fischer, A., Funke,
J., and Csapó, B. (2013). Complex problem solving in
educational contexts—Something beyond g: Concept,
assessment, measurement invariance, and construct
validity. Journal of Educational Psychology, 105(2),
364.Hattie (2009)
Hattie, J., and Timperley, H. (2007). The power of
feedback. Review of Educational Research, 77(1), 81-
112.
Hattie, J. (2012). Visible learning for teachers: Maximizing
impact on learning. Routledge.Molnár and Csapó, 2018
Molnár, G., and Csapó, B. (2019). Technology-based
diagnostic assessments for identifying early learning
difficulties in mathematics. In A. Fritz-Stratmann, P.
Räsänen, and V. Haase (Eds.), International Handbook
of Mathematical Learning Difficulties. Springer, in
Press.
Molnár, G., Greiff, S., Wüstenberg, S., and Fischer, A.
(2017). Empirical study of computer based assessment
of domain-general dynamic problem solving skills. In
B. Csapó and J. Funke, (Eds.), The Nature of Problem
Solving (pp. 123-143). Paris: OECD.
Nunes, T., and Csapó, B. (2011). Developing and assessing
mathematical reasoning. In B. Csapó and M. Szendrei
(Eds.), Framework for diagnostic assessment of
mathematics (pp. 17-56). Budapest: Nemzeti
Tankönyvkiadó.
Pachler, N., Daly, C., Mor, Y., and Mellar, H. (2010).
Formative e-assessment: Practitioner cases. Computers
and Education, 54(3), 715-721.
Pásztor-Kovács, A., Pásztor, A., and Molnár, G. (2018).
Kollaboratív problémamegoldó képességet vizsgáló
dinamikus teszt fejlesztése [Development of an online
interactive instrument for assessing collaborative
problem solving]. Magyar Pedagógia, 118(1), 73-102.
Pellegrino, J. W., and Quellmalz, E. S. (2010). Perspectives
on the integration of technology and assessment.
Journal of Research on Technology in Education,
43(2), 119-134.
Redecker, C., and Johannessen, Ø. (2013). Changing
assessment—Towards a new assessment paradigm
using ICT. European Journal of Education, 48(1), 79-
96.
Tongori, Á. (2018). Measuring ICT literacy among grade
5-11 students: Confidence in accessing information
(Doctoral Dissertation). University of Szeged, Szeged.
How to Make Learning Visible through Technology: The eDia-Online Diagnostic Assessment System
131
