
Cost-evaluation of Cloud Portfolios: An Empirical Case Study
Benedikt Pittl, Werner Mach and Erich Schikuta
Faculty of Computer Science, University of Vienna, Austria
Keywords:
Cloud Market, Cloud Portfolios, Cost Model, Cloud Economics.
Abstract:
Today, Amazon is the Cloud service market leader with the EC2 platform. Three predominant marketspaces
exist on this platform: spot marketspace, reservation marketspace, and the well-known on-demand mar-
ketspace. Also other providers such as Google, Microsoft and VirtuStream run multiple marketspaces. Con-
sumers can purchase their virtual machines from different providers on different marketspace to form Cloud
portfolios: a bundle of virtual machines whereby the virtual machines have different technical characteristics
and pricing mechanisms. An industry-relevant research challenge is to provide best practices and guidelines
for creating cost-efficient Cloud portfolios. In this paper, we used Amazon’s marketspaces and the dataset
from the Bitbrains datacenter to analyze the cost-efficiency of heterogeneous Cloud portfolios - portfolios
where the virtual machines are purchased from different marketspaces. We found out that heterogeneous port-
folios are more cost-efficient than homogeneous portfolios for almost all analyzed situations. Our analysis
further revealed that consumers request virtual machines that are over-sized which forms a significant field
of cost-optimization. A second dataset from the Bitbrains datacenter - from another domain of application -
validates our findings.
1 INTRODUCTION
Cloud providers develop and apply innovative busi-
ness models in order to boost market shares [Messina
et al., 2017]. This resulted in the release of multi-
ple novel platforms in recent years. For example, the
so called Deutsche Boerse Cloud Exchange - an en-
terprise co-founded by the German Stock exchange
- launched in 2016 a web portal. This web por-
tal was intended as a marketspace where consumers
can compare possible Cloud providers of their re-
quired virtual machines before they purchase them.
Few months after the Deutsche Boerse Cloud Ex-
change started it announced its termination. The sci-
entific community did not analyze the reasons for
the platform’s failure. In industry related literature
the low number of providers - in total only three
providers were available - as well as the low technical
maturity of the platform are mentioned [Herrmann,
2016]. Also, well-established Cloud providers intro-
duced novel platforms for trading virtual machines.
So today Amazon’s EC2 platform, which is the lead-
ing platform [iDatalabs, 2017], hosts three main mar-
ketspaces: (i) The on-demand marketspace is Ama-
zon’s most prominent marketspace were consumers
pay per hour of usage for a virtual machine. Hence, no
long-term contracts are necessary giving consumers
a high degree of flexibility as they can terminate the
virtual machine anytime. (ii) The reservation mar-
ketspace allows consumers to purchase virtual ma-
chines for one year to three years paying a prede-
fined fee. The hourly prices of virtual machines on
the reservation marketspace are significantly lower
than the prices on the on-demand marketspace. Due
to the long contracts on the reservation marketspace
Amazon hosts an additional sub-marketspace where
consumers of the reservation marketspace can resell
their virtual machines to other consumers. (iii) The
spot marketspace allows consumers to bid for virtual
machines. If the bid exceeds Amazon’s spot mar-
ket price - which represents Amazon’s current de-
mand and supply - then consumers get the virtual ma-
chine. The spot marketspace was reworked at the end
of 2017 with the aim of simplifying bidding strate-
gies. So today the spot market price has fewer spikes
and is more constant than before. Additionally, con-
sumers do not bid anymore - instead, consumers pay
the spot price which is significantly lower than the
prices on the on-demand marketspace
1
. However, vir-
tual machines from the spot marketspace can be inter-
rupted by Amazon at any time. In the work of Cheetri
1
https://aws.amazon.com/blogs/compute/new-amazon-
ec2-spot-pricing/
132
Pittl, B., Mach, W. and Schikuta, E.
Cost-evaluation of Cloud Portfolios: An Empirical Case Study.
DOI: 10.5220/0007754601320143
In Proceedings of the 9th International Conference on Cloud Computing and Services Science (CLOSER 2019), pages 132-143
ISBN: 978-989-758-365-0
Copyright
c
2019 by SCITEPRESS – Science and Technology Publications, Lda. All rights reserved

the effects of the reworked spot marketspace were
analyzed: Indeed, the reworked spot marketspace
seems to lead to higher average prices than before -
see [Chhetri et al., 2018] for more information. Ama-
zon additionally offers spot blocks which are virtual
machines that are not interrupted for a certain amount
of time. For example, 6-hour spot blocks are virtual
machines that are not interrupted for 6 hours. The
scientific community discusses different visions for
the realization of future Cloud markets. The visions
range from decentralized auctions [Bonacquisto et al.,
2014] over centralized auctions [Samimi et al., 2016]
to bilateral multi-round negotiations - aka Bazaar ne-
gotiations [Dastjerdi and Buyya, 2015a, Pittl et al.,
2017, Pittl et al., 2015].
A challenging problem in industry and academia
is to find cost-efficient Cloud capacity for a given set
of requested virtual machines. While some of the re-
quests can be served using private Cloud solutions,
the rest of them has to be hosted on public Clouds.
Thereby, a main challenge is to purchase the virtual
machines from the appropriate marketspace so that
a cost-optimal portfolio is formed. Different pricing
models - e.g. fees, hourly pricing - as well as technical
constraints such as unpredictable interruptions of vir-
tual machines purchased on Amazon’s EC2 spot mar-
ketspace have to be considered when creating Cloud
portfolios. To the best of the authors’ knowledge, nei-
ther the scientific community nor the industry have
presented an empirical analysis or a case study which
addresses this problem. We see this paper as a first
step towards creating cost-efficient Cloud portfolios.
Therefore, we used a dataset of the Bitbrains data-
center
2
that contains utilization traces of virtual ma-
chines. We interpret these virtual machines as re-
quested virtual machines for which we form optimal
Cloud portfolios. So in a first step, we identified ap-
propriate Amazon instance types
3
for the given set of
virtual machines. In a second step, we create cost-
efficient Cloud portfolios by purchasing these virtual
machines from different Amazon marketspaces. Ad-
ditional web services, as well as providers, are out of
the scope of this paper.
The paper is structured as follows: Section 2 sum-
marizes foundations and related work. In section 3
the dataset is described as well as the portfolio cre-
ation process. A cost analysis of Cloud portfolios is
given in section 4. We used a second dataset in order
to validate our findings in section 5. The results of the
paper are discussed in section 6 while the conclusion
in section 7 closes the paper.
2
http://gwa.ewi.tudelft.nl/datasets/gwa-t-12-Bitbrains
3
Instance types are preconfigured virtual machines that
can be purchased on Amazon.
2 FOUNDATIONS AND RELATED
WORK
This section is structured along two parts: First, re-
lated work is summarized. In the second part char-
acteristics of Amazon’s marketspaces, which are used
for creating portfolios, are detailed.
The idea of Cloud markets was for instance intro-
duced in [Chichin et al., 2017,Pittl et al., 2017,Bonac-
quisto et al., 2014, Dastjerdi and Buyya, 2015b].
All these papers used the notion of Cloud portfolios
but, with a focus on the introduction of novel mar-
ketspaces, they neglected a detailed analysis of them.
An excellent paper on Cloud portfolios was presented
by [Irwin et al., 2017]. There, it is described that
Cloud portfolios face similar to financial portfolios a
tradeoff between risk and profit. The authors intro-
duce risk management techniques for reducing inter-
ruptions of virtual machines such as hedging or ac-
tive trading. With a focus on the risk management,
the creation and analysis of cost-efficient Cloud port-
folios was neglected. Further, no comprehensive use
case was introduced. Based on this work, the authors
introduced the project ExoSphere for risk modeling
and analysis of Cloud portfolios in [Sharma et al.,
2017]. Other works such as [Pittl et al., 2016] intro-
duced Cloud market simulation environments without
considering existing marketspaces.
Joe Weinman mentioned the importance of Cloud
portfolios in several publications, e.g. [Weinman,
2016, Weinman, 2015] - a detailed analysis of Cloud
portfolios is missing. Several papers focused on the
analysis of Amazon’s spot marketspace: The authors
of [Zhang et al., 2018] evaluated bidding strategies
on the spot marketplace. Thereby, the authors as-
sume that consumers can choose between the on-
demand marketspace and the spot marketspace. Con-
crete datasets as well as other marketspaces were
overlooked. The authors of [Chhetri et al., 2018]
investigated the pricing differences of the old spot
marketspace - before 2017 - and the new spot mar-
ketspace. Cloud portfolios were not considered. Sim-
ilarly, the authors of [Pham et al., 2018] empirically
determined the frequency of interruption of virtual
machines on Amazon’s EC2 spot marketspace with-
out considering the creation of Cloud portfolios.
Preconfigured virtual machines - called instance
types on Amazon - can be purchased from different
marketspaces. In the following we summarize impor-
tant characteristics of Amazon’s marketspaces
4
. On
the reservation marketspace consumers purchase vir-
tual machines for either 1 year or for 3 years. In-
4
For more information see https://docs.aws.
amazon.com/.
Cost-evaluation of Cloud Portfolios: An Empirical Case Study
133

dependent of the usage of the virtual machine con-
sumers have to pay a predefined fee. Thereby con-
sumers can choose between three payment options:
prepaid, partly prepaid or no prepayment. For the
last two payment options the consumers have to pay
a monthly fee. On the spot marketspace virtual ma-
chines are paid per hour of usage without any long-
term contract. Amazon can interrupt them at any
time. Therefore it publishes a frequency of inter-
ruption metric on its website. Before the spot mar-
ketspace was reworked, consumers had to bid for their
virtual machine. On the new marketspace bidding
is not necessary any more and the spot-market price
has a lower volatility and it is updated all five min-
utes. Two special instance types are offered on the
spot marketspace: 1-hour spot instances and 6-hour
spot instances. These are virtual machines that are
not interrupted but terminated after 1 or 6 hours -
they have a fixed lifetime. On the on-demand mar-
ketspace consumers pay per hour of usage. There, vir-
tual machines are not interrupted. Amazon further of-
fers some special marketplaces such as the dedicated
instance marketspace. Virtual machines purchased
on this marketspace run on a physical isolated hard-
ware. Such virtual machines are required for server-
bounded software licenses and are expensive as you
have to pay an extra fee of 2$ per hour of usage.
3 CLOUD PORTFOLIO
CREATION
The main challenge towards creating a cost-efficient
Cloud portfolio is to find for a set of requested virtual
machines x
1
..x
n
a set of virtual machines v
1
..v
n
which
are cost-efficient for a given time period t fulfilling
certain requirements.
x
i
=⇒ ∃v
i
: resource
j
(x
i
) ≤ resource
j
(v
i
), ∀ j, i ∈ 1..n (1)
resource
j
(x
i
) is a function that returns a resource j
such as memory or processing capacity from a virtual
machine or a request for a virtual machine. cost(v
i
,t)
is a function that returns the costs for using a virtual
machine v
i
over time period t. These costs should be
minimized as the following equation shows.
n
∑
i=1
cost(v
i
,t) → min (2)
A virtual machine v is an instance of an in-
stance type T: µ
µ
µ(v, T). The instance type deter-
mines the available resources and technical charac-
teristics of the virtual machine. Using Amazon’s
instance types, T could take the following values:
T ∈ {t3.nano, t3.micro,...}. Further, each virtual ma-
chine v can be purchased on different marketspaces
M ∈ {spot marketspace, on-demand Marketspace, ..}
which determines its price: µ
µ
µ(v, M). A virtual ma-
chine v is characterized by its instance type T and its
marketspace M. The first challenge is to determine
the appropriate instance type for a request, the second
challenge is to purchase the virtual machine from a
marketspace so that a cost-efficient Cloud portfolio is
formed. In this section we describe the first challenge,
the following section describes the second challenge.
For the empirical analysis the public available Bit-
brains datacenter dataset was used which comes with
two sub-datasets:
• Fast Storage: Here 1250 virtual machines were
observed over one month. The virtual machines
are connected to a fast storage area network.
• Rnd: In this dataset 500 virtual machines were
traced over three months. In contrast to the pre-
vious dataset, the virtual machines are connected
to a slower network attached storage.
An analysis of the dataset is presented in [Shen
et al., 2015]. It is described that virtual machines of
the first dataset are usually application servers while
virtual machines in the second dataset are manage-
ment machines. All traced virtual machines are busi-
ness critical - the business effect is significant if they
are not available. In [Shen et al., 2015] it is also men-
tioned that changes of the configuration of the virtual
machines are rare - less than 1% of the traced virtual
machines faced such changes. The first line of table 1
shows the characteristics which were traced for each
virtual machine. The CPU capacity is equal to the
number of cores multiplied with the clock speed of
each core. The trace further shows the memory capac-
ity of the virtual machine as well as its usage. We in-
terpret the CPU and memory capacity as the requested
resources which were ordered by the consumers. For
this set of requests, optimal portfolios have to be cre-
ated. In the following we use the Fast Storage dataset.
The Rnd dataset is used for validation of our findings
which we presented in section 5.
For constructing optimal portfolios we used Ama-
zon’s instance types
5
. Amazon offers hundreds of dif-
ferent instance types which run in up to 17 availability
zones. Our aim was to find instance types for the vir-
tual machines of the dataset so that the resulting port-
folio becomes cost-efficient. Therefore, information
regarding the availability zone as well as the operating
system is required - not all instance types are available
for all availability zones and for all operating systems.
Here we faced two challenges. (i) In the Bitbrains
5
https://aws.amazon.com/ec2/pricing/on-demand/
CLOSER 2019 - 9th International Conference on Cloud Computing and Services Science
134

Table 1: Head of the trace file (fast storage, 2013-8-1).
Timestamp CPU
cores
CPU
cpacity
CPU
usage
[MHz]
CPU us-
age [%]
Memory
capacity
Memory
usage
Disk
read
through-
put
[KB/s]
Disk
write
through-
put
[KB/s]
Network
received
through-
put
[KB/s]
Network
trans-
mitted
through-
put [KB/s]
1376314846 4 11704.00 10912.03 93.23 67108864 6129274.4 0.133 15981.6 0.0 2.13
1376315146 4 11704.00 10890.57 93.05 67108864 6755624.0 1.33 19137.33 0.0 2.6
...
Table 2: Amazon instance types available in Frankfurt.
Name vCPU ECU Memory
(GiB)
Instance
Storage
General Purpose-Current Generation
t3.nano 2 Variable 0.5GiB EBS Only
t3.micro 2 Variable 1GiB EBS Only
...
dataset, no customer requirements regarding the avail-
ability zone is given. However, the Bitbrains dataset
is from a datacenter located in the Netherlands. So
we assume that all consumers want to process their
data in western Europe. We decided to use instance
types of availability zone EU Frankfurt
6
. (ii) In the
Bitbrains dataset, no customer requirements about the
used operating system are given. We assume that
Linux-based instances are required. Amazon offers in
total 83 instance types with a Linux-based operating
system and which are hosted in Amazon’s datacen-
ter in Frankfurt. An exemplary list of these instances
is given in table 2. The instance type characteristics
and the CPU clock speed data
7
were used for find-
ing the cheapest appropriate instance types - based on
equations 1 and 2 - for the given virtual machines of
the dataset. The disk storage is managed by Amazon
with EBS independently from the instance types. So
it was not considered for finding appropriate instance
types.
In total 22 instance types from Amazon are nec-
essary to host the requested virtual machines as cost-
efficient as possible. Figure 1 summarizes the results.
The abscissa shows the requested virtual machines of
the dataset, the ordinate shows the cheapest match-
ing instance type from Amazon. The values of the
ordinate are ordered by price: t3.nano is the cheap-
est instance type, while r5.24xlarge is the most ex-
pensive instance type. The figure shows that Ama-
zon’s smallest instance type t3.nano is appropriate for
most of the requested virtual machines. We observed
a significant difference between the requested virtual
machines (columns: CPU capacity and memory ca-
pacity) and the real usage of them (maximum values
6
An availability zone for the Netherlands does not exist.
7
https://aws.amazon.com/ec2/instance-types/
of the columns: CPU usage [MHz], Memory Usage):
888 virtual machines (71%) are under-utilized, i.e. the
requested capacity is never used. Hence, we did a sec-
ond mapping where we used the maximum utilization
of the processing power and memory - called maxi-
mum utilization in the following - instead of the re-
quested processing power and memory. The result
of the second mapping process is illustrated in fig-
ure 2. Using the maximum utilization instead of the
requested resources for the mapping leads to the us-
age of smaller instance types as shown in table 3. It
lists the number of required instance types for both
requests. For example, 314 instead of 235 t3.nano in-
stances are used, the number of t3.micro and t3.small
instances increases too, while the number of expen-
sive instance types such as the t3.large decreases. 21
instead of 22 instance types are necessary to serve the
requests based on the maximum utilization. The in-
stance type c5.2xlarge is not necessary anymore.
The two portfolios - one created with the re-
quested resources and the second one created with
the maximum utilization - have significant cost dif-
ferences. They are detailed in table 4. This table
shows the hourly prices of homogeneous portfolios:
for example, the first line shows the hourly prices if all
the requested virtual machines are purchased - with
their optimal instance type - on the on-demand mar-
ketspace. The biggest cost difference between the two
portfolios occurs if all virtual machines are purchased
on the on-demand marketspace: here, the cost differ-
ence is 129.35$ per hour. The prices on the spot mar-
ketspace are the lowest. However, the virtual machine
can be interrupted at any time. Further, the prices
can change based on Amazon’s current demand and
supply. In the table, the prices of the reserved mar-
ketspace are interpolated. On the reservation mar-
ketspace, consumers pay a fixed fee independent of
the usage of the virtual machine. We determined the
hourly price by distributing the costs over the com-
plete runtime, e.g. for a three-year instance from the
reservation marketspace the hourly prices are calcu-
lated as follows:
total fee
3·365·24
. Therefore, the costs are sig-
nificantly lower than on the on-demand marketspace.
Cost-evaluation of Cloud Portfolios: An Empirical Case Study
135

Table 3: Matching Amazon instance types of the requests.
Types Requested Maximum Utilization ∆
t3.nano 235 314 79
t3.micro 31 207 176
t3.small 28 168 140
t3.medium 113 119 6
t2.medium 40 17 23
t3.large 119 80 39
t2.large 47 15 32
r5.large 131 30 101
t3.xlarge 14 57 43
c5.xlarge 92 7 85
t2.xlarge 36 90 54
r5.xlarge 193 11 182
t3.2xlarge 6 6 0
c5.2xlarge 5 0 5
t2.2xlarge 35 53 18
r5.2xlarge 93 69 24
c5.4xlarge 3 1 2
x1e.xlarge 0 1 1
r5.4xlarge 13 1 12
c5.9xlarge 6 0 6
m4.10xlarge 6 1 5
r5.12xlarge 1 2 1
x1e.4xlarge 0 1 1
r5.24xlarge 3 0 3
Total 1250 1250 1038
The 1-hour spot instances, as well as the 6-hour spot
instances, are special instance types. They terminate
after a predefined amount of hours and so they cannot
be used for applications that run over months. Hence,
the hourly prices of such virtual machines are signifi-
cantly lower than on the on-demand marketspace.
The portfolio which resulted from the second
mapping process - using the maximum utilization -
leads to a stronger concentration of instance types ac-
cording to the Gini-index [Gini, 1921], i.e. few in-
stance types are used for most of the requests. We
calculate the Gini index, which measures the equality
of distribution, by the following formula:
Gini − index =
q
∑
i=1
(k
i−1
+ k
i
)
a
i
H
i
∑
q
j=1
a
j
H
j
− 1 (3)
q is the number of instance types while a
i
H
i
repre-
sents the share of virtual machines using the instance
type i on the total number of virtual machines. k
i
represents the share of the instance type on the total
number of instance types. Here, an ordering of the in-
stance types is assumed so that for each pair (k
i
, k
i+1
)
the condition k
i
< k
i+1
holds. After doing the Gini-
Correction (Gini − index
cor
=
n
n−1
· Gini − index) the
values can be interpreted as follows: 0 → complete
equal distribution which means that all instance types
are used for the same number of virtual machines, 1
→ complete unequal distribution which means that a
single instance type is used for all virtual machines.
Table 4: Costs per hour of homogeneous portfolios.
Marketspace Requested Maximum
Utilization
∆
On-demand Marketspace 277.67$ 148.32$ 129.35$
Spot Marketspace 96.88$ 50.99$ 45.89$
1-hour Spot Marketspace 140.32$ 76.4$ 63.92$
6-hour Spot Marketspace 181.41$ 97.99$ 83.42$
No Prepaid - Reserved Mar-
ketspace (1 Year)
182.18$ 100.35$ 81.83$
Partly Prepaid - Reserved
Marketspace (1 Year)
173.84$ 95.83$ 78.01$
Prepaid - Reserved Mar-
ketspace (1 Year)
170.5$ 94.10$ 76.4$
No Prepaid - Reserved Mar-
ketspace (3 Years)
130.85$ 71.75$ 59.1$
Partly Prepaid - Reserved
Marketspace (3 Years)
121.89$ 66.56$ 55.33$
Prepaid - Reserved Mar-
ketspace (3 Years)
113.57$ 62.18$ 51.39$
The first mapping process leads to a corrected Gini-
index of 0.61 while the second mapping process leads
to a corrected Gini-index of 0.69. It shows that the
concentration of instance types is higher if the maxi-
mum utilization is used for finding matching instance
types than using the requested resources.
4 CLOUD PORTFOLIO COST
ANALYSIS
In the previous section, we created homogeneous
portfolios where all virtual machines are purchased
from a single marketspace. In this section, we de-
termine optimal portfolios by purchasing virtual ma-
chines from multiple marketspaces. With 1250 vir-
tual machines that can be purchased on 10 different
marketplaces 1250
10
different portfolios can be cre-
ated. An excerpt of the possible portfolios for the re-
quested virtual machines is depicted in figure 3. The
figure shows different Cloud portfolios whereby the
virtual machines are grouped by marketspaces. The
used marketspaces have a significant effect on the
portfolio costs. While the spot marketspace offer the
cheapest prices for most of the virtual machines there
are few exceptions, e.g. virtual machines of the in-
stance type m5d.12xlarge are cheaper on the 1-hour
spot marketspace than on the spot marketspace. The
spot instances can be interrupted at any time and so
Amazon publishes a Frequency of Interruption met-
ric
8
: Frequency of interruption represents the rate at
which Spot has reclaimed capacity during the trailing
month. They are in ranges of < 5%, 5-10%, 10-15%
8
https://aws.amazon.com/ec2/spot/instance-advisor/
CLOSER 2019 - 9th International Conference on Cloud Computing and Services Science
136
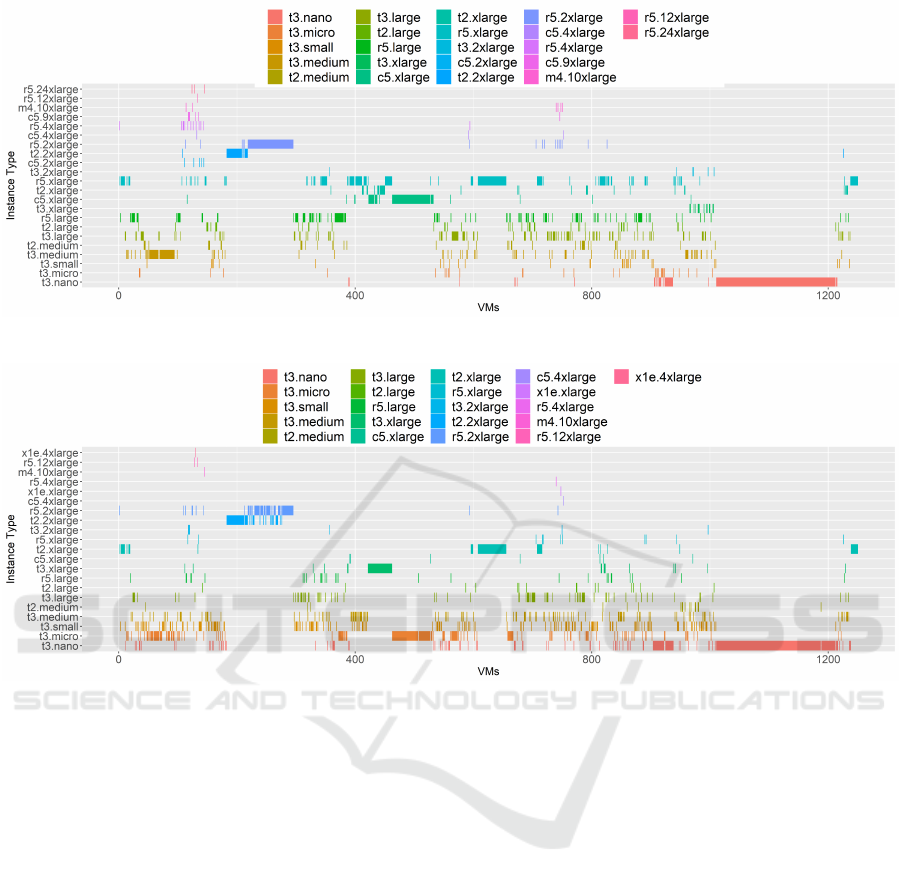
Figure 1: Matching Amazon instance types using the requested resources (columns: CPU capacity, Memory capacity).
Figure 2: Matching Amazon instance types using the maximum utilization instead of the requested resources (maximum of
the columns: CPU usage, Memory usage).
,15-20% and > 20%. A consumer of a spot instance
does not know at which time its virtual machine is in-
terrupted. Hence, we introduce penalties to quantify
the costs of an interruption for the portfolio owner.
They represent the costs of an interruption caused by
a service unavailability or the costs of the portfolio
owner to compensate restrictions of services. The
published frequencies of interruptions can be inter-
preted as an arrival rate λ of an interruption which
is widely used for Poisson processes. For example,
for the instance t3.micro the monthly arrival rate of
an interruption is λ
month
= 5%. Based on the given
monthly arrival rate we determined the hourly arrival
rate for instance types and multiplied them with a
penalty in order to get the expected hourly costs of
the penalty:
penalty
hour
= λ
hour
· penalty (4)
The hourly price for a spot instance is calculated
as follows:
costs
hour
= (penalty
hour
+ spot price) · hour of usage (5)
Also, other marketspaces have drawbacks: The 1-
hour and 6 hour spot instances are used for virtual ma-
chines which only run a predefined number of hours
before they are terminated. Further, the hourly prices
of the reservation marketspace are virtual. Consumers
have to pay the predefined fee independent of the us-
age. Determining the optimal portfolio requires to
know the planning period - the duration of time for
which the portfolio should be hosted. For a given
planning period t and a penalty we determine the op-
timal portfolio using the goal function of equation 1.
The cost function is calculated as follows:
given for v: t,penalty,marketspace,instanceType
switch(marketspace) {
case(OnDemand):
return t · pricePerHour
instanceType,onDemand
case(Spot):
return (λ
hour,instanceType
· penalty + pricePerHour
instanceType,spot
) · t
case(1-hourSpot):
if(t==1) {
return t · pricePerHour
instanceType,1-hourSpot
} else { return ∞ }
case(6-hourSpot):
Cost-evaluation of Cloud Portfolios: An Empirical Case Study
137

Figure 3: Cloud Portfolios where the virtual machines are purchased from different marketspaces - Excerpt.
if(t ≤ 6) {
return t · pricePerHour
instanceType,6-hourSpot
} else { return ∞ }
case(No Prepaid - Reservation Markets. (1 Year)):
return fee
instanceType,No Prepaid - Reservation Marketspace (1 Year)
·ceil(
t
365·24
)
case(Partly Prepaid - Reservation Markets. (1 Year)):
return fee
instanceType,Partly Prepaid - Reservation Marketspace (1 Year)
·ceil(
t
365·24
)
case(Prepaid - Reservation Markets. (1 Year)):
return fee
instanceType,Prepaid - Reservation Marketspace (1 Year)
·ceil(
t
365·24
)
case(No Prepaid - Reservation Markets. (3 Years)):
return fee
instanceType,No Prepaid - Reservation Marketspace (3 Years)
·ceil(
t
365·24·3
)
case(Partly Prepaid - Reservation Markets. (3 Years)):
return fee
instanceType,Partly Prepaid - Reser. Marketspace (3 Years)
·ceil(
t
365·24·3
)
case(Prepaid - Reservation Markets. (3 Years)):
return fee
instanceType,Prepaid - Reservation Marketspace (3 Years)
·ceil(
t
365·24·3
)
}
Based on equation 2 we identified optimal portfo-
lios for a given penalty and planning period. Thereby,
we identified for each required instance type the mar-
ketspace with the cheapest prices. Figure 4 shows the
optimal portfolios for a given planning periods and
penalties. The planning periods are given in hours -
they range from 1 hour over 220 days (5280 hours),
1 year (8736 hours), 2 years (17472 hours) to three
years (26208 hours). The penalties range from 100$
to 1000$. For short planning periods up to 6 hours
the 1-hour spot marketspace, but also the 6 hour spot
marketspace, play a critical role independently of the
penalty. For longer planning periods up to 220 days
(5280 hours) purchasing virtual machines from the
on-demand marketspace, the spot marketspace and
the prepaid reservation marketspace (1 Year)
9
leads
to the most cost-efficient Cloud portfolios. For this
planning periods, virtual machines from the 1-hour
spot marketspace and the 6-hour spot marketspace are
not available. Further, for most of the virtual ma-
chines the reservation marketspace is too expensive
for these planning periods. With a planning period
of 1 year, optimal portfolios are formed if the vir-
tual machines are purchased from the prepaid reserva-
tion marketspace (1 Year) and the spot marketspace.
9
Also for a penalty of 100$ some virtual machines
are purchased from the prepaid reservation marketspace (1
Year), which is hard to see in figure 4.
The higher the penalty, the more attractive become
virtual machines from the prepaid reservation mar-
ketspace (1 Year). For portfolios that have to run
two years (17472 hours) a combination of virtual ma-
chines from the prepaid reservation marketspace (1
Year), prepaid reservation marketspace (2 Years) and
the spot marketspace forms optimal Cloud portfolios.
If the portfolio should be hosted for 3 years or longer
then all virtual machines of the portfolio should be
purchased on the reservation market with a long-term
contract (3 years) if the penalty exceeds 1000$. If
the penalty for an interruption is decreased then also
for that planning period few spot instances are part
of the optimal portfolio. Table 5 shows the costs of
the optimal portfolios. The column Total Costs incl.
Penalty shows the total costs of the portfolio con-
sidering the complete planning period including the
penalty which is relevant for virtual machines pur-
chased on the spot marketspace. These costs were
distributed over the planning period leading to the
hourly costs as the next column shows. The prices
first increase (7 hours) and decrease for planning pe-
riods longer than 220 days (5280 hours). The high
prices for planning periods between 7 hours and 5280
hours occur because here virtual machines from the
cost-efficient 1-hour and 6-hour spot marketspace are
not available - at the same time, virtual machines from
the reservation marketspaces are not cost-efficient for
most of the virtual machines for such short planning
periods. These effect - first the hourly price increases
and then it decreases - can be observed for all optimal
portfolios independent of the used penalty. The real
payments to Amazon are given in the columns Total
Costs excl. Penalty - here the penalty term for virtual
machines from the spot marketspace was ignored. So
the prices are always lower than the one which include
the penalty. For a penalty of 1000$ only few virtual
machines are purchased on the spot marketspace and
so the penalty costs are decreasing.
The analysis reveals that prices for heterogeneous
portfolios are lower than using homogeneous portfo-
lios. Table 5 shows that consumers have to pay 47.23$
for one hour for a heterogeneous portfolio while the
lowest price of the homogeneous portfolio is 50.99$
CLOSER 2019 - 9th International Conference on Cloud Computing and Services Science
138
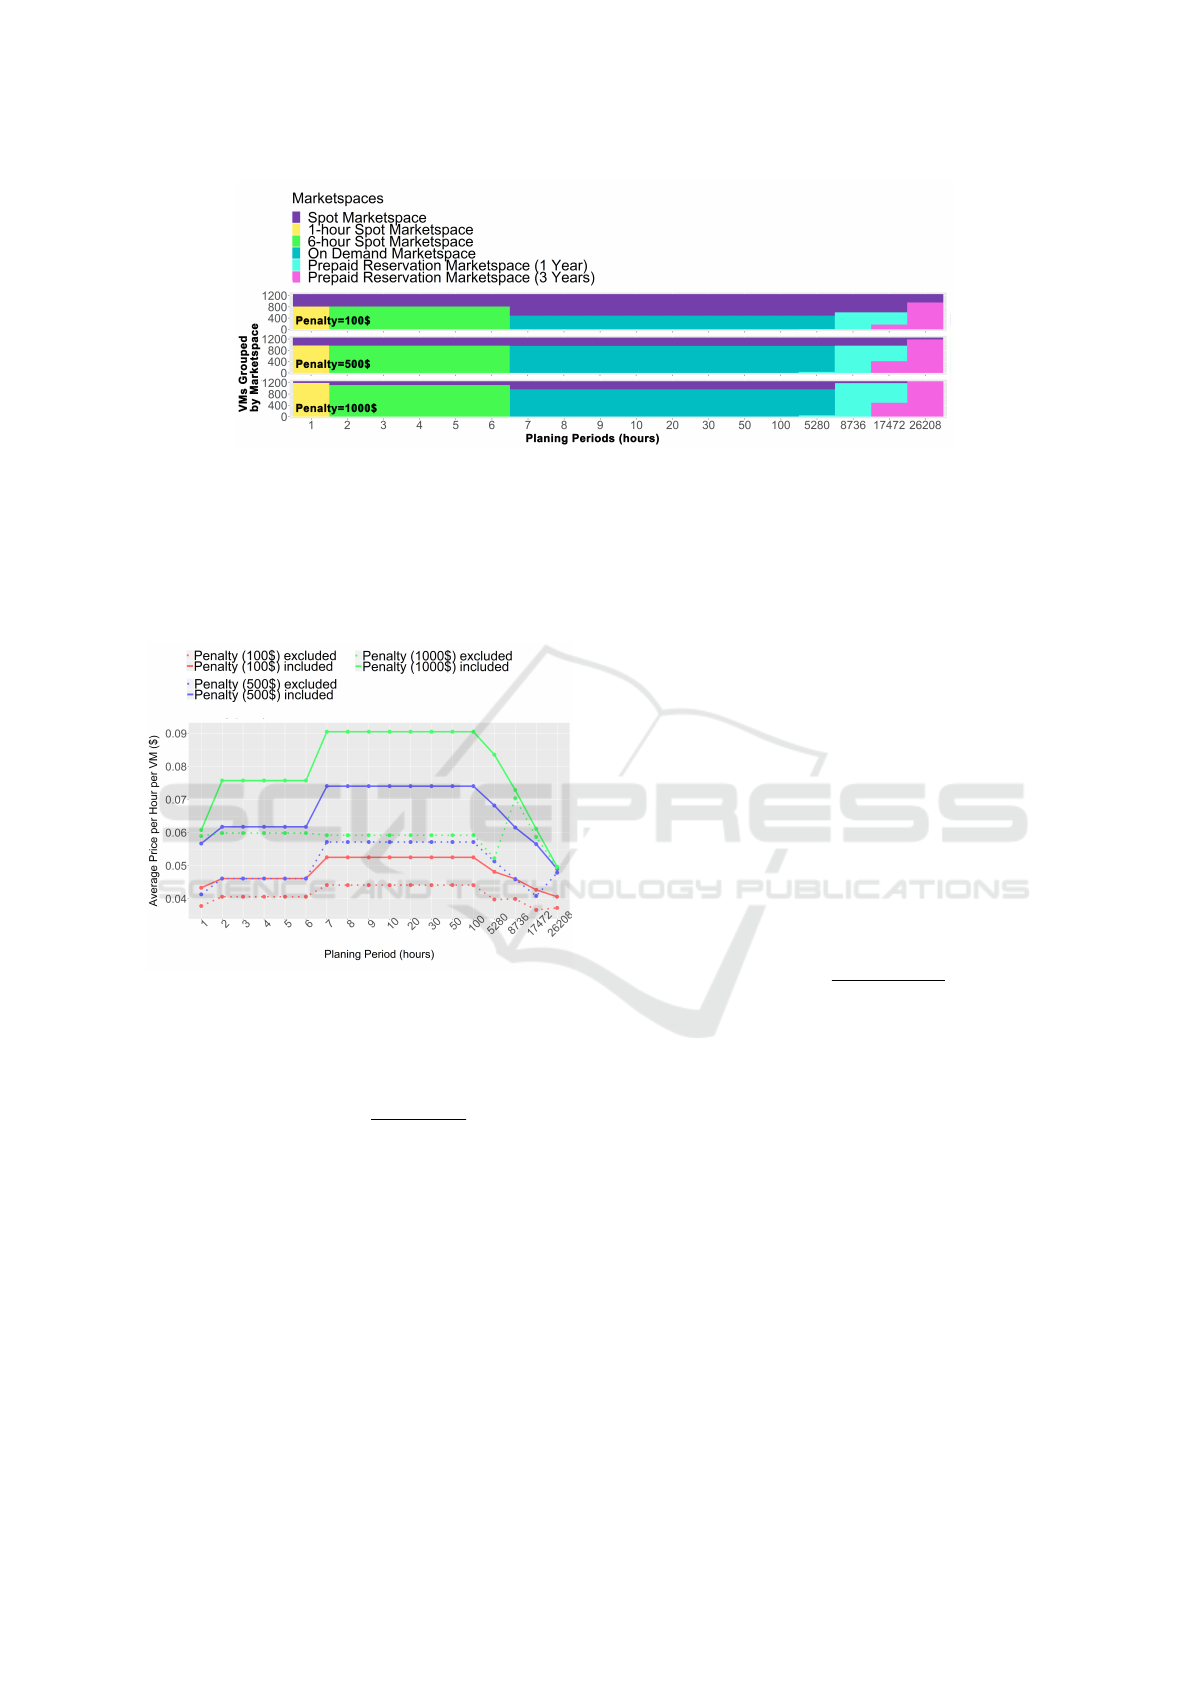
Figure 4: Optimal Cloud portfolios for given planning periods and penalties.
(see table 4). This is because the spot marketspace
does not offer the cheapest prices for all virtual ma-
chines. For example, a virtual machine of the instance
type m5d.12xlarge costs 1.632$ per hour on the 1-
hour spot marketspace while it costs 3.264$ on the
spot marketspace.
Figure 5: Average costs of per hour per virtual machine of
the optimal Cloud portfolios.
We also determined the average hourly prices of
the virtual machines in the optimal portfolios:
average costs =
∑
n
i
cost(v
i
, 1)
n
(6)
For virtual machines purchased on the reservation
marketspaces we used virtual hourly costs by dis-
tributing the fee over the complete runtime (1 year
or three years). Figure 5 shows the average price of a
virtual machine per hour. In total six lines are given:
the solid lines show the average hourly costs includ-
ing the penalty while the dashed lines show the av-
erage hourly costs without the penalty. Latter is the
money paid to Amazon. We can observe the same ef-
fect as for the total portfolio costs: the prices incl. the
penalty increase for short planning periods and de-
crease for long planning periods. Further, this figure
shows that the distance between the average price in-
cluding the penalty (solid) and the average price ex-
cluding the penalty (dashed) decreases with an in-
creasing penalty. This implies that the share of vir-
tual machines from the spot marketspace is reduced.
An interesting effect occurs for the planning period 1
year (8736 hours): here the green dashed line repre-
senting the average costs excluding penalty (1000$)
suddenly increases to 0.07$. Figure 4 illustrates this
effect: at this planning period almost no virtual ma-
chine is purchased from the spot marketspace and so
almost no penalty costs occur. The share of virtual
machines from the spot marketspace remains almost
identical for this planning period in the other scenar-
ios were a penalty of 100$ and 500$ is used. We fur-
ther calculated the hourly costs for virtual machines
differently as the following equation shows. Instead
of distributing the costs of virtual machines purchased
on the reservation marketspace over the complete run-
time (1 year or three years) we distributed the costs
over the planning period:
cost per hour =
f ee
planning period
(7)
The distribution of the costs over the planning pe-
riod mainly affects portfolios with a planning period
of 2 years (17272 hours): here the average costs per
hour of usage are 0.011$ higher than in the previous
scenario where the fee was distributed over the com-
plete runtime. This is because the costs of virtual
machines purchased on the prepaid reservation mar-
ketspace (3 years) are distributed over two years only.
Table 6 summarizes the average costs.
5 VALIDATION
We used the second dataset (Rnd) of the Bitbrains dat-
acenter to validate our findings. These two datasets
represent sets of virtual machines with complete dif-
ferent usage patterns: the first dataset (Fast Storage)
is mainly used for application servers the Rnd dataset
is mainly used for management machines.
Cost-evaluation of Cloud Portfolios: An Empirical Case Study
139
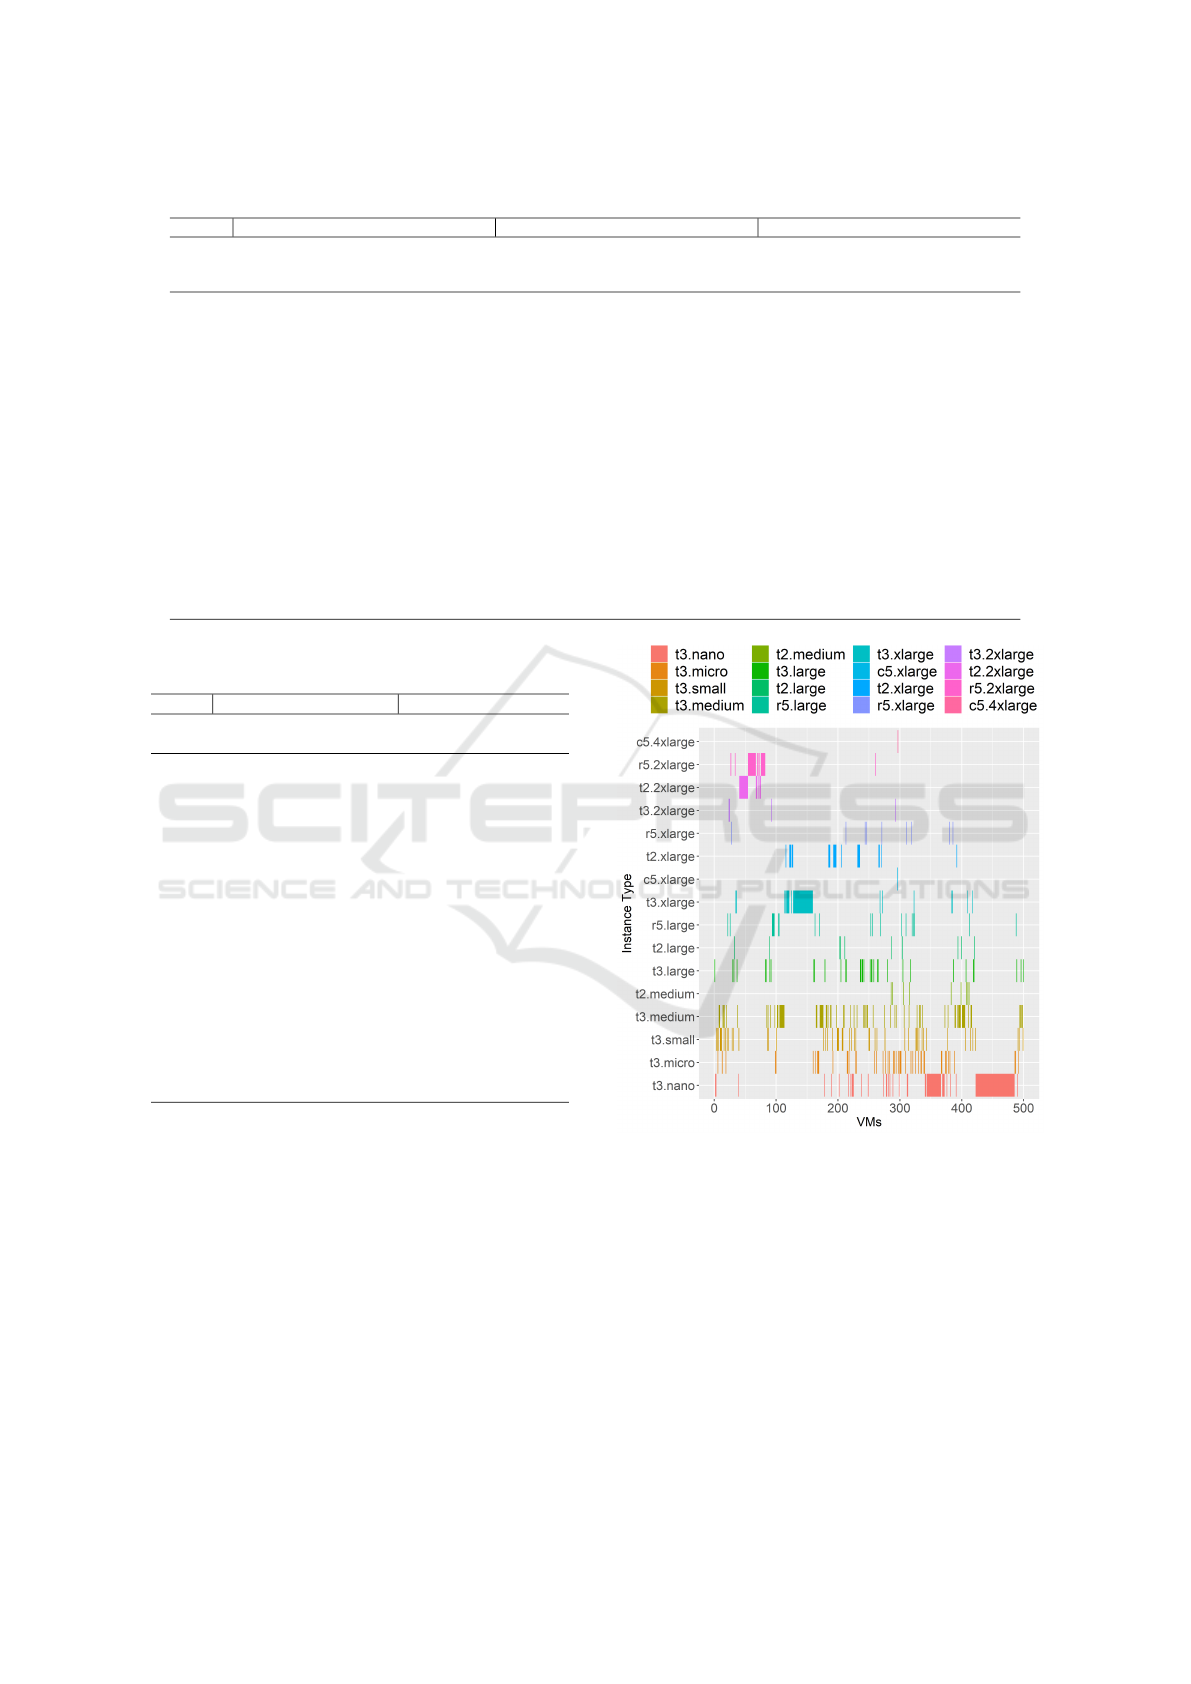
Table 5: Costs of Optimal Portfolios (TC=Total Costs).
Penalty 100$ Penalty 500$ Penalty 1000$
Planning
Period
TC incl.
Penalty
TC
incl.
Penalty/H.
TC excl.
Penalty
TC
excl.
Penalty/H.
TC incl.
Penalty
TC
incl.
Penalty/H.
TC excl.
Penalty
TC
excl.
Penalty/H.
TC incl.
Penalty
TC
incl.
Penalty/H.
TC excl.
Penalty
TC
excl.
Penalty/H.
1 54.12$ 54.12$ 47.23$ 47.24$ 70.85$ 70.85$ 51.64$ 51.64$ 75.95$ 75.95$ 73.66$ 73.66$
2 115.26$ 57.63$ 101.50$ 50.75$ 154.37$ 77.18$ 115.20$ 57.60$ 189.36$ 94.68$ 149.63$ 74.82$
3 172.89$ 57.63$ 152.25$ 50.74$ 231.55$ 77.18$ 172.80$ 57.60$ 284.03$ 94.68$ 224.45$ 74.82$
4 230.52$ 57.63$ 203.00$ 50.74$ 308.74$ 77.18$ 230.41$ 57.60$ 378.71$ 94.68$ 299.27$ 74.82$
5 288.15$ 57.63$ 253.74$ 50.74$ 385.92$ 77.18$ 288.01$ 57.60$ 473.39$ 94.68$ 374.08$ 74.82$
6 345.79$ 57.63$ 304.49$ 50.74$ 463.12$ 77.18$ 345.61$ 57.60$ 568.07$ 94.68$ 448.90$ 74.82$
7 459.38$ 65.63$ 385.92$ 55.13$ 647.81$ 92.54$ 500.03$ 71.43$ 792.00$ 113.14$ 517.83$ 73.98$
8 525.01$ 65.63$ 441.06$ 55.13$ 740.36$ 92.54$ 571.47$ 71.43$ 905.14$ 113.14$ 591.80$ 73.98$
9 590.63$ 65.63$ 496.19$ 55.13$ 832.90$ 92.54$ 642.90$ 71.43$ 1018.28$ 113.14$ 665.78$ 73.98$
10 656.26$ 65.63$ 551.33$ 55.13$ 925.45$ 92.54$ 714.33$ 71.43$ 1131.42$ 113.14$ 739.76$ 73.98$
20 1312.51$ 65.63$ 1102.65$ 55.13$ 1850.89$ 92.54$ 1428.67$ 71.43$ 2262.84$ 113.14$ 1479.51$ 73.98$
30 1968.77$ 65.63$ 1653.98$ 55.13$ 2776.34$ 92.54$ 2143.00$ 71.43$ 3394.27$ 113.14$ 2219.27$ 73.98$
50 3281.28$ 65.63$ 2756.63$ 55.13$ 4627.23$ 92.54$ 3571.67$ 71.43$ 5657.12$ 113.14$ 3698.78$ 73.98$
100 6562.57$ 65.63$ 5513.26$ 55.13$ 9254.45$ 92.54$ 7143.34$ 71.43$ 11314.22$ 113.14$ 7397.55$ 73.98$
5280 344526.90$ 65.63$ 289123.56$ 54.76$ 486149.56$ 92.07$ 374682.89$ 70.96$ 594531.99$ 112.60$ 387731.99$ 73.43$
8736 502524.90$ 57.52$ 436125.21$ 49.92$ 672569.99$ 76.99$ 501489.99$ 57.40$ 797464.12$ 91.28$ 770467.44$ 88.19$
17472 987700.70$ 56.53$ 854901.41$ 48.93$ 1326880.98$ 75.94$ 984720.98$ 56.36$ 1572994.23$ 90.03$ 1519000.90$ 86.94$
26208 1331328.00$ 50.80$ 1220762.59$ 46.58$ 1609584.88$ 61.42$ 1571819.88$ 59.97$ 1631067.15$ 62.24$ 1623787.15$ 61.96$
Table 6: Average hourly costs of a virtual machine in the
optimal portfolio.
Costs distr. over Planning P. Costs distr. over Runtime
planning
Period
Penalty
100$
Penalty
500$
Penalty
1000$
Penalty
100$
Penalty
500$
Penalty
1000$
1 0.0378$ 0.041$ 0.059$ 0.038$ 0.041$ 0.059$
2 0.0406$ 0.046$ 0.060$ 0.041$ 0.046$ 0.060$
3 0.0406$ 0.046$ 0.060$ 0.041$ 0.046$ 0.060$
4 0.0406$ 0.046$ 0.060$ 0.041$ 0.046$ 0.060$
5 0.0406$ 0.046$ 0.060$ 0.041$ 0.046$ 0.060$
6 0.0406$ 0.046$ 0.060$ 0.041$ 0.046$ 0.060$
7 0.044$ 0.057$ 0.060$ 0.044$ 0.057$ 0.060$
8 0.044$ 0.057$ 0.060$ 0.044$ 0.057$ 0.060$
9 0.044$ 0.057$ 0.060$ 0.044$ 0.057$ 0.060$
10 0.044$ 0.057$ 0.060$ 0.044$ 0.057$ 0.060$
20 0.044$ 0.057$ 0.060$ 0.044$ 0.057$ 0.060$
30 0.044$ 0.057$ 0.060$ 0.044$ 0.057$ 0.060$
50 0.044$ 0.057$ 0.060$ 0.044$ 0.057$ 0.060$
100 0.044$ 0.057$ 0.060$ 0.044$ 0.057$ 0.060$
5280 0.034$ 0.051$ 0.052$ 0.044$ 0.057$ 0.059$
8736 0.040$ 0.046$ 0.070$ 0.040$ 0.046$ 0.071$
17472 0.037$ 0.041$ 0.059$ 0.040$ 0.045$ 0.070$
26208 0.037$ 0.048$ 0.049$ 0.037$ 0.048$ 0.050$
First, we performed a mapping process to find ap-
propriate instance types for the virtual machines of
the dataset. An example is given in figure 6. It shows
that - similar to the first trace - 19 instance types are
necessary in order to serve the requests at the low-
est costs. The corrected Gini-Index for this dataset
is about 0.53. The requests are distributed over more
different instance types than in the first trace. We also
did the mapping process using the maximum utiliza-
tion of the virtual machines. In total 339 (68%) ma-
chines were assigned to another instance type which
shows that also these requests are over-sized. The
share of over-sized virtual machines is comparable to
the share of the first dataset. Table 7 summarizes the
Figure 6: Matching Amazon instance types using the re-
quested resources (columns: CPU capacity, Memory capac-
ity).
required instance types. The corrected Gini index of
using the maximum utilization is 0.54. Also here the
concentration of instance types is higher when using
the maximum workload instead of the requested re-
sources.
Figure 8 shows the optimal portfolios for this
dataset using a penalty of 1000$ for an interruption of
a virtual machine purchased on the spot instance. The
optimal portfolios are heterogeneous - which means
that virtual machines have to be purchased from dif-
CLOSER 2019 - 9th International Conference on Cloud Computing and Services Science
140

Table 7: Amazon instance types for the requested virtual
machines.
Types Requested Workload Maximum ∆
t3.nano 85 118 33
t3.micro 19 48 29
t3.small 26 51 25
t3.medium 46 77 31
t2.medium 12 9 3
t3.large 52 35 17
t2.large 28 10 18
r5.large 50 20 30
t3.xlarge 6 49 43
c5.xlarge 7 1 6
t2.xlarge 39 23 16
r5.xlarge 68 9 59
t3.2xlarge 4 4 0
c5.2xlarge 5 0 5
t2.2xlarge 10 19 9
r5.2xlarge 37 26 11
c5.4xlarge 0 1 1
r5.4xlarge 3 0 3
c5.9xlarge 2 0 2
r5.24xlarge 1 0 1
Total 500 500 342
Figure 7: Average costs of per hour per virtual machine of
the optimal Cloud portfolios.
ferent marketspaces to form optimal portfolios - for
almost all planning periods. Also, the composition of
the portfolios is comparable to the previous dataset:
for short planning periods virtual machines are mainly
purchased from the 1-hour and the 6-hour spot mar-
ketspace. For planning periods between 7 hours and
220 days most of the virtual machines are purchased
from the on-demand marketspace. For longer plan-
ning periods virtual machines are purchased from the
reservation marketspaces. Due to this composition of
the portfolio, the average price curve per virtual ma-
chine per hour has a peak at the planning periods be-
tween 7 and 100 hours. It is illustrated in figure 7. So,
for this dataset the identical effects can be observed
as for the previous dataset.
6 DISCUSSION AND FURTHER
RESEARCH
The evaluation shows, that the findings of the first
dataset (fast storage) - such as that resource requests
are oversized or that heterogeneous portfolios are
cost-efficient for almost all planning periods - can also
be observed in the second dataset. During the analy-
sis, we neglected the small possibility that demanded
virtual machines purchased from the on-demand mar-
ketspace and the spot marketspace could be rejected
by Amazon due to missing historical data. Further,
we used a fixed penalty for spot instances - indepen-
dent of the duration of interruption. Amazon notifies
its consumers two minutes before a virtual machine
from the spot marketspace is interrupted and there-
fore consumers have the chance to migrate to another
virtual machine in order to minimize the cost of inter-
ruption. The used penalty in this paper is a lump-sum
which represents the costs of service interruptions as
well as the costs for minimizing the impact of inter-
ruptions.
For finding appropriate instance types for the
given virtual machines of the dataset we used inter-
alia the CPU capacity measured in MHz. While we
assume a strong correlation between the clock-speed
presented in the dataset and the clock speeds pub-
lished by Amazon they might not be directly com-
parable. As the Bitbrains dataset does not track the
required hard disc storage we did not consider it in
our analysis. However, storage is an important aspect
for creating Cloud portfolios and has to be consid-
ered in ongoing evaluations. In our future research,
we plan to optimize the portfolio creation process by
considering different availability zones as well as dif-
ferent Cloud providers. Further, we will investigate
options for migrating virtual machines from the spot-
marketspace in cases in which they are interrupted
by Amazon. This is an interesting field of research,
especially in combination with Amazon’s fleet man-
agement. The findings of the paper are the basis for
an envisioned Cloud portfolio adviser: Today, Cloud
providers offer APIs for managing and monitoring
virtual machines. We plan to design a software tool
that observes current market prices and which creates
an advise for given planning periods in order to min-
imize the costs of a Cloud portfolio. It can be fur-
ther used to empirically determine interruption rates
for optimizing the portfolios. To create cost-efficient
portfolios, the software has to have access to multiple
Cloud providers. A challenge is to integrate the dif-
ferent APIs and to realized migrations of virtual ma-
chines between different Cloud providers. All the pre-
Cost-evaluation of Cloud Portfolios: An Empirical Case Study
141

Figure 8: Optimal Portfolios using the RND dataset - assuming a Penalty of 1000$
sented pricing data was taken from Amazon’s public
website on 13.12.2018.
7 CONCLUSION
Creating optimal Cloud portfolios for a given set of
requests is a critical issue in industry and academia.
In the paper at hand, we took a Cloud dataset from the
Bitbrains datacenter which contains utilization traces
of virtual machines. First, we treated theses vir-
tual machines as requests and identified appropriate
instance types for them using Amazon’s EC2 plat-
form. In a second step, we formed cost-optimal port-
folios by purchasing the virtual machines from differ-
ent marketspaces. Thereby, the analysis shows that
heterogeneous portfolios - portfolios where virtual
machines were purchased from at least two different
marketspaces - are cost-efficient for all given planning
periods. Further, the analysis reveals that Cloud port-
folios with a runtime between 7 hours and 100 hours
usually have the highest average hourly costs. For this
time frame, virtual machines can neither be purchased
from the cost-efficient 1-hour spot marketspace nor
from the 6-hour spot marketplaces. At the same time,
the cheap virtual machines from the reservation mar-
ketspace are not advisable due to their long-term con-
tracts. During the mapping process we found out that
more than 60% of all virtual machines are underuti-
lized - their requested resources are never used. The
findings of the second dataset from the Bitbrains data-
center - which contains virtual machines that are used
for a different purpose - underpins the observed ef-
fects.
REFERENCES
Bonacquisto, P., Modica, G. D., Petralia, G., and Tomar-
chio, O. (2014). A strategy to optimize resource al-
location in auction-based cloud markets. In IEEE In-
ternational Conference on Services Computing, SCC
2014, Anchorage, AK, USA, June 27 - July 2, 2014,
pages 339–346.
Chhetri, M. B., Lumpe, M., Vo, Q. B., and Kowalczyk, R.
(2018). To bid or not to bid in streamlined EC2 spot
markets. In 2018 IEEE International Conference on
Services Computing, SCC 2018, San Francisco, CA,
USA, July 2-7, 2018, pages 129–136.
Chichin, S., Vo, Q. B., and Kowalczyk, R. (2017). Towards
efficient and truthful market mechanisms for double-
sided cloud markets. IEEE Trans. Services Comput-
ing, 10(1):37–51.
Dastjerdi, A. V. and Buyya, R. (2015a). An autonomous
time-dependent SLA negotiation strategy for cloud
computing. The Computer Journal, page bxv053.
Dastjerdi, A. V. and Buyya, R. (2015b). An autonomous
time-dependent SLA negotiation strategy for cloud
computing. Comput. J., 58(11):3202–3216.
Gini, C. (1921). Measurement of inequality of incomes.
The Economic Journal, 31(121):124–126.
Herrmann, W. (2016). Deutsche boerse cloud
exchange gibt auf. In Computerwoche.
https://www.computerwoche.de/a/deutsche-boerse-
cloud-exchange-gibt-auf,3223201, Accessed: 2017-
09-20.
iDatalabs (2017). Companies using Amazon EC2.
https://idatalabs.com/tech/products/amazon-ec2. Ac-
cessed: 2017-09-20.
Irwin, D. E., Sharma, P., Shastri, S., and Shenoy, P. J.
(2017). The financialization of cloud computing: Op-
portunities and challenges. In 26th International Con-
ference on Computer Communication and Networks,
ICCCN 2017, Vancouver, BC, Canada, July 31 - Aug.
3, 2017, pages 1–11.
Messina, F., Mikkilineni, R., Morana, G., and Rosaci, D.
(2017). Track chair’s report: Convergence of dis-
tributed clouds, grids and their management CDCGM
2017. In 26th IEEE WETICE 2017, Poznan, Poland,
June 21-23, 2017, pages 92–94.
Pham, T., Ristov, S., and Fahringer, T. (2018). Performance
and behavior characterization of amazon EC2 spot in-
stances. In 11th IEEE International Conference on
Cloud Computing, CLOUD 2018, San Francisco, CA,
USA, July 2-7, 2018, pages 73–81.
Pittl, B., Haq, I. U., Mach, W., and Schikuta, E. (2017).
Towards self-organizing cloud markets fostering inter-
mediaries. In 26th IEEE International Conference on
Enabling Technologies: Infrastructure for Collabora-
tive Enterprises, WETICE 2017, Poznan, Poland, June
21-23, 2017, pages 131–136.
Pittl, B., Mach, W., and Schikuta, E. (2015). A negotiation-
based resource allocation model in iaas-markets. In
CLOSER 2019 - 9th International Conference on Cloud Computing and Services Science
142

8th IEEE/ACM International Conference on Utility
and Cloud Computing, UCC 2015, Limassol, Cyprus,
December 7-10, 2015, pages 55–64.
Pittl, B., Mach, W., and Schikuta, E. (2016). Bazaar-
extension: A cloudsim extension for simulating ne-
gotiation based resource allocations. In IEEE Interna-
tional Conference on Services Computing, SCC 2016,
San Francisco, CA, USA, June 27 - July 2, 2016, pages
427–434.
Samimi, P., Teimouri, Y., and Mukhtar, M. (2016). A com-
binatorial double auction resource allocation model in
cloud computing. Inf. Sci., 357:201–216.
Sharma, P., Irwin, D. E., and Shenoy, P. J. (2017).
Portfolio-driven resource management for transient
cloud servers. POMACS, 1(1):5:1–5:23.
Shen, S., van Beek, V., and Iosup, A. (2015). Statistical
characterization of business-critical workloads hosted
in cloud datacenters. In 15th IEEE/ACM International
Symposium on Cluster, Cloud and Grid Computing,
CCGrid 2015, Shenzhen, China, May 4-7, 2015, pages
465–474.
Weinman, J. (2015). Cloud pricing and markets. IEEE
Cloud Computing, 2(1):10–13.
Weinman, J. (2016). Migrating to-or away from-the public
cloud. IEEE Cloud Computing, 3(2):6–10.
Zhang, Y., Ghosh, A., and Aggarwal, V. (2018). Opti-
mized portfolio contracts for bidding the cloud. CoRR,
abs/1811.12901.
Cost-evaluation of Cloud Portfolios: An Empirical Case Study
143
