
Integration of Monitoring and Alarm Management in Power Plants
Vincenza Carchiolo
1 a
, Alessandro Longheu
2 b
, Michele Malgeri
2 c
, S. Sorbello
3
and A. Torcetta
3
1
Dipartimento di Matematica ed Informatica, Università degli Studi di Catania, Catania, Italy
2
DIEEI, Università degli Studi di Catania, Catania, Italy
3
Development and Support Center, BAX Energy, Catania, Italy
a.torcetta@gmail.com
Keywords: Monitoring Systems, Control System, Alarm Management, Agent Systems, Power Plants, Renewable
Energies.
Abstract: A power plant monitoring system is crucial for ensuring normal operation of the whole power plant as well
as initiating alarms to avoid further development of unattended fault within the power generating system. In
this work, a computer vision-based solution is introduced in order to quickly detect anomalies and possible
failure affecting the monitored infrastructure.
1 INTRODUCTION
Today, renewable energies as solar energy (thermal
and photovoltaic), hydraulic, wind and geothermal,
are a fundamental alternative to fossil fuels. Their use
indeed reduces not only gas emissions from energy
production and consumption, but also the dependence
on fossils fuels imports.
It is estimated that renewable sources have
satisfied globally almost 7% of the electricity demand
(BP, 2018). The problem of power plants condition
monitoring is crucial to the proper and effective
operation of any power generating system.
Today there are several types of monitoring, as
continuous monitoring, high frequency monitoring
and medium-low frequency monitoring. Continuous
monitoring can be applied on simple systems and
complex systems either in a non-critical or critical
context, where the desired values are known and must
be fulfilled. High frequency monitoring is applied
when the detection is not really continuous, rather at
a higher frequency compared to the monitored
process, so that any correction to the process can be
carried out meaningful and timely. Medium-low
frequency monitoring is typical in cases where
variables are generally very large, while surveys are
established on a daily, monthly or quarterly basis. The
a
https://orcid.org/0000-0002-1671-840X
b
https://orcid.org/0000-0002-9279-3129
c
https://orcid.org/0000-0002-9898-8808
time between surveys is also necessary to normalize,
sort, and convert data to make it accessible.
In the past, maintenance of power plants was
manually performed by personnel assigned to each
building with the aim of providing high-quality and
reliable power of communications facilities.
However, as the reliability of power plants improved
and new monitoring equipments were introduced,
systems began to shift towards centralized monitoring
and maintenance of multiple buildings from one
location (So and Chan, 1991). For this reason, today
the need for a centralized monitoring system has
increased more and more.
An effective monitoring can be also considered as
a strategy to periodically track the quality of power
plants, endorsing a better energy management, from
a single building (Cernian et al., 2013) to a wider
context (Kapoor and Garg, 2018), even IoT-based
(Domova and Dagnino, 2017).
In this paper we present the monitoring system
developed within Bax Energy (Baxenergy, 2019),
able to ensure that all system’s components are
properly up and running; it uses a system’s state
representation to timely identify eventual faults or
failure. Moreover, a real time problem solving
approach is adopted. There are several approaches to
monitor a system, from analysing frequent operating
mode patterns (HU et al., 2018), to predictive
658
Carchiolo, V., Longheu, A., Malgeri, M., Sorbello, S. and Torcetta, A.
Integration of Monitoring and Alarm Management in Power Plants.
DOI: 10.5220/0007754706580665
In Proceedings of the 21st International Conference on Enterprise Information Systems (ICEIS 2019), pages 658-665
ISBN: 978-989-758-372-8
Copyright
c
2019 by SCITEPRESS – Science and Technology Publications, Lda. All rights reserved
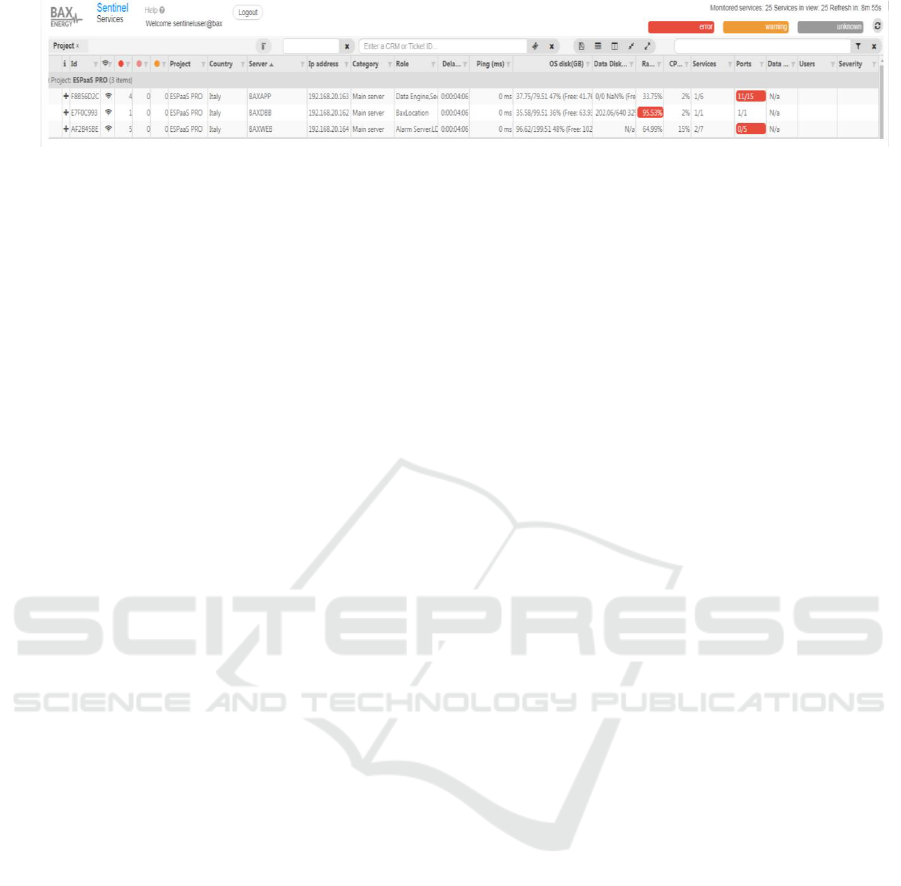
Figure 1: Sentinel status view – Detail.
modeling (Ryan, 2017) to proactively find potential
failures and triggering the maintenance personnel to
fix the issue timely .
A useful monitoring system must be able to
detect the failure in time, showing which system
components are affected. An incorrect localized
system fault, even in terms of simple time delay, or a
not detected fault (false negative) can have a
significant impact on the company.
In this paper, we will focus on two different tools
for monitoring systems: Sentinel, developed inside
BaxEnergy and Refocus (Refocus, 2019); both their
advantages and drawbacks are considered, in order to
select which one is better for proactive monitoring.
Finally, their integration with an alarm management
system is discussed.
The paper is organized as follows. In Section 2,
both Sentinel and Refocus monitoring systems are
introduced and compared, whereas in Section 3 the
alarm management that exploits monitoring systems
is discussed, showing our final remarks in section 4.
2 MONITOR SYSTEMS
2.1 Refocus Monitor System
Refocus is a platform developed by Salesforce
(Salesforce, 2018) for visualizing health and status of
a system. Originally, Refocus was developed to
communicate with Argus (Argus, 2018), a time-series
monitoring and alerting platform. Refocus provides
real-time visibility into a company’s products and
infrastructure. It’s easy to use and also allows to
improve data comprehension by connecting with
other tools into an unified platform.
There are two possible ways to deploy Refocus,
either on Heroku (Heroku, 2018), a cloud platform as
a service (PaaS) supporting several programming
languages used as a web application deployment
model, or alternatively it can be deployed locally as a
docker (a software container platform used to
increase compute density). Refocus requires Redis
(Redis, 2019) in-memory data structure store,
PostgreSQL database (PostgreSQL, 2019) and
Node.js cross-platform JavaScript run-time
environment (Node JS, 2019).
2.2 The Monitor System Sentinel
Sentinel software is a system developed by
BaxEnergy and used by Service Operation Center
(SOC). It consists of two main pillars: Sentinel as a
service and Sentinel as a website tool. Sentinel as a
website tool allows to monitor a network with
particular focus on the components of Energy Studio
Pro (Energy studio Pro, 2019), a renewable energy
management software. Its main goal is to quickly
detects the anomalies affecting the monitored
infrastructure. Sentinel as a service is a distributed
system running over multiple subnets. It is composed
by one or more agents interconnected one each other,
whose information are visualized through a web
interface shown in Figure 1.
Sentinel represents the entities to monitor as host
sentinel nodes. The possible entity metrics are
divided in basic properties (CPU, data delay,
memory, ping) and custom properties which depend
on the host sentinel. There are two different metrics
range values, i.e. warning and error. Hierarchy
dependency is given by the full name attribute of the
sentinel host.
In Sentinel, data are represented with a tabular
view developed in HTML5, AngularJS and
wijmo.grid. Information about the status of a host
property is detailed and it is possible to examine the
numeric value in addition to the different ranges of
the columns. Sentinel provides users data filtering,
sorting and grouping.
Finally, a logged user is provided with a table
containing all the available host, their current state
and related values, to be refeshed manually or
automatically every ten minutes.
2.3 Sentinel vs Refocus
Refocus is a visualization platform for system
monitoring. Users can see very easily if some value
of a specific aspect is critical or invalid. There are
four different thresholds with different colors, Green
Integration of Monitoring and Alarm Management in Power Plants
659
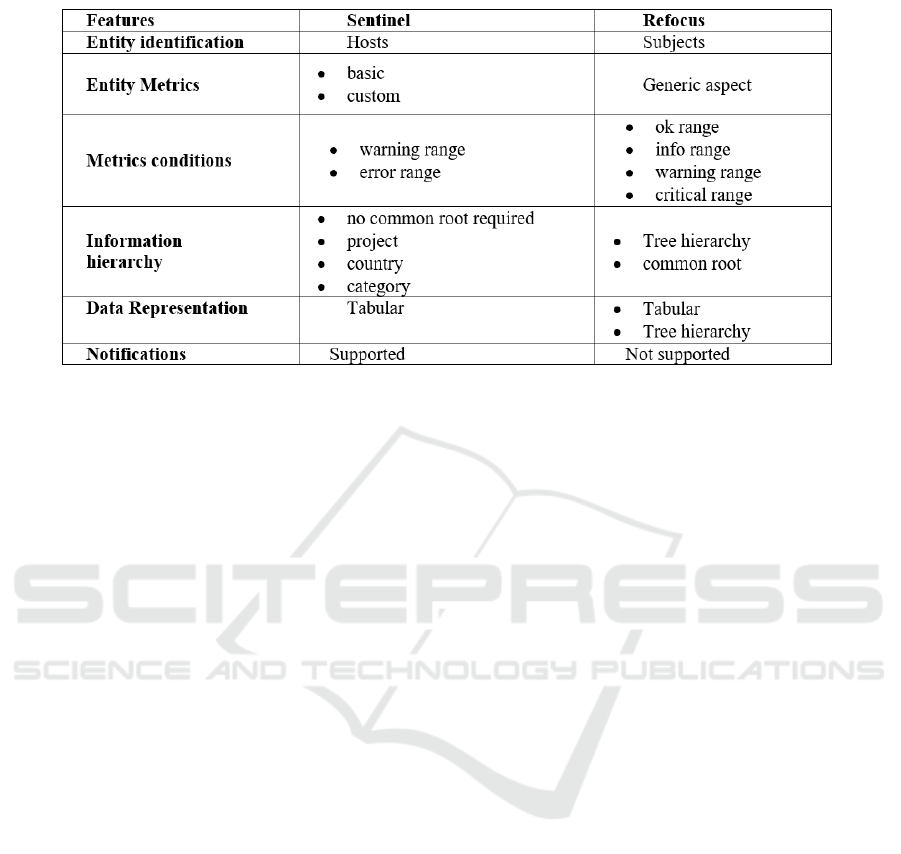
Table 1: Comparison between Sentinel and Refocus.
for “ok”, Blue if the status of a particular sample of
data is in info range, Yellow as warning and Red if
the status is in critical range.
In Sentinel, information about the status of a
host’s property is more detailed than in Refocus and
the numeric value in addition to the different ranges
of the columns is also shown.
Both systems receive real-time traffic data. The
Sentinel UI access data by polling the Sentinel Server,
while in Refocus data are pushed by the sources. The
Sentinel UI will expose the data samples with the
timestamp provided by the server that is different by
the time when the poll is performed, thus preserving
the source timestamp. Refocus instead assigns the
receiving time as the timestamp for the samples
pushed in this; if the data gathering is delayed the time
of sample acquisition is lost and a wrong timestamp
is assigned to the sample.
In Refocus data are refreshed instantly, whereas
in Sentinel table values are automatically refreshed
every 10 minutes (manually refresh is available).
An important difference between Sentinel and
Refocus is the filtering mode. In Refocus, if a user
wants to filter for a specific subject of a perspective
this one must be updated. Furthermore, fast filtering
by searching for a string in a text box is not supported.
Conversely, Sentinel lets the user filter, sort and
group data. The total number of available hosts in the
system is shown in the top right part of the window
and if any filter is applied to the grid, the second
number, which represents the host in view, is updated
with the number of hosts complying with the filter. In
Sentinel, you can group or ungroup the table on one
or more column. You can group by a column with the
drag and drop of a column header into the group
panel, or apply filters on single column values.
An important function Refocus that is missing is
the fast filter function which applies basic text filter
on some host properties. Sentinel allows to write a
string in the fast filter text box and only columns
complying to fast filter will be shown. This function
is case insensitive and it verifies if the string is
contained in any of project, country, server name,
category, type (used to filter/group hosts), IP of the
host and description. In Sentinel, you can take in
charge a specific column value or assign it to a
specific user. This allows to make the active phase
by opening a report in the expertise’s field; this is not
possible in Refocus.
In Sentinel the user is allowed to take in charge
each single property or the entire host whether the
server is in error or not. A user can take in charge a
property in error if the property is not part of a host
that has been taken in charge. In addition, when a user
takes in charge an host or a property that was taken in
charge by another user, the property is automatically
released from the original user. Taking in charge a
host means that the user automatically takes in charge
all the property error that happens from the point in
time in which he has taken in charge the host until the
moment he releases the host. While a user takes in
charge the host no more work can be performed on it.
Every server which is affected is associated with a
ticket id. In addition, the user will see in separate
columns the information about the number of errors
taken in charge. It is also possible to filter on this one.
It’s mandatory that a note has to be associated to each
take in charge action.
When a user takes in charge one or more servers
or properties, he will be shown in the view in the
‘users’ column. Refocus presents a significant
limitation compared to Sentinel: the sample does not
ICEIS 2019 - 21st International Conference on Enterprise Information Systems
660
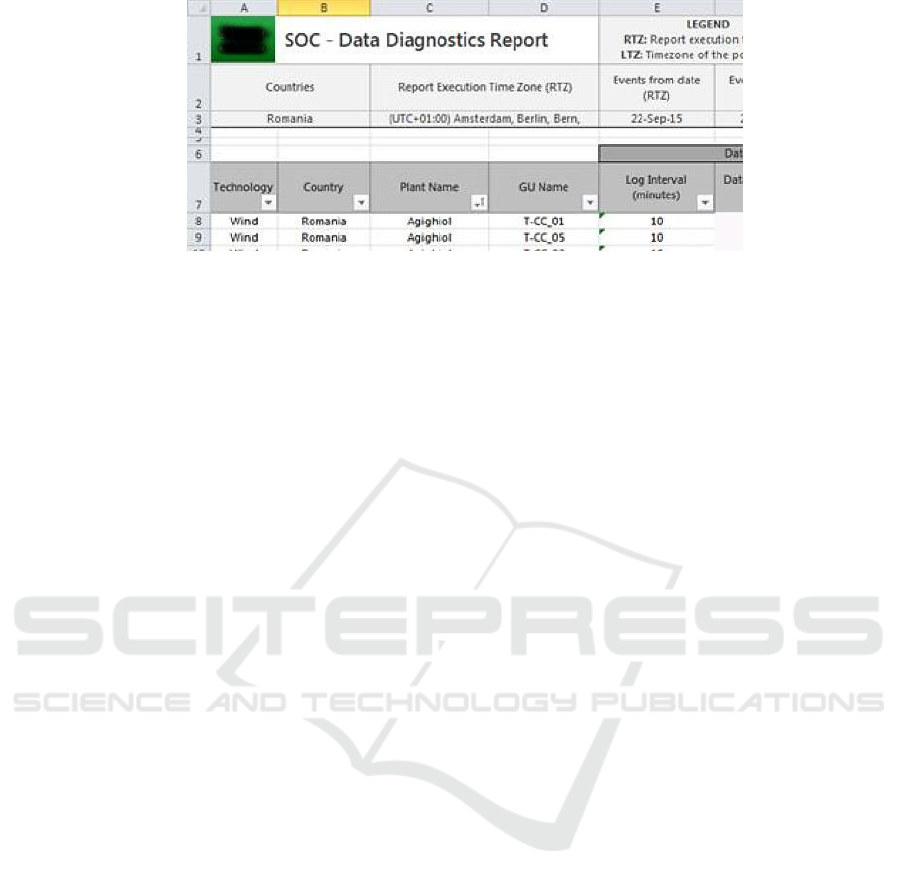
Figure 2: SOC - Data Diagnostic Report – Detail.
have the timestamp related the time when the data
was actually produced from the source.
Another important Refocus drawback relies is the
user experience during host navigation. Navigation
on specific properties is not dynamic as in Sentinel
where a better focus management is available.
According to Refocus, you have to create new
perspectives by inserting the root node containing
associated subjects. You need also to specifying
aspects that you would like to monitor.
In Sentinel we only have two thresholds: warning
and error. Four thresholds can be an advantage for
monitoring certain properties whose trend is changing
over time (in a negative way) to allow a proactive
approach. Furthermore, there is the possibility of
using only some thresholds for some properties rather
than others and this is an advantage of Refocus.
In Sentinel, for data representation, you do not define
a common root for all the nodes you want to monitor.
However, this is necessary in Refocus if you want to
be aware of what is happening on the different
subjects’ properties.
Finally Sentinel, unlike Refocus, allows the
handling of any failure messages. Table 1
summarizes the overall comparison.
3 ALARM MANAGEMENT
One of BaxEnergy's use cases is designing,
integrating and deploying Worldwide Monitoring
Room (WMR). The WMR consists of different
subsystems from different vendors which have been
connected together to a central server infrastructure
located in Rome. In a WMR all data flows from
national Local Control Room (LCR), a room where
there are technicians involved in monitoring all power
plants. LCRs and WMRs are based on Energy Studio
Pro, that retrievies data from all power plants in Italy.
Data Monitoring can be either:
- Soft real-time, if data are available after minutes,
acquired by Live Data Manager (LDM), a module
designed to perform real-time bridging between
equipment on the field (e.g. a wind turbine, PV
inverter, PLC etc.) and client applications requesting
data for visualization or business logic and then
processed;
- Historical, when data are available after hours,
the main use is for the KPI (Key Performance
Indicator) calculation and O&M activities (Operation
and Maintenance), but also as a basis for forecasting
the future data or trends.
Sentinel arises from the need of the Service
Operation Center (SOC) to have a monitoring system
up and running 24x7 h from hardware infrastructure
in power plant to WMR and LCR monitors. SOC is a
service offered to customers for monitoring the data
acquisition chain of an LCR, the data completeness
and the data quality.
The SOC service focuses on three main aspects:
Network diagnostics: monitoring of devices and
nodes responsible for data acquisition, data
transmission, data processing and data storage;
Data diagnostics: measurement of data quality
and completeness;
KPI Calculation: calculation of key
performance indicators for the hardware nodes and
software applications.
A sample of data collected by SOC is shown in
Fig. 2. The goal is to maximize the business value
chain and Data Quality throughout the whole data
acquisition chain. The SOC must (a) Detect problems
and take in charge anomalies (b) Make appropriate
corrections and check if they went successful.
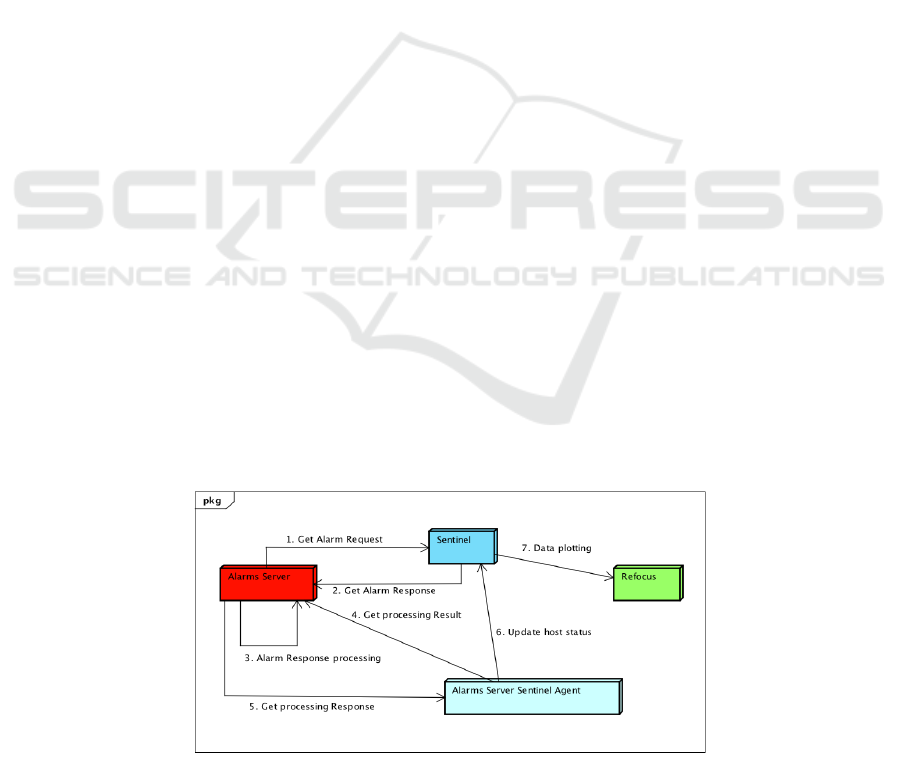
3.1 Architecture
In the alarm management system there are three main
actors: Sentinel, Alarms Server and Refocus (see Fig.
3). Sentinel consists of one or more agents (e.g.
Alarms Server Sentinel Agent), connected each other.
Integration of Monitoring and Alarm Management in Power Plants
661
Alarms Server is an engine that is able to generate
Alarms according to rules applied on two types of
data: real-time data and historical data. Finally,
Refocus is a platform used to understand, visualize
and analyze the health and the status of systems
and/or services under observation.
The operations sequence is the following:
1. First, the Alarms Server’s module requires
Sentinel’s module the value or the values for a
property or possibly for properties of a Sentinel’s
host.
2. Sentinel responds with required information
3. The Alarms Server’s engine processes the
request and calculates the alarm status (active or
inactive) associated with this one.
4. In parallel to the previous activities, a Sentinel
Agent named Alarms Server Sentinel Agent
performs polling requests asking the result of the
previous computation.
5. Alarms Server responds satisfying agent request.
6. The Alarms Server Sentinel Agent updates the
host status (whose property or properties
has/have been requested).
7. With a specific data ingestion module, Sentinel
sends the data to Refocus which allows it to
display through a dashboard.
More in detail, Refocus requires Node.js, Redis
and PostgreSQL. Redis and PostgreSQL must be up
and running. Node.js is used also for token-based
authentication.
3.2 Alarms Server
Alarm systems are the most important tools providing
process plant operators to improve power plant
performance and monitor plant safety. Process plant
operators are often heavily burdened with alarms both
during steady-state operation and following plant
upset. Events and alarms are the basis for system
status understanding and decision making process
(Liu, 2003).
Alarm management is a traditional feature of
Supervisor control and data acquisition (SCADA)
and distribution management systems (DMS).
SCADA systems are implemented in various types of
industries. The main reasons of development and the
use of these systems are to (1) support a better control
of distributed systems and (2) reduce cost and
maintaining assets.
SCADA specialties fall in the remote control of
systems and in the large distance between end
terminal units and the main control unit but in some
scenarios the communication system may be a
conflicting element in the system (Chumki, 2013).
In the case of well-defined alarms, operators can
return the process to its normal operation and prevent
dangerous situations that can lead a disaster.
Therefore, alarms must be defined exactly on the
borderline of normal and abnormal operation, thus
avoiding unnecessary alerts and situations where
there is no enough time to take action. In ideal
situations, the signals of operators have defined so
that alarms require immediate actions, while
warnings do not appear.
The Alarms Server is a centralized module which
provides alarming functionalities. It is able to
generate events according to user-defined rules. The
Alarms Server can also be helpful to identify faulty
equipment, create maintenance work orders and
improve on operator’s effectiveness.
The user-defined rules can be applied on the
following data:
Real-time data: where the data source is the Live
Data Manager (LDM), a server application that
collects data arriving from all the real-time data
sources, careless of the source protocol, and
exposes them as a proper interface;
Figure 3: Alarm Management system architecture.
ICEIS 2019 - 21st International Conference on Enterprise Information Systems
662

Historical data: where the data source is
BaxEnergy ESP Historical Database, which
contains all the aggregated data coming from the
power plants (at five or ten minutes, depending
on the plant technology).
The Alarms Server is able to monitor parts of a
process that may require operator attention when
defined threshold are reached, e.g. safety limits of
equipment, event detection, abnormal situation and
similar. It also can be used to collect and record
alarms for audits or used in correlation with other
historical data.
Once events are generated, they can be sent to an
Alarm Client, which can be integrated in other
applications (in this case inside a Sentinel agent
called Alarms Server Agent), and these events are
automatically stored into an Alarms History database.
Once defined, the alarms in the system are
automatically generated, based on the operating
conditions and actions performed in the process plant,
so they provide advisory information to help
operators focus on important alarm information and
take correct, quick actions.
3.3 Alarms Configurator
The Alarms Server is a Windows Service that reads
from a configuration module named Alarms
Configurator. Thanks to this module, the end-user
can edit the configuration of the alarms. The Alarms
Configurator is a desktop application which is
responsible of the real-time data configuration and
alarms definition. Alarms can be created and
configured in the Alarm tab located in the right panel
of the window. The main elements of this tab are:
• Alarm Groups, represent common alarms or alarm
grouped by RES technology (e.g. wind,
photovoltaic, or based on user defined criteria), a
set of alarms that shares the same execution
settings;
• Areas, can be refer to specific alarms categories
(as environmental, measurements, status);
• Symbols, items created in order to configure
alarms for particular groups of devices. A sort of
devices subset, which replicates the rule of an
alarm over a set of multiple devices.
In order to specify a value for a certain Sentinel
host property you have to set a field of the Alarms
Configurator called condition, which represents the
scalar value that will be monitored. This one
represents a generic expression, which make use of
IronPython, an open-source implementation of the
Python programming language which is tightly
integrated with the .NET framework in order to use
Python code easily (Ironpython, 2019), and a specific
syntax to evaluate the input string and if it’s an
historical alarm this one will be stored in a database.
3.4 Creating New Alarm Sentinel Hosts
In order to create a Sentinel host property alarm, first
you have to create an Alarm Group, then the
following steps can be carried out:
• Specify Alarm name, e.g.
“WindowsServicesAlarm”;
• Check if this alarm is Historical or not
• Check if this alarm is Active or not
• Insert the condition (syntax is shown below)
• Chose the Alarm type
• Additionally, you can specify other properties.
The condition syntax is expressed as:
{SentinelServer#hostProject.hostName |
hostProperty}
It is also possible to control more than one property
associated to the same host by using and/or operators.
The current syntax does not allow to specify more
than one host in a single alarm because you have to
specify also the Alarm identifier which represents the
name of a single host.
Considering Alarm types, which indicates the
type of condition that triggers the alarm, the following
values can be distinguished:
Hi, HiHi: the alarm triggers if the value in the
condition field is over a selected threshold. Hi
and HiHi represent two different levels of
severity.
Low, LowLow: the alarm triggers if the value in
the condition field is under a selected threshold.
Low and LowLow represent two different levels
of severity.
Digital: the alarm triggers if the value in the
condition field is true (in this case you don’t have
to insert a threshold).
User Input: the status of the alarm is set by an
external process.
Rate of Change (RoC) Analog: the alarm triggers
if the number of changes of condition field (ΔV)
exceeded the limit in a given time frame (ΔT).
Sequence Digital: the script that is called by the
condition field has the responsibility to manage
the status transitions of the alarm, through the
property “alarmState”. It is also possible to store
variable to maintain the status of the script in a
specific memory area that is hold between
different executions.
Rate of Change (RoC) Digital: the alarm triggers
if the condition field occurs in a True value for a
Integration of Monitoring and Alarm Management in Power Plants
663

specified number of times in a given time frame.
The other additional properties that can be specified
in an alarm definition are:
Symbol: the symbol the alarm applies to
Limit: applies only to alarms of the Hi, HiHi,
Low and LowLow types and defines the
threshold limit of the value in the condition field
to trigger the alarm
Deadband: represents the range of values above
and beyond the limit where the alarm is inactive.
It’s applied only to alarms of the Hi, HiHi, Low
and LowLow types
Severity: indicates the severity of the specific
alarm. According to OPC specification this value
ranges from 1 to 1000
Message: indicates the message text defined for
the current alarm, as a static string, an IronPython
expression or a tag value
Code: the user defined code of the current alarm
Area: one or more areas associated to the alarm
Site: the power plant associated to the alarm
Device: the device associated to the alarm
Model: the model of the alarm device
Ack: when this check-box is marked, the alarm
will require acknowledgement by the operator
3.5 Sentinel Data Hub
A generic data hub is a data collection from multiple
sources organized to share and distribute, providing
an organization with a centralized data source.
Sentinel does not have an alarm management
system and it’s not be able to throw alarms when a
particular condition occurs by means of which to
connect alarms with Sentinel host properties. This
lack is compensated with an enhancement of an
Alarms Server local instance. With the Alarms
Configurator indeed we can attach alarms to host
Sentinel properties by inserting the property
condition in the field, leading to a so-called Sentinel
data hub to access data in Sentinel and consequently
triggers alarms based on variations exceeding the
relative property’s threshold, in monitored properties.
Starting from a generic data hub Alarms class, it
has been developed a Sentinel data hub class which
inherits from the previous and represent a particular
kind of data hub for Sentinel traffic. This class
provides alarm generation based on host Sentinel
properties and overrides the following methods:
1. Initialize, which calls for the first time
GetValues() that updates host Sentinel properties
and status.
2. BuildPath, returning a DataHubPath from
a) the source identifier, in this case
“SentinelServer”;
b) the source path, whose syntax follows this format:
hostProject.hostName|hostProperty;
c) and a parameter whose value indicates if the
source is valid or not.
3. Subscribe, which provides the subscription to
alarms (not to properties of the host) by
specifying the alarm path. It takes in input an
array of alarm’s paths and a sampling rate.
4. Commit, which calls a scheduler that
periodically executes the GetValues() method for
updating the host properties and status.
5. GetNextValidTimestamp, which returns the next
valid timestamp starting from a list of requests
which receives in input. In particular a
comparison is made between timestamp values
from incoming requests with a value representing
the last valid timestamp. The last valid timestamp
value will be the result of the search for the
minimum of all timestamp transmitted by these
requests.
6. Read, which reads the timestamps of the
incoming items and if this one is the same as the
one required, is added to the result, otherwise
not. In this way a collection of items, whose
timestamp is the required one, is created and
returned.
The timestamp required is specified as an input
parameter of the function. In the example shown in
Figure 4, there are 3 generic properties of a unique
host, and the timestamp 12:20 has been chosen since
it is the minimum value. Although there may be some
recently updated properties, only values with
associated timestamp of 12:20 will be read.
3.6 Alarms Server Sentinel Agent
Sentinel is composed of a variable number of Agents.
Agents are modules responsible of monitoring a
certain host type. They can be considered as
connectors for a particular host type. By
implementing an agent connected to a specific
Alarms Server it will be possible to immediately
recognize problems in this Alarm Server connection.
So, this Alarms Server Sentinel Agent was developed
to be able to add alarm management and calculation.
What has been developed can be considered as an
improvement to Sentinel.
The Alarms Server Sentinel Agent is used to
monitor all the active alarms of the host properties.
To accomplish this enhancement of the Sentinel
system, first a Sentinel instance is installed locally
and modified the configuration files, and then an
ICEIS 2019 - 21st International Conference on Enterprise Information Systems
664
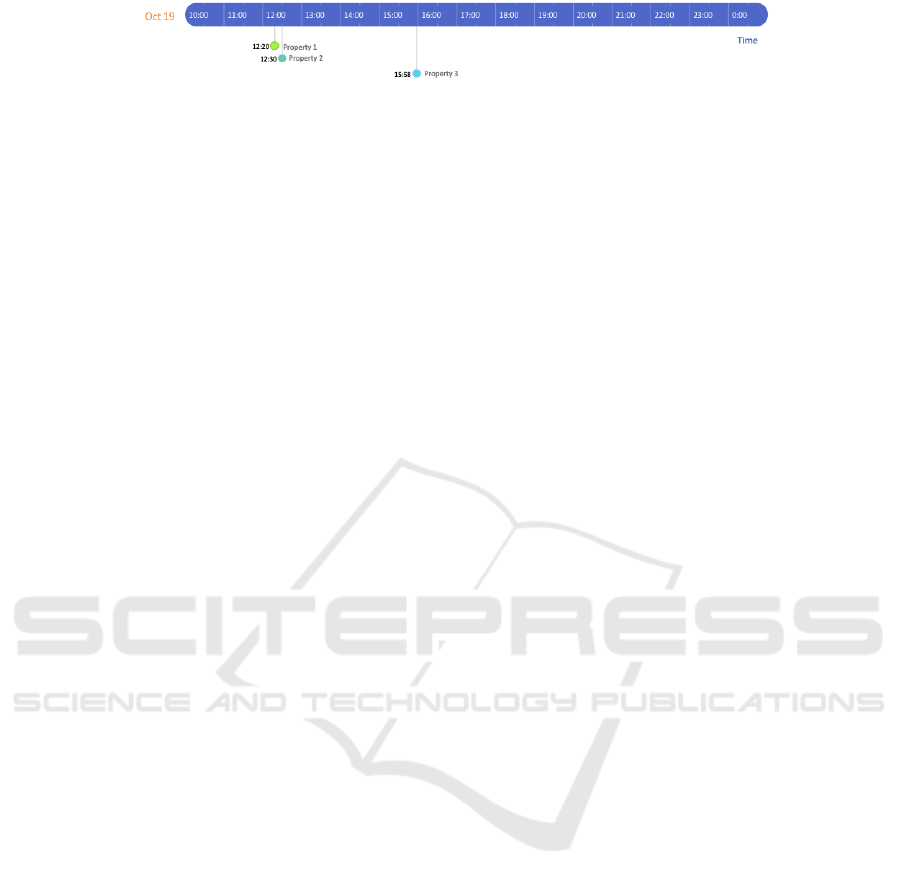
Figure 4: Timeline diagram example.
agent using the composite pattern is created.
To implement the Alarms Server Sentinel Agent
within Sentinel it has been used the UML composite
design pattern. In software engineering, the
composite pattern is a partitioning design pattern
which describes a group of objects that is treated the
same way as a single instance of the same type of
object. It’s one of the 23 well-known GoF design
patterns that describes how to solve recurring design
problems to design flexible and reusable object-
oriented software. It is used where we need to treat a
group of objects in similar way as a single object.
The aim is to compose objects into tree structures
to represent part-whole hierarchies. So, you can work
through the component interface to treat leaf and
composite objects uniformly. In this case, composite
pattern allows to treat single agents as Alarm Server
Sentinel Agent or WMI Agent and Composite Agents
uniformly, so there is no difference between a leaf-
node and a branch. Individual leaf objects implement
the component interface directly, and composite
objects forward requests to their child components.
4 CONCLUSIONS
In this work, the open source monitoring system
Refocus has been considered. Data on Refocus came
from Sentinel, which has a twofold value (1)
distributed software system and (2) monitoring
system of the different hosts. Refocus and Sentinel
monitoring system have been compared; moreover,
the integration of Sentinel with the Alarms Server has
been discussed. A proactive approach allows the
system to plan appropriate actions timely, thus
preventing problems before they occur. An effective
monitoring saves both costs due to unforeseen
failures and to physical replacement of all monitoring
chain elements out of service or whose behavior is un
expected. Since the agent responsible to acquire data
status has not yet been implemented, a possible future
developments of Sentinel is to create this agent to
allow Alarms Sever to manage such alarms as well.
REFERENCES
BP, 2018. BP Energy Outlook. Online:
https://www.bp.com/en/global/corporate/energy-
economics/energy-outlook.html
So, A. T. P., Chan, W. L., 1991. A computer-vision based
power plant monitoring system. In proc. Of APSCOM-
91., Hong Kong, pp. 335-340 vol.1
Cernian, K. et al. , 2013. A Service-Oriented Alarms
System for Intelligent Building Management. In 19th
Intl Conf. on CSCS., IEEE press
Kapoor, M. and Garg, R.D., 2018. Cloud computing for
energy requirement and solar potential assessment. In
Spatial Information Research, Vol. 26, Issue 4. Springer
Domova V. and Dagnino, A., 2017. Towards intelligent
alarm management in the Age of IIoT. In Global
Internet of Things Summit (GIoTS), IEEE press
BaxEnergy, 2019. Online: https://www.baxenergy.com.
Hu, W. et al., 2018. Discovering Association Rules of
Mode-Dependent Alarms From Alarm and Event Logs.
In IEEE Trans. on Control Systems Technology, 26-3
Ryan, E., 2014. Improving alarm management efficacy
through predictive modeling and trending. In 40th
Annual Northeast Bioengineering Conf. IEEE press
Refocus, 2019. Online: http://refocus.sourceforge.net/
Salesforce, 2019. Online: https://www.salesforce.com
Argus, 2019. Online: https://github.com/salesforce/argus.
Heroku, 2019. Online: https://www.heroku.com.
Redis, 2019. Online: https://redis.io/
PostgreSQL, 2019. Online: https://www.postgresql.org/
Node JS, 2019. Online: https://nodejs.org
Liu J. et al., 2003. The Intelligent Alarm Management
System. In IEEE Software. Vol. 20, no. 2
Chumki et al., 2013. Real-time alarm management system
for wide-area monitoring. In IEEE Innovative SGT.
Ironpython, 2019. Online: http://ironpython.net/.
Integration of Monitoring and Alarm Management in Power Plants
665
