
IoLT Smart Pot: An IoT-Cloud Solution for Monitoring Plant Growth in
Greenhouses
J. Hadabas
1
, M. Hovari
2
, I. Vass
2
and A. Kertesz
1
1
Software Engineering Department, University of Szeged, Hungary
2
Institute of Plant Biology, Biological Research Centre, Hungary
Keywords:
Internet of Things, Cloud Computing, Plant Phenotyping, Gateway.
Abstract:
According to a recent Beecham Research report, food production have to be increased by 70 percent till 2050
to feed 9.6 billion global population predicted by the United Nations Food and Agriculture Organisation.
Since Cloud Computing and the Internet of Things (IoT) have already opened new ways for revolutionizing
industrial processes, these technologies could be important for the farming industry. Smart farming has the
potential to improve productivity and reduce waste to transform agriculture. Plant phenotyping is an important
research field that gained a high attention recently due to the need for complex monitoring of development
and stress responses of plants. However, the current phenotyping platforms are very expensive, and used in
large central infrastructures, which limit their widepread use. The newly emerging ICT technologies together
with the availability of low cost sensors and computing solutions paved the way towards the development of
affordable phenotyping solutions, which can be applied under standard greenhouse conditions. The Internet of
Living Things (IoLT) project has been launched to integrate IoT technological research with applied research
on specific, biological applications. In this paper we introduce our research results for developing a low cost
plant phenotyping platform for small sized plants, which is one of our goals in this project. The proposed
IoLT Smart Pot is capable of monitoring environmental parameters by sensors placed above the plant and into
the pot, managed by a Raspberry Pi board placed under the pot. We have also developed a private IoT-Cloud
gateway for receiving, storing, visualizing and downloading the monitored parameters sent by the pot devices.
We have performed the evaluation of our proposed platform both with simulated and real smart pots.
1 INTRODUCTION
The United Nations Food and Agriculture Organisa-
tion predicts that by 2050 global population will grow
to 9.6 billion. A recent, corresponding Beecham Re-
search report (Beecham Research, 2017) states that
food production have to respond to this growth by
70 percent increase till 2050. Agriculture also need
to be reformed since it is currently responsible for
a fifth of greenhouse gas emissions and for 70 per-
cent of the worlds fresh water usage. They also ar-
gue that smart farming has the potential to improve
productivity and reduce waste by exploiting new ICT
technologies, such as the Internet of Things (IoT).
IoT represents a dynamic global network infrastruc-
ture with self configuring capabilities (Sundmaeker et
al., 2010), in which things can interact and commu-
nicate among themselves and with the environment
through the Internet by exchanging sensor data, and
react autonomously to events and influence them by
triggering actions with or without direct human inter-
vention. Such systems can be utilized in many appli-
cation areas, thus they may have very different prop-
erties. According to recent reports in the IoT field
(e.g. (Mahoney et al., 2011)), there will be 30 bil-
lion devices always online and more than 200 billion
devices discontinuously online by 2020. Such esti-
mations call for smart solutions that provide means to
interconnect and control these devices in an efficient
way.
Cloud computing (Buyya et al., 2009) enables
flexible resource provisions that have become hugely
popular for many businesses to take advantage of re-
sponding quickly to customers demands. There is
a growing number of cloud providers offering IoT-
specific services, since cloud computing has the po-
tential to serve IoT needs such as hiding data genera-
tion, processing and visualization tasks. With the help
of these virtualized solutions, user data can be stored
in a remote location and can be accessed from any-
144
Hadabas, J., Hovari, M., Vass, I. and Kertesz, A.
IoLT Smart Pot: An IoT-Cloud Solution for Monitoring Plant Growth in Greenhouses.
DOI: 10.5220/0007755801440152
In Proceedings of the 9th International Conference on Cloud Computing and Services Science (CLOSER 2019), pages 144-152
ISBN: 978-989-758-365-0
Copyright
c
2019 by SCITEPRESS – Science and Technology Publications, Lda. All rights reserved

where.
Plant phenotyping covers high throughput ap-
proaches, which make possible to monitor the growth,
physiological parameters, and stress responses of
plants with high spatial and temporal resolution by us-
ing the combination of various remote sensing meth-
ods. Until recently typical plant phenotyping plat-
forms used very expensive instrumentation to moni-
tor several hundreds to few thousands of plants. Al-
though these large infrastructures are very powerful,
their high cost, in the range of few mEUR per plat-
form, limited their widespread, everyday use. Due
to the recent development in computer, sensor, and
IoT technology a promising alternative, called afford-
able phenotyping, started to develop, which applies
low cost sensors and computing solutions for moni-
toring fewer number of plants with high flexibility in
standard greenhouse environment.
The goal of our research is the development of a
low cost plant phenotyping platform for small sized
plants, which enables the montoring of growth of
leaves and shoots in parallel with the monitoring of
environmental parameters, as well as the development
of an IoT Cloud platform capable of collecting, stor-
ing and visualizing environmental data.
The remainder of this paper is presented as fol-
lows: Section 2 introduces related works, and Sec-
tion 3 discusses the background, the research goals
and the applied idea. Section 4 presents our proposed
support gateway using IoT Cloud technologies, and
also shows its evaluation about its scalability and de-
vice management features. Finally, the contributions
are summarized in Section 5.
2 RELATED WORK
Nowadays, we can find smart solutions in the com-
mercial world for many household areas, including
indoor plant monitoring, e.g. Xiaomi Flora (Sharma,
2018) and Parrot pot (Parrot Pot, 2018). They are
mostly capable of monitoring light, humidity and salt
content of the plant soil, and able to communicate
with nearby devices via Bluetooth. For professional
usage, there are only very few commercially available
platforms for affordable phenotyping (e.g. PhenoBox
(CzedikEysenberg et al., 2018)). However, they are
typically limitied to monitoring only a single plant.
Brogi et al. (Brogi et al., 2018) have developed
a hands-on lab activity for educational purposes by
monitoring a single plant. Their goal was to exem-
plify the use of IoT, Fog and Cloud technologies. We
exploit a similar idea for using these technologies, but
we propose a complex platform usable for real world
greenhouse application.
Dagar et al. (Dagar et al., 2018) proposed a model
of a simple smart farming architecture of IoT sensors
capable of collecting information on environmental
data and sending them over wireless networks to a
server. There are also generic solutions to monitor
IoT systems including agriculture applications, such
as the Kaa IoT Platform (Kaa project, 2018). It is
a commercial product that is able to perform sensor-
based field and remote crop monitoring. It also has
an open source version called the Kaa Community
Edition. Such generic toolkits are quite complex and
heavy-weight, so they are not well suited to specific
needs.
Concerning generic IoT gateways, Kang et al.
(Kang et al., 2017) introduced the main types and
features of IoT gateways in a detailed study, which
presents the state-of-the-art and research directions in
this field. This solution is also too generic for our
needs.
In contrast to these solutions, our approach aims
to provide a low-cost solution using the latest IoT and
Cloud techniques to enable a robust and scalable solu-
tion to be used for groups of plants with user friendly
management.
Figure 1: IoLT project tasks.
3 THE IOLT SMART POT
3.1 The Internet of Living Things
Project
The University of Szeged and the Biological Research
Centre of the Hungarian Academy of Sciences work
together to create a Network of Excellence called the
Internet of Living Things (IoLT) since 2017. This
project aims to integrate IoT technological research
with applied research on specific, biological IoT ap-
plications. The project will create an opensource IoLT
programming platform based on JavaScript. It will
IoLT Smart Pot: An IoT-Cloud Solution for Monitoring Plant Growth in Greenhouses
145
be able to execute applications on cheap, low capac-
ity IoT devices by providing easy to use program-
ming interfaces, thus enabling application develop-
ment for researchers of any discipline. Technologi-
cal developments will address the JavaScript executor
engine, software-hardware porting, programming en-
vironment, secure management algorithms and soft-
ware quality.
Figure 1 depicts the main development tasks (de-
noted by F1, F2 and F3) of our project. The IoLT
application areas (within F3) address (a) the develop-
ment of a smart pot for plants enabling complex plant
phenotyping using medium-high throughput charac-
terization of plant growth and physiological status,
(b) the development of a smart watch for perform-
ing actigraphy to investigate ultradian activity lev-
els of patients in psychosocial treatments, and (c)
the development of Lab-on-a-chip systems for en-
hanced microfluidic diagnostic technologies for high-
throughput cell analysis.
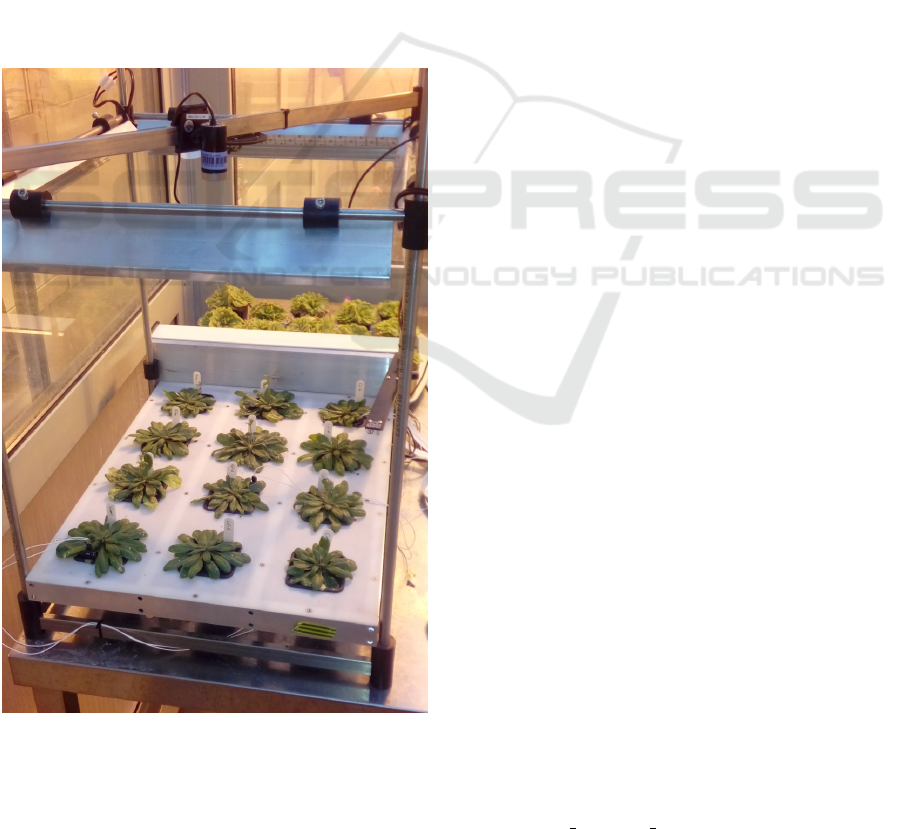
Figure 2: IoLT Smart Pot prototype.
3.2 Designing and Assembling the IoLT
Smart Pot
We have developed a low cost plant phenotyping plat-
form for Arabidopsis and other small sized plants.
The platform consists of a cluster of 12 pots (in 4x3
matrix) with individual plants, and uses a low-cost
computer based system to monitor plant growth and
environmental parameters. Plant growth is moni-
tored by using an RGB camera, located above the
plant cluster, as shown in Figure 2. The cluster is
also equipped with an LED-based illumination sys-
tem, which allows supplementing the natural light,
if needed. The usual frequency of image capture is
one hour, but it is possible to increase it up to one
minute for higher time resolution. Environmental pa-
rameters are monitored by sensors (light intensity, air
temperature, relative air humidity), placed above the
plants, as well as soil humidity sensors placed into
selected pots. The data are stored temporarily on a
memory card of the computer, and it can be trans-
ferred via WiFi connection to a database located in
a local server or in the cloud. Segmentation of plant
related green pixels and calculation of projected leaf
area is performed by a home-developed software. The
system was tested during a one-month growth period
with WT Arabidopsis plants. The used one hour im-
age capture frequency revealed a circadian change in
the projected leaf area due photoperiod dependent leaf
movements. The proposed IoLT Smart Pot system
allows to monitor the effect of various stress factors
(drought, nutrition, salt, heavy metals, etc.), as well
as behavior of various mutant lines.
4 IOT-CLOUD GATEWAY FOR
DATA MANAGEMENT
4.1 Overview of the Gateway
Application
The architecture of our proposed IoT-Cloud gateway
can be seen in Figure 3. It is composed of three ser-
vices. We have developed a (i) Node.js Webapp appli-
cation to provide a web-based graphical interface for
grouping and managing pots and users in the form of
projects. Users can register pots, and create projects
for a certain time interval, to which additional users
and already registered pots can be assigned. It is also
capable of visualizing the sensor values gathered from
one or more pots added to a project. In Figure 4,
we visualized experimental results of a cluster of pots
(called BRC Smartpot 1) of a project (titled Real BRC
CLOSER 2019 - 9th International Conference on Cloud Computing and Services Science
146
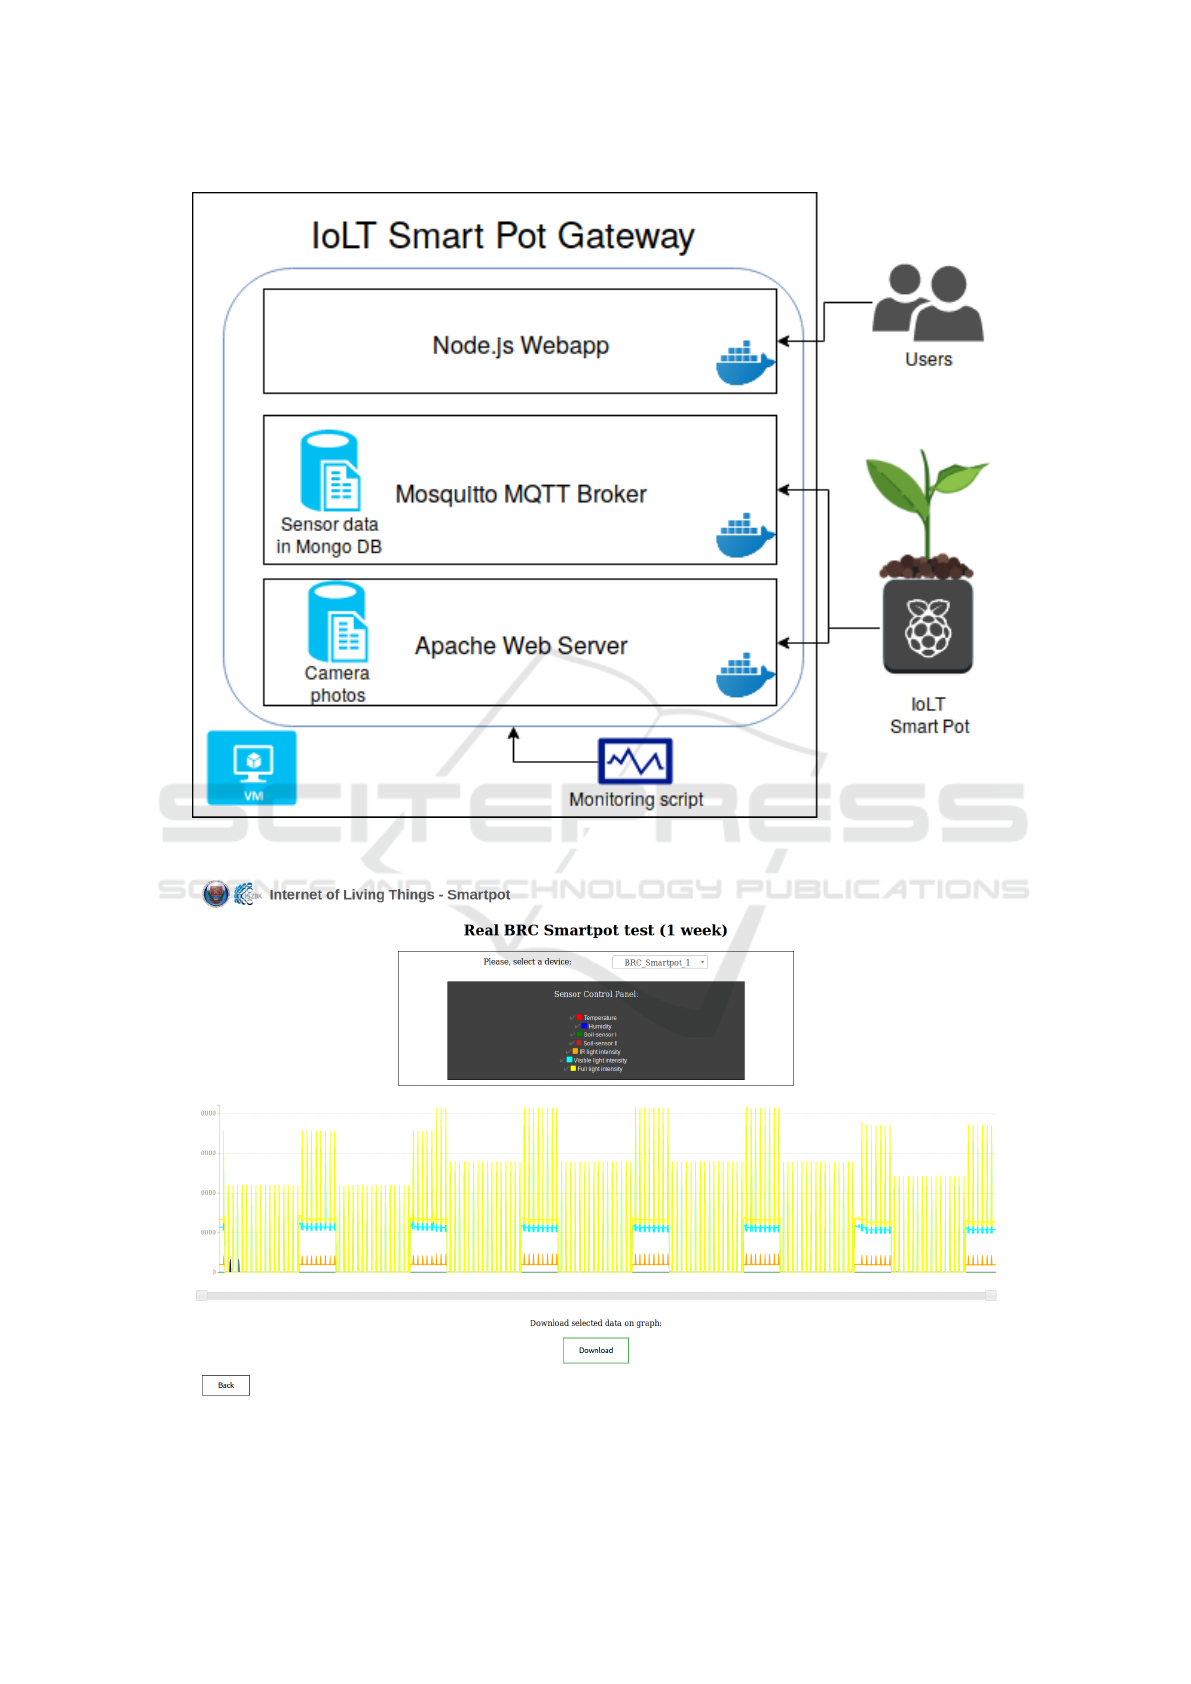
Figure 3: The architecture of the IoLT Smart Pot Gateway.
Figure 4: Historical sensor data visualization in the IoLT Smart Pot Gateway.
IoLT Smart Pot: An IoT-Cloud Solution for Monitoring Plant Growth in Greenhouses
147
Smartpot test (1 week)) depicting values of 7 sensor
types for a week of utilization. As we can see, if all
of the sensor types are selected on the graph, some
curves may overlap. We can adjust the time inter-
val (on the x-axis, while the y-axis denotes the ac-
tual sensor values), and switch on and off the sensor
types, and download the set of values according to
the defined visualization parameters in CSV format.
The downloaded file can be used by the associated re-
searchers for further processing.
We have also developed a microservice called
Mosquitto MQTT Broker (ii), which is built on the
open-source Mosquitto tool (Mosquitto, 2018), using
a MongoDB (MongoDB, 2018) database to store the
received sensor values. The monitored 7 sensor types
of a pot are described by a JSON document, regu-
larly sent by the Smart Pot to the MQTT broker of
this microservice directly. The sensors of a pot is
managed by a python script implementing an MQTT
client. This script can be configured with a pot iden-
tifier, sensor value sampling frequencies and picture
taking frequencies, hence each IoLT Smart Pot (which
is a cluster of pots in our case) is equipped with a cam-
era. The pictures taken are sent directly to our third
microservice called Apache Web Server (iii) via SFTP
connection.
The source code of our proposed gateway is avail-
able at (IoLT Smart Pot Gateway Source, 2019). Con-
cerning the implementation of these microservices,
we used the Docker container technology (Docker,
2018). Each microservice is placed in a Docker
container, and the three of them are composed to-
gether, since the Node.js Webapp reads the sensor
values stored in MongoDB and the pictures stored at
the Apache server. Finally, the composed microser-
vices are placed in a virtual machine (VM), in which
the container performance values are monitored by a
script (which we use for the evaluations in the next
section). The VM containing the microservices can
be placed to any cloud. In our case, it is instantiated
in the MTA Cloud (MTA Cloud, 2018) with a small
VM flavor (having 1 virtual CPU core and 2 GB RAM
memory). The MTA Cloud is an OpenStack-based
national community cloud financed by the Hungarian
Academy of Sciences in order to provide cloud ser-
vices for scientists from the academy.
4.2 Evaluation with Simulated Smart
Pots
In order to evaluate our proposed phenotyping plat-
form, first we performed a detailed evaluation by
means of simulation. After some initial measure-
ments, we got to know the exact, real data value
{
"Project": "SampleProjekt",
"Soil-sensor II": "434.437",
"Full light intensity [lux]": 16901.38,
"Time": "2019-01-14 14:02:56",
"Humidity [%]": "41.1",
"Soil-sensor I": "594.940",
"IR light intensity [lux]": 15865.80,
"Temperature [C]": "21.8",
"Visible light intensity [lux]": 1035.58
}
Figure 5: Sample JSON message of 7 sensor values of a pot.
ranges for the installed sensors, therefore we de-
signed a simulated Smart Pot represented by python
scripts capable of sending generated sensor data via
the MQTT protocol. Figure 5 presents a generated
sample JSON file for the considered sensor types.
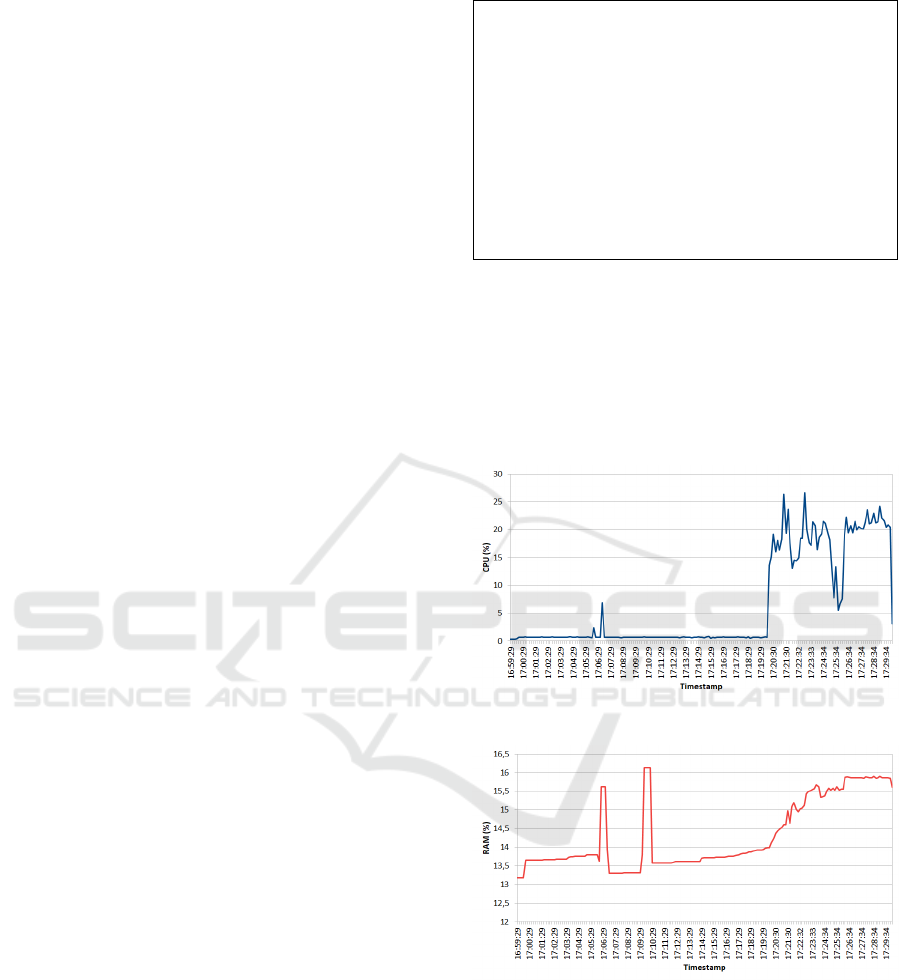
Figure 6: CPU measurement results for 250 pots.
Figure 7: Memory measurement results for 250 pots.
First, we created 250 simulated pots with scripts
that sent generated sensor data to our IoLT Smart
Pot Gateway service (deployed at MTA Cloud) for 30
minutes. We divided the total experiment time-frame
to the following periods:
• in the first 10 minutes we applied sensor data gen-
eration frequency of 30 seconds (which means
that each pot sent a message of 7 sensor values
every 30 seconds);
CLOSER 2019 - 9th International Conference on Cloud Computing and Services Science
148
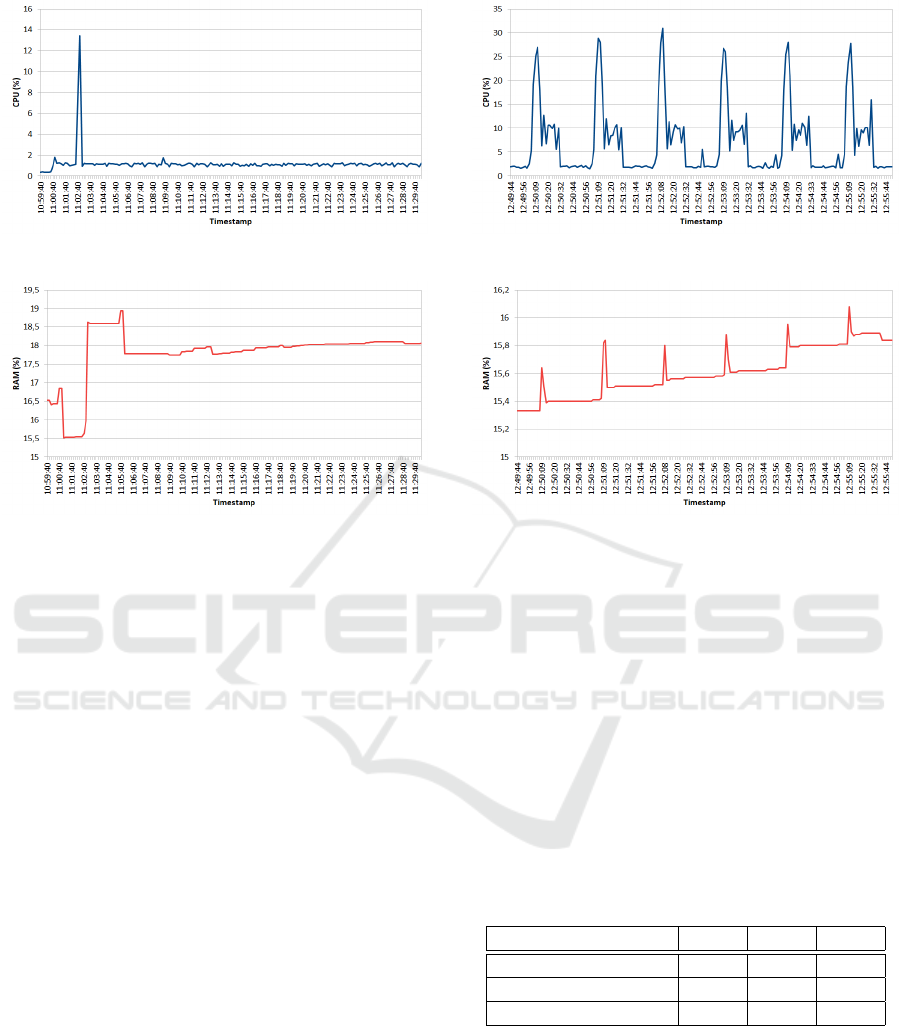
Figure 8: CPU measurement results for 50 pot clusters.
Figure 9: Memory measurement results for 50 pot clusters.
• in the second 10 minutes we applied sensor data
generation frequency of 10 seconds;
• in the following 5 minutes we applied sensor data
generation frequency of 2 seconds;
• and in the last 5 minutes we applied sensor data
generation frequency of 10 seconds, again.
The resource usage sampling by the monitoring
scripts were set to 10 seconds. They queried CPU and
memory resource utilization for all containers, and we
summed them to get the total resource consumption of
the composed service (thus of the whole VM). We can
see the measurement results for this initial round sim-
ulating 250 pots in Figure 6 and Figure 7. The x axis
denotes the timestamps of resource usage sampling,
while the y axis denotes the resource usage percent-
age. We can see that there are some spikes in both
resource usage percentages after the first 10 minutes,
when we start to send more messages, and from the
20th minute the utilization is clearly rising. (Note that
the resource using sampling is less frequent than the
arrival rate of the messages.)
Next, we set the simulation parameters in a way
to mimic future, real world utilization. Our proposed
IoLT Smart Pot is basically a cluster of 12 pots, as
shown in Figure 2. To evaluate the scalability of
our gateway solution, we performed three simulation
measurements with 50, 100 and 250 clusters (com-
posed of 600, 1200 and 3000 pots respectively). In
all cases we performed the measurements for half an
Figure 10: CPU measurement results for 100 pot clusters.
Figure 11: Memory measurement results for 100 pot clus-
ters.
hour, and the simulated smart pot platform sent sensor
values with the following periods:
• in the first 10 minutes we applied sensor data gen-
eration frequency of 5 minutes (which means that
each pot sent a message of 7 sensor values every
5 minutes: resulting 2 messages in this period per
pot);
• in the second 10 minutes we applied sensor data
generation frequency of 1 minute;
• and in the last 10 minutes we applied sensor data
generation frequency of 5 minutes, again.
Table 1: Comparison of the three evaluation rounds.
No. of clusters 50 100 250
No. of pots 600 1200 3000
Max. CPU util. (%) 13.42 30.91 39.29
Max. Mem. util. (%) 18.94 18.1 24.73
In the first simulation for 50 clusters we set the
sampling of resource usage (processor and memory
usage) in every 10 seconds, while for the second and
the third one (100 and 250 clusters) we set it to 2 sec-
onds (to have a better resolution of resource loads).
We can see the measurement results for the first
round simulating 50 clusters with 600 pots in Figure
8 and Figure 9 for 30 minutes. Here we can see that
the average CPU load varies between 1 and 2 percent,
IoLT Smart Pot: An IoT-Cloud Solution for Monitoring Plant Growth in Greenhouses
149
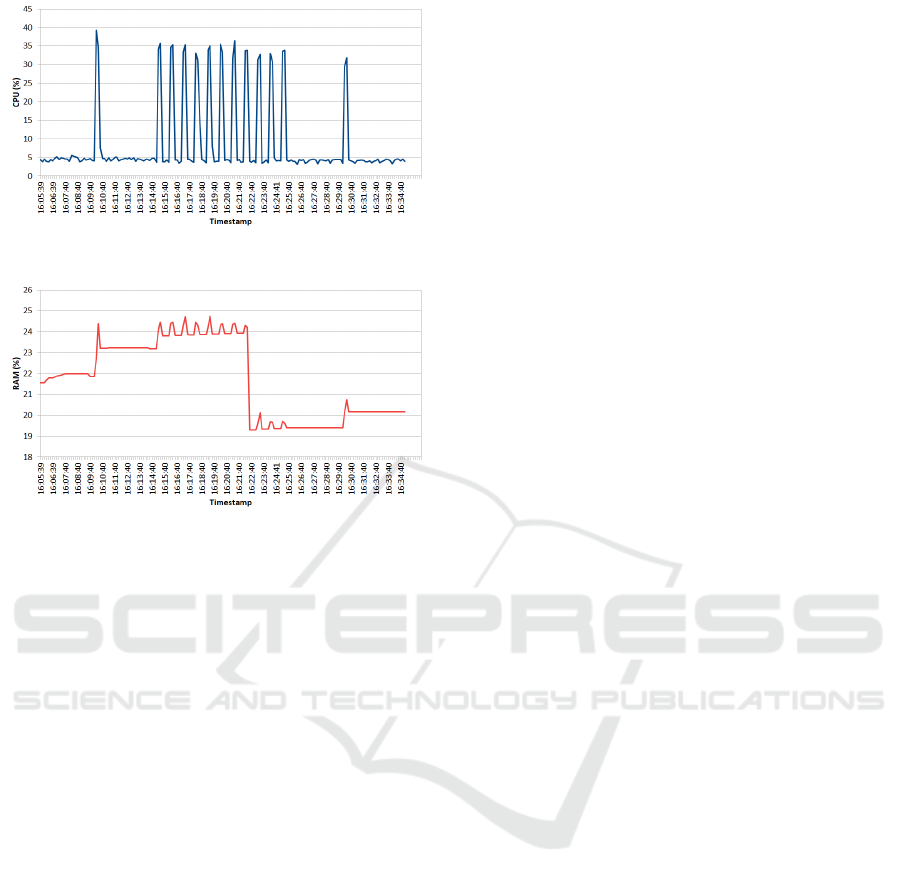
Figure 12: CPU measurement results for 250 pot clusters.
Figure 13: Memory measurement results for 250 pot clus-
ters.
and the memory usage fluctuates between 15 and 19
percent. In this experiment we also observed that the
time of an actual data processing (receiving a message
and writing its contents to the database) and the time
of the resource usage sampling are rarely matched.
One matching example can be seen right after the 3rd
minute in Figure 8, which shows a spike with almost
14 percent of CPU utilization.
For the second round we doubled the number of
clusters to 100, and performed the simulation only for
5 minutes with detailed resource usage sampling of
2 seconds. We can see the measurement results for
this round simulating 100 clusters with 1200 pots in
Figure 10 and Figure 11. Now the results reveal a
periodic resource usage fluctuation denoting the data
processing activities.
Finally, for the largest experiment we further in-
creased the number of pot clusters to 250 arriving to
a total number of 3000 simulated pots. For this third
round, we performed the simulation for 30 minutes,
again, with the same periods as defined for the first
round (of 50 clusters). We can see the measurement
results in Figure 12 and Figure 13. If we take a look at
the middle 10 minutes period we can see the periodic
resource usage spikes, as in the previous round.
To summarize our investigations, Table 1 com-
pares the maximum resource utilization values mea-
sured during the experiments. We can see that by
increasing the number of pots to be managed by the
gateway service, the utilization raises. As expected,
the CPU utilization was the highest in the third round
managing 3000 pots at a time with more than 40 per-
cent, and the memory utilization is also the highest
with almost 25 percent. These results show that we
can easily serve numerous phenotyping projects mon-
itoring up to thousands of pots with a single gateway
instance in a Cloud.
4.3 Evaluation with Real Pots
After the simulation experiments proved the usability
of our gateway service, we have tested the IoLT Smart
Pot platform with real world utilization. We placed 12
Arabidopsis plants in small pots to the prototype clus-
ter (as shown in Figure 2), and configured the smart
pot (its python scripts running in the Raspberry Pi
board under the cluster) to send the sensor values reg-
ularly to the IoT-Cloud gateway service. The wiring
of the smart pot prototype allowed us to consider the
whole cluster as a single IoT device, meaning that 7
sensors was placed in the cluster in total (for some
of the 12 pots). We performed the monitoring of the
growth of Arabidopsis plants under standard green-
house conditions for more than a month. RGB imag-
ing was performed every one hour, and sensor sam-
pling frequency was set to 5 minutes (resulting in one
JSON message per 5 minutes). Figure 14 shows a
query at the gateway web interface for one week of
monitoring the real IoLT Smart Pot prototype. Fig-
ure 15 shows the pictures taken on 2018.12.01., and
one month later, revealing the growth of the moni-
tored plants.
The biologists performed a post-processing of the
monitored data by downloading them from the gate-
way portal. Figure 16 depicts the time course of leaf
area growth of Arabidopsis plants. The red curve
shows the time dependence of projected leaf area in
an 8 days time window, while the blue curve in the
inset shows the same for the whole 29 days of the ex-
periment. The data represent the mean value for the
12 plants placed in Smart Pot cluster. The time course
of the projected leaf area revealed a cirkadian oscilla-
tion pattern due to periodic leaf movement (flattening
in the dark and erection in the light period).
5 CONCLUSION
Agriculture takes a significant role in greenhouse gas
emissions, therefore smart farming solutions have
started to be developed to improve productivity and
reduce waste by exploiting new ICT technologies,
such as the Internet of Things. Affordable pheno-
CLOSER 2019 - 9th International Conference on Cloud Computing and Services Science
150
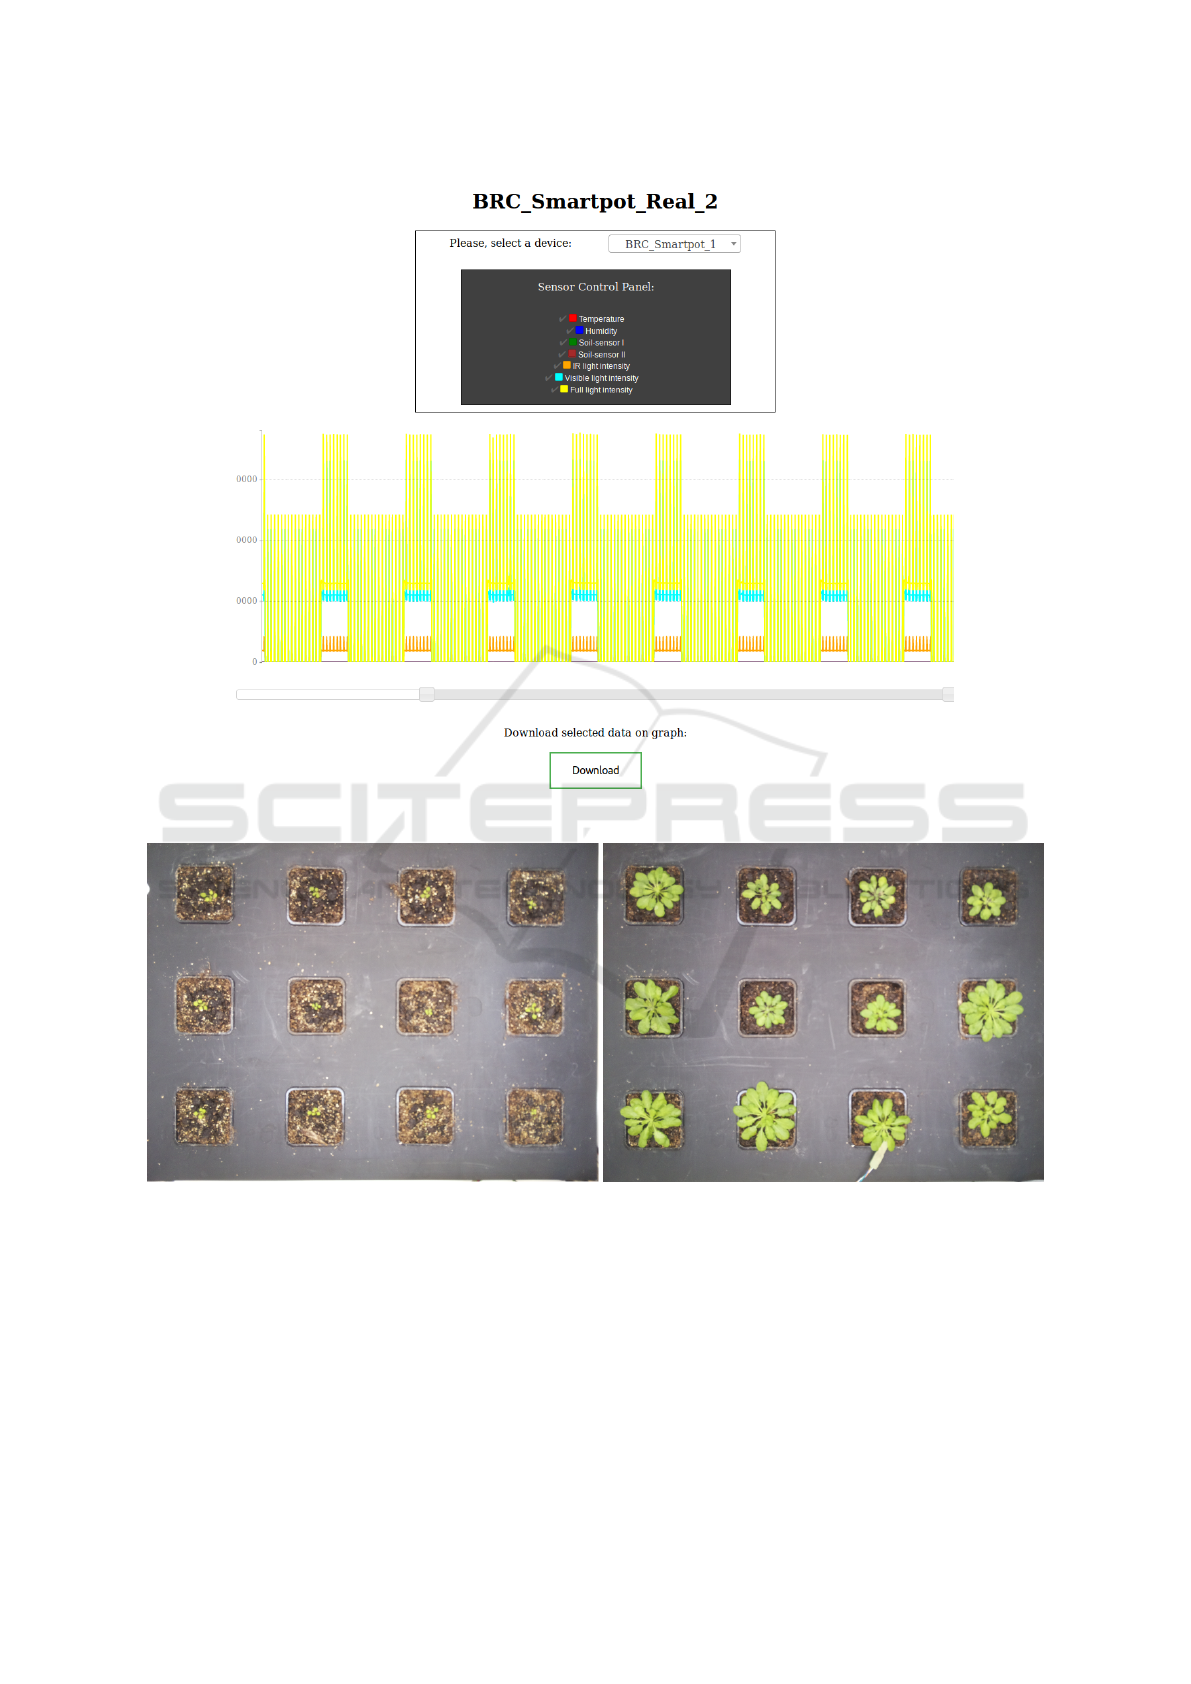
Figure 14: Real world measurement data visualization in the IoLT Smart Pot Gateway.
Figure 15: Pictures of a Smart Pot cluster taken at 2018.12.01 (left), and 2019.01.01 (right).
typing represents a related research area that aims
to apply low cost sensors and computing solutions
for smart monitoring of plants with high flexibility in
standard greenhouse environments.
To contribute to this aim, in this paper we pro-
posed the IoLT Smart Pot Platform, which is capa-
ble of monitoring environmental parameters with IoT
technology by placing sensors above the plants and
into the pots. We also developed a private IoT-Cloud
gateway for receiving, storing, visualizing and down-
loading the monitored parameters sent by the IoT de-
vices of the pots. We have performed the evaluation
of our proposed platform both with simulated and real
smart pots, and the results proved the scalability and
flexibility of our platform.
Our future work will address further improve-
ments of the smart pot by attaching further sensors,
and we also plan to extend the IoT-Cloud gateway
IoLT Smart Pot: An IoT-Cloud Solution for Monitoring Plant Growth in Greenhouses
151
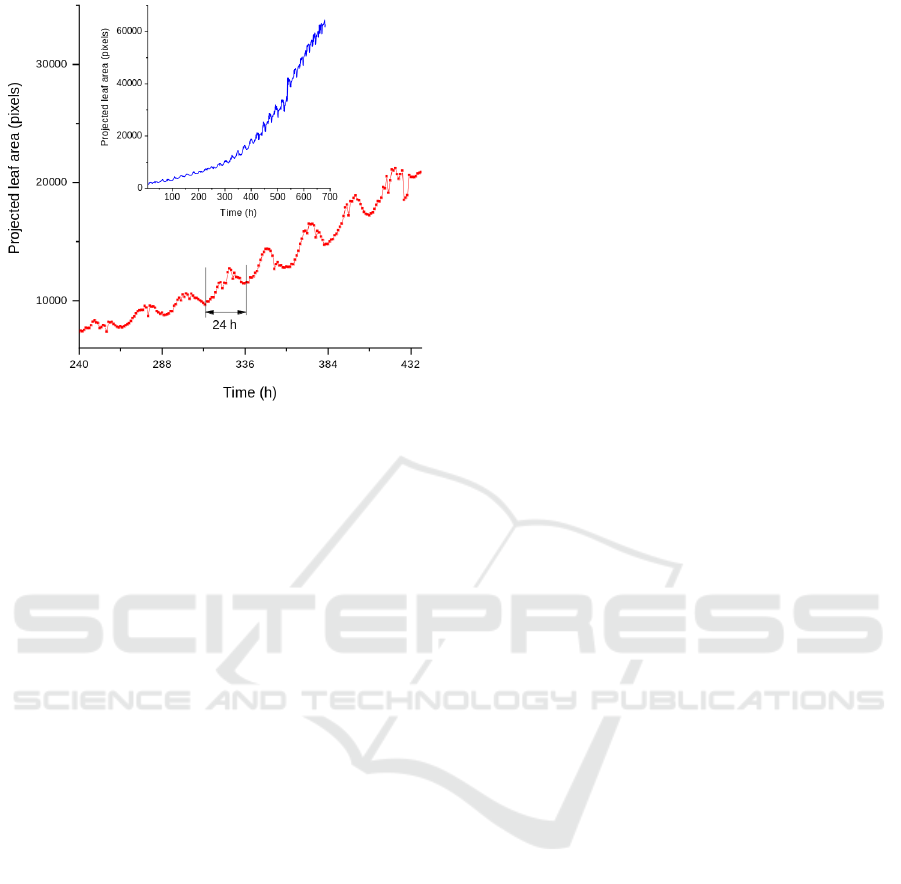
Figure 16: Post-processed environmental results of the real
experiment.
with additional services for postprocessing the moni-
tored environmental data.
ACKNOWLEDGEMENTS
The research leading to these results was supported
by the Hungarian Government and the European
Regional Development Fund under the grant num-
ber GINOP-2.3.2-15-2016-00037 (”Internet of Liv-
ing Things”), and by the Ministry of Human Ca-
pacities of Hungary under the grant number 20391-
3/2018/FEKUSTRAT. The authors also thank for the
usage of the MTA Cloud (MTA Cloud, 2018) that
helped us achieve the results published in this paper.
REFERENCES
Beecham Research. 2017. Smart Farming.
Smart Farming Sales Brochure, http://www.
beechamresearch.com/files/Beecham%20Research
%20%C2%BB%20Smart%20Farming%20(sales)
%202017%20.pdf
H. Sundmaeker, P. Guillemin, P. Friess, S. Woelffle. 2010.
Vision and challenges for realising the Internet of
Things. CERP IoT, Cluster of European Research
Projects on the Internet of Things, CN: KK-31-10-
323-EN-C.
J. Mahoney and H. LeHong. 2011. The Inter-
net of Things is Coming. Gartner report,
https://www.gartner.com/doc/1799626/internet-
things-coming
Buyya, R., Yeo, C. S., Venugopal, S., Broberg, J., and
Brandic, I. 2009. Cloud computing and emerging
IT platforms: Vision, hype, and reality for delivering
computing as the 5th utility. Future Generation Comp.
Syst, 25(6):599–616.
P. Sharma. 2018. Xiaomi Smart Flower Pot Flora
Review, https://www.xiaomitoday.com/xiaomi-smart-
flower-pot-flora-review/, December, 2018.
Parrot Pot, https://www.parrot.com/global/connected-gar
den/parrot-pot, December, 2018.
CzedikEysenberg, A., Seitner, S., Gldener, U., Koemeda,
S., Jez, J., Colombini, M. and Djamei, A. 2018. The
’PhenoBox’, a flexible, automated, opensource plant
phenotyping solution. New Phytol, 219: 808-823.
A. Brogi, S. Forti, A. Ibrahim and L. Rinaldi. 2018. Bonsai
in the Fog: An active learning lab with Fog comput-
ing. Third International Conference on Fog and Mo-
bile Edge Computing (FMEC), Barcelona, pp. 79-86.
R. Dagar, S. Som and S. K. Khatri. 2018. Smart Farm-
ing – IoT in Agriculture. International Confer-
ence on Inventive Research in Computing Applica-
tions (ICIRCA), Coimbatore, India, pp. 1052-1056.
Kaa project website, https://www.kaaproject.org/documen
tation/, January, 2019.
B. Kang, D. Kim, H. Choo. 2017. Internet of Everything:
A Large-Scale Autonomic IoT Gateway. IEEE Trans-
actions on Multi-Scale Computing Systems, vol. 3, no.
3, pp. 206–214.
Mosquitto website, https://mosquitto.org/, November,
2018.
MongoDB website, https://www.mongodb.com/what-is-
mongodb, September, 2018.
Docker Container Environment, https://www.docker.com/,
September, 2018.
MTA Cloud service, https://sztaki.cloud.mta.hu, Septem-
ber, 2018.
IoLT Smart Pot Gateway on GitHub, https://github.com/
sed-inf-u-szeged/IoLT-Smart-Pot-Gateway, January,
2019.
CLOSER 2019 - 9th International Conference on Cloud Computing and Services Science
152
